Connecting SenseCAP to Grafana via Node-RED
SenseCAP K1100 - The Sensor Prototype Kit represents Seeed Studio concentrating the essence of LoRa® communication on technology and edge intelligence products, for the easiest deploying and mastering of LoRa® and IoT applications.

Upgradable to Industrial Sensors
With the SenseCAP S2110 controller and S2100 data logger, you can easily turn the Grove into a LoRaWAN® sensor. Seeed not only helps you with prototyping but also offers you the possibility to expand your project with the SenseCAP series of robust industrial sensors.
The IP66 housing, Bluetooth configuration, compatibility with the global LoRaWAN® network, built-in 19 Ah battery, and powerful support from APP make the SenseCAP S210x the best choice for industrial applications. The series includes sensors for soil moisture, air temperature and humidity, light intensity, CO2, EC, and an 8-in-1 weather station. Try the latest SenseCAP S210x for your next successful industrial project.


Grafana
Grafana is an open source solution for running data analytics, pulling up metrics that make sense of the massive amount of data & to monitor our apps with the help of cool customizable dashboards. Grafana connects with every possible data source, commonly referred to as databases such as Graphite, Prometheus, Influx DB, ElasticSearch, MySQL, PostgreSQL etc. Grafana being an open source solution also enables us to write plugins from scratch for integration with several different data sources. The tool helps us study, analyse & monitor data over a period of time, technically called time series analytics.
It helps us track the user behaviour, application behaviour, frequency of errors popping up in production or a pre-prod environment, type of errors popping up & the contextual scenarios by providing relative data.

The content of this chapter will continue to use the Node-RED introduced earlier and use Grafana to visualize data from your InfluxDB 2.4 instance.
Before doing so, please prepare the following.
-
If you haven't installed or don't know what Node-RED is, please refer to Node-RED & SenseCAP Tutorials.
-
Start by deploying SenseCAP to InfluxDB's Node RED, details of which can be found in the wiki Connect SenseCAP to InfluxDB via Node-RED.
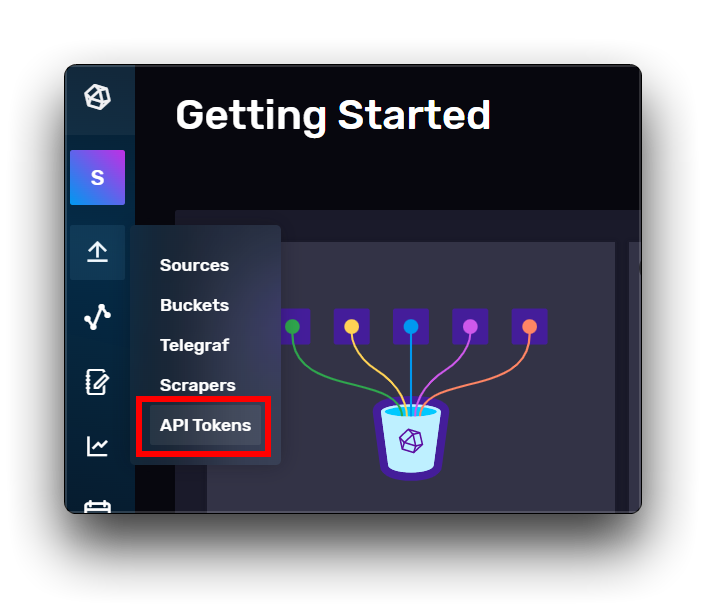
Create MQTT Node
Step 1. Start Node-RED
Start Node-RED by typing the command node-red in the terminal and open a browser and enter the address http://localhost:1880 in the address bar to access the editor of Node-RED.
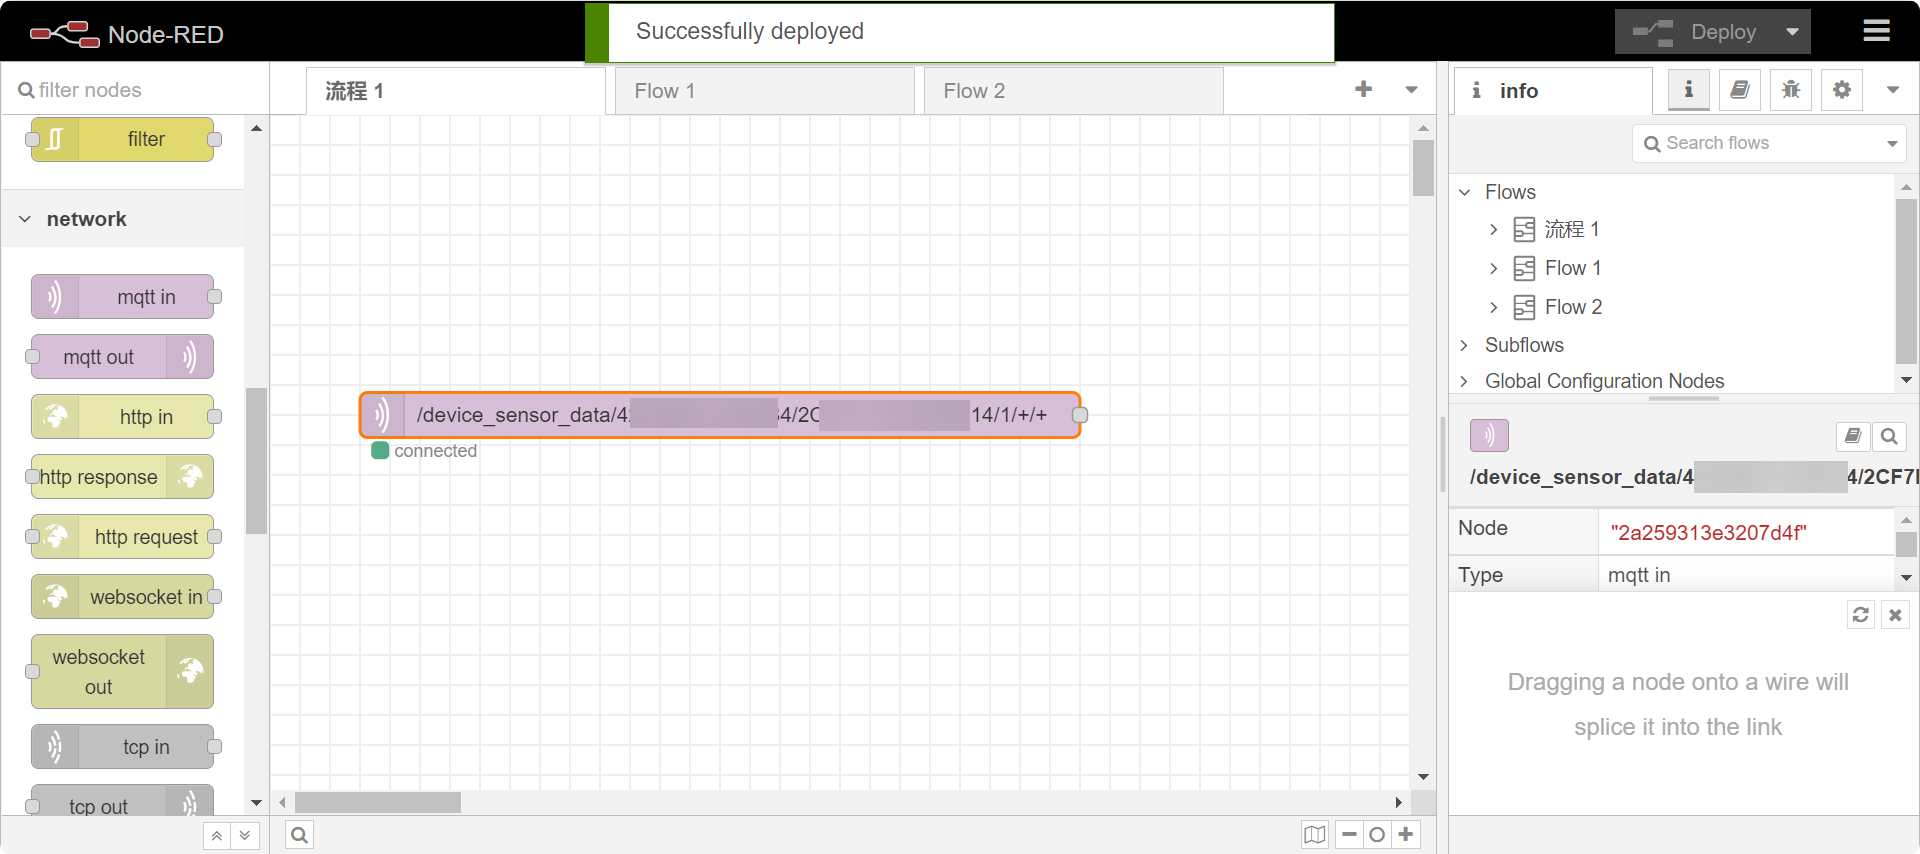
Step 2. Create MQTT Node
We use Network -> mqtt in node and configure mqtt in the format of the SenseCAP API as requested in the previous tutorial.
-
Server: openstream.api.sensecap.seeed.cc
-
Port: 1883
-
Protocol: MQTT V3.1.1
-
Client ID: The format is
org-<Organization ID>-<Random ID><Orgnization ID>Your organization ID. We have obtained it in the Get the SenseCAP API.<Random ID>uses your own randomly generated numbers or lowercase letters.
-
Topic Format:
/device_sensor_data/<OrgID>/<DeviceEUI>/<Channel>/<Reserved>/<MeasurementID>
| OrgID | Your organization ID. We have obtained it in the Get the SenseCAP API. |
| DevEUI | Unique identification of sensor devices. This information can be found on the sticker on the back of the Grove - Wio E5, as well as in the SenseCAP console device. |
| Channel | A physical interface on the device to which the sensor is connected. For the K1100 kit, the default value here is 1. |
| Reserved | Reserved Fields. |
| MeasurementID | Measured value ID. This ID can be found in the Measurement IDs section of the SenseCAP documentation |
Step 3. Validate MQTT nodes
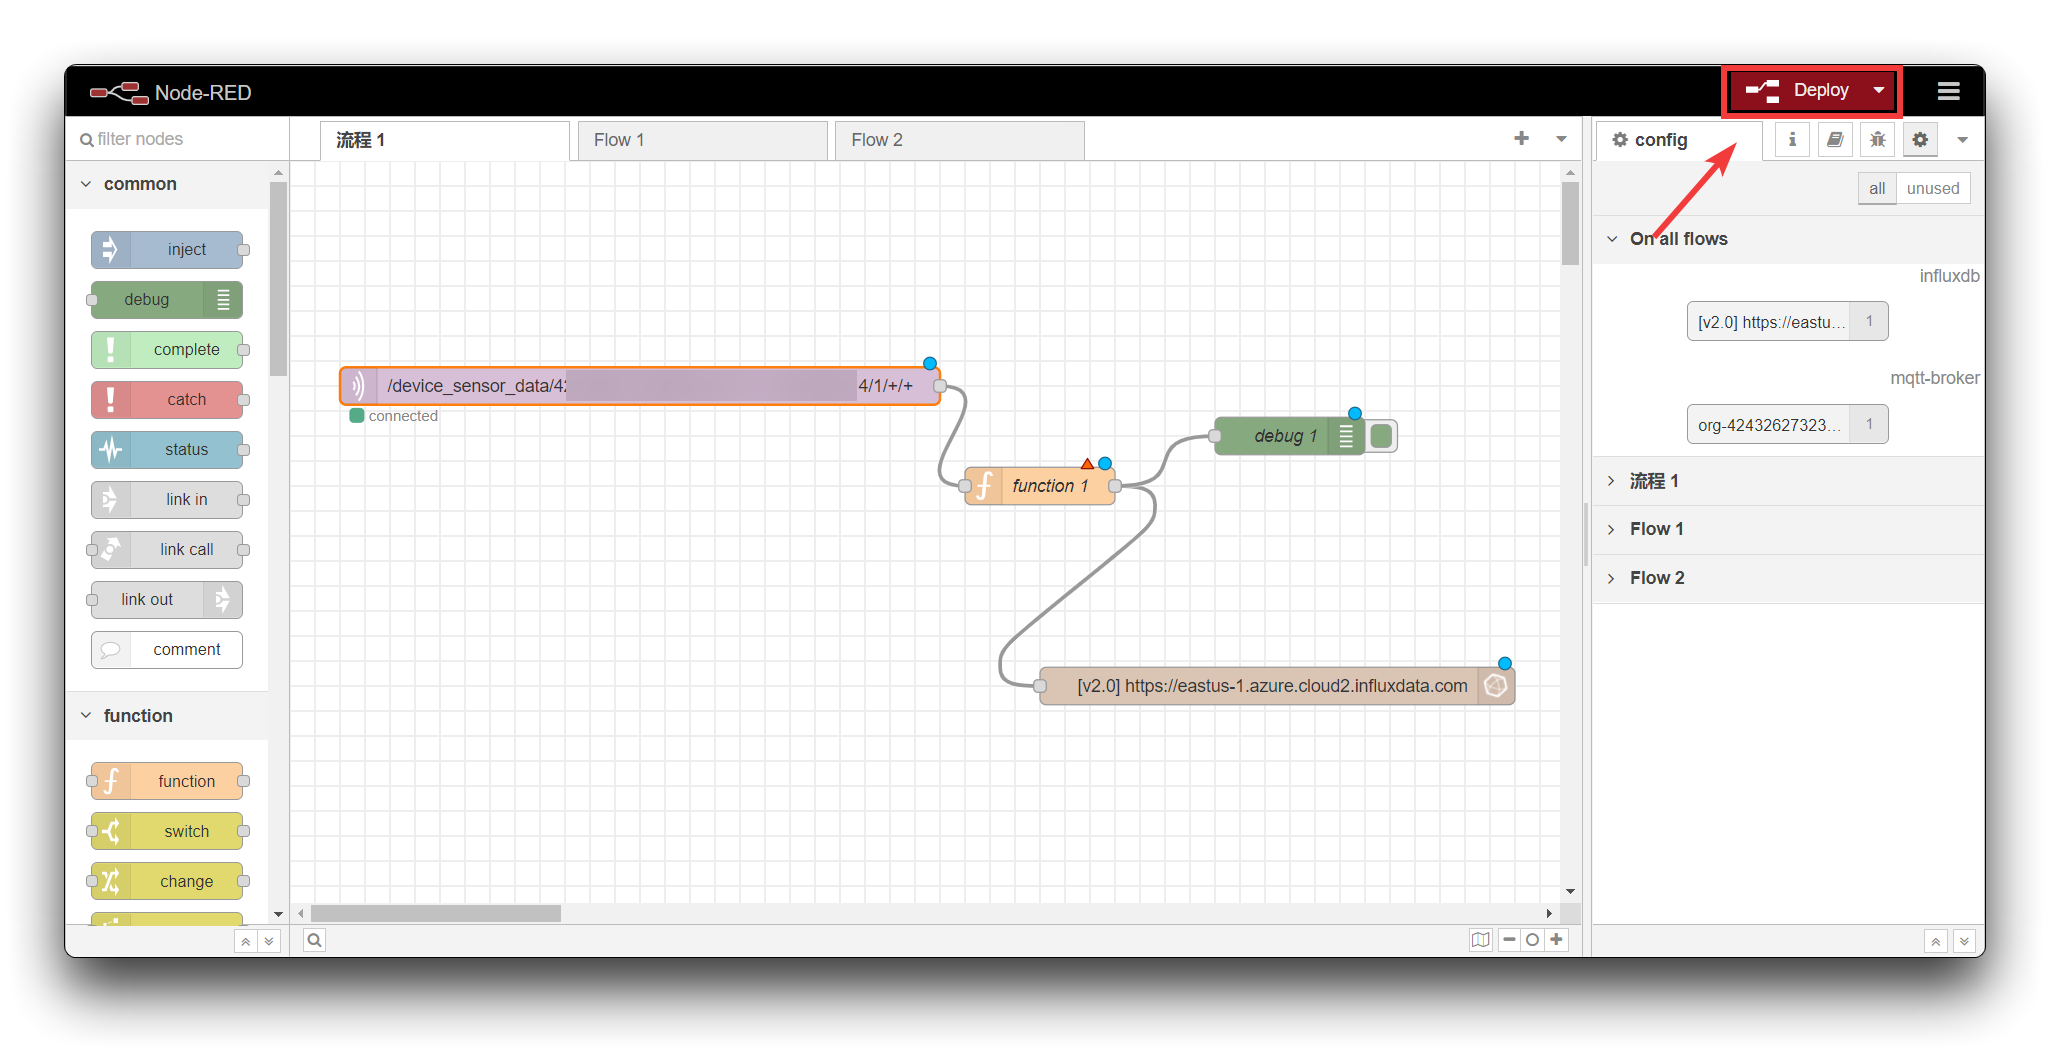
Once configured, please click the Deploy button in the top right corner to check if the configuration was successful. If it is filled in correctly, then the word Connected will be displayed.
Start InfluxDB OSS
You can refer to the detailed tutorial provided by InfuxDB to complete the installation and deployment of InfluxDB, which is compatible with different systems. The following will guide the installation using a Windows 11 system as an example.
Step 1. Download the InfluxDB v2.4
Please click here to download the InfluxDB v2.4 zip file.
Expand the downloaded archive into C:\Program Files\InfluxData\ and rename the files if desired.
Step 2. Start InfluxDB
In Powershell, navigate into C:\Program Files\InfluxData\influxdb and start InfluxDB by running the influxd daemon:
cd -Path 'C:\Program Files\InfluxData\influxdb'
.\influxd
Use Powershell or WSL to execute influx and influxd commands. The command line examples in this documentation use influx and influxd as if installed on the system PATH. If these binaries are not installed on your PATH, replace influx and influxd in the provided examples with .\influx and .\influxd respectively.
By default, InfluxDB uses TCP port 8086 for client-server communication over the InfluxDB HTTP API.
Configure InfluxDB
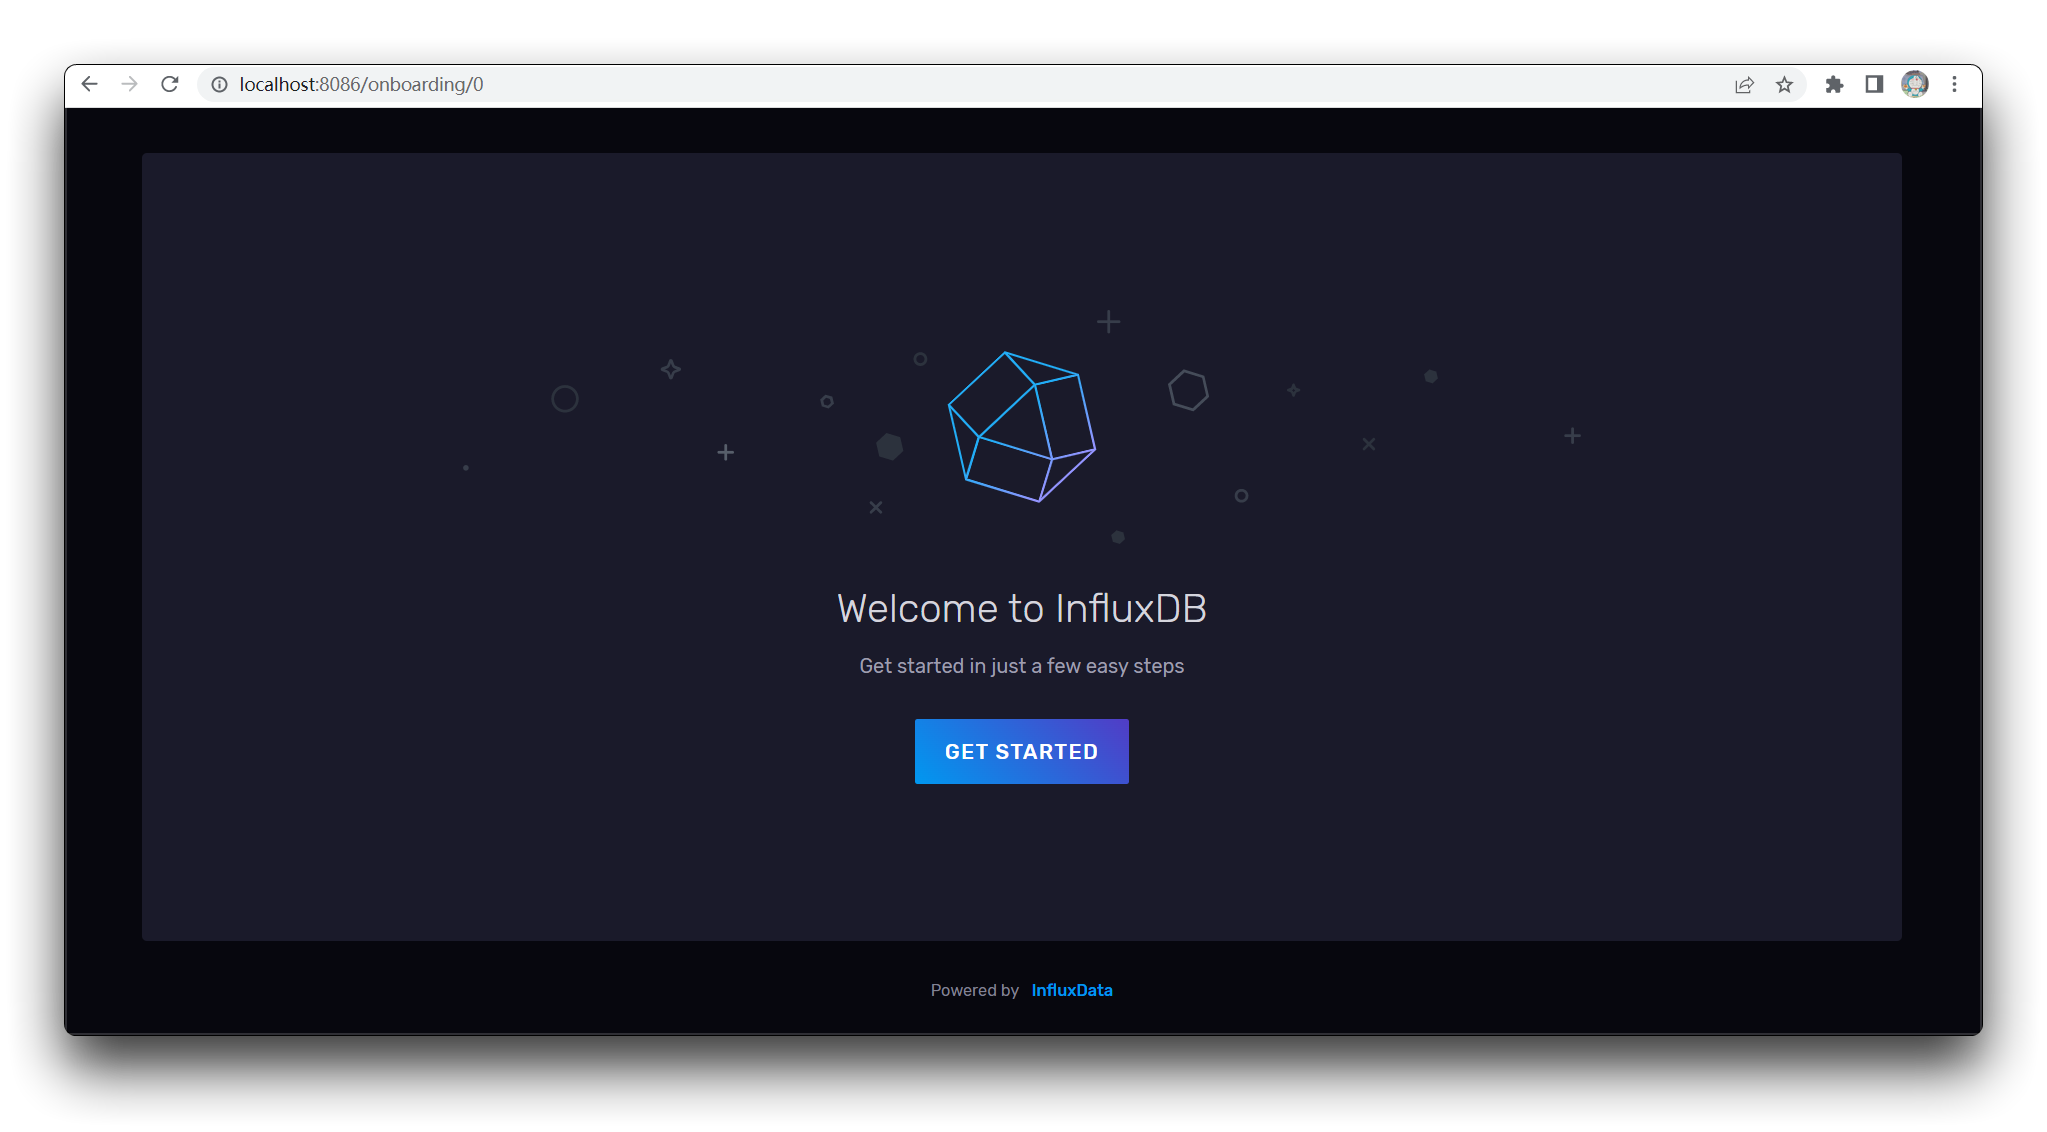
Step 1. Register an InfluxDB account
Continue with the steps above and register an account on the page that opens.
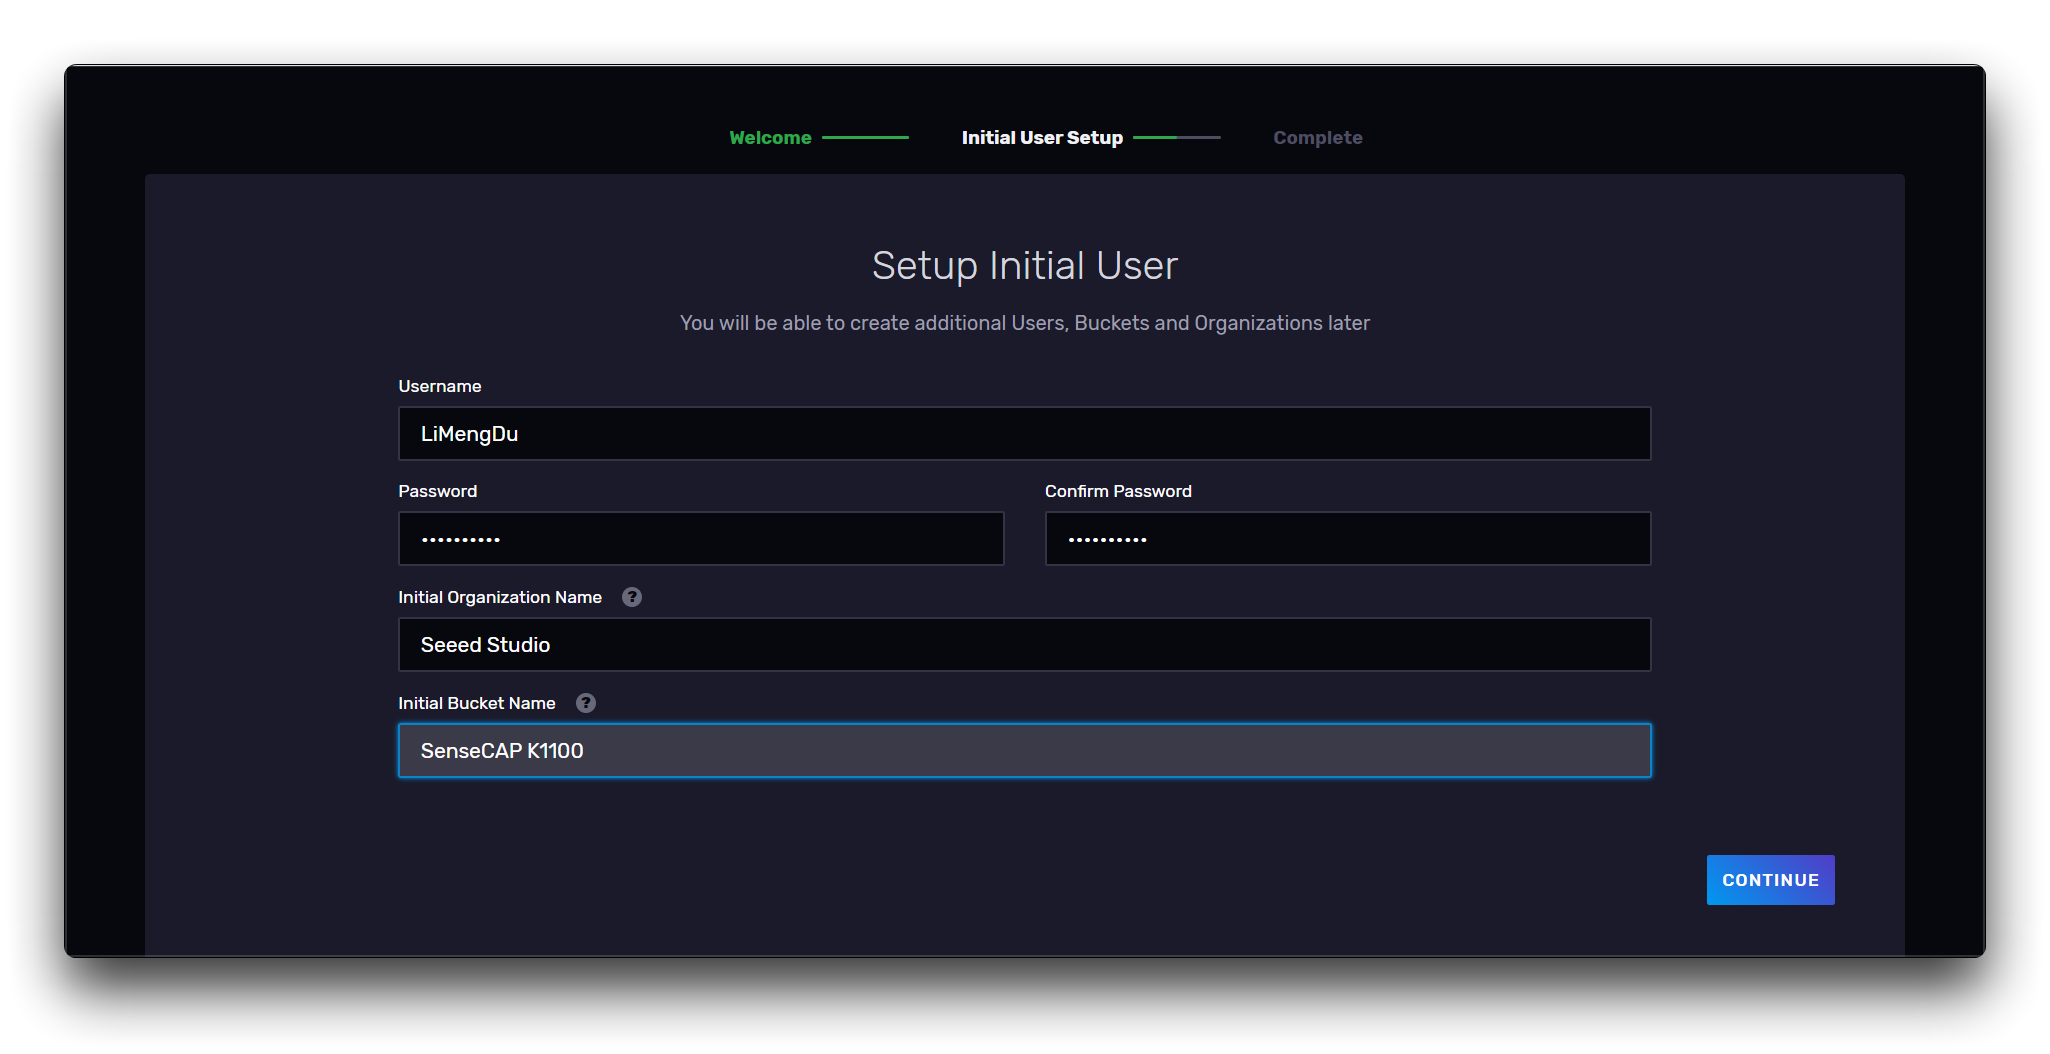
Please make a note of the Organisation Name you set here, we will use it later in the Node RED configuration.
Step 2. Obtain URL
By default, InfluxDB uses TCP port 8086 for client-server communication over the InfluxDB HTTP API.
http://localhost:8086/
For this section the InfluxDB URL is as follows, please note it down, we will use it later in the Node RED configuration.
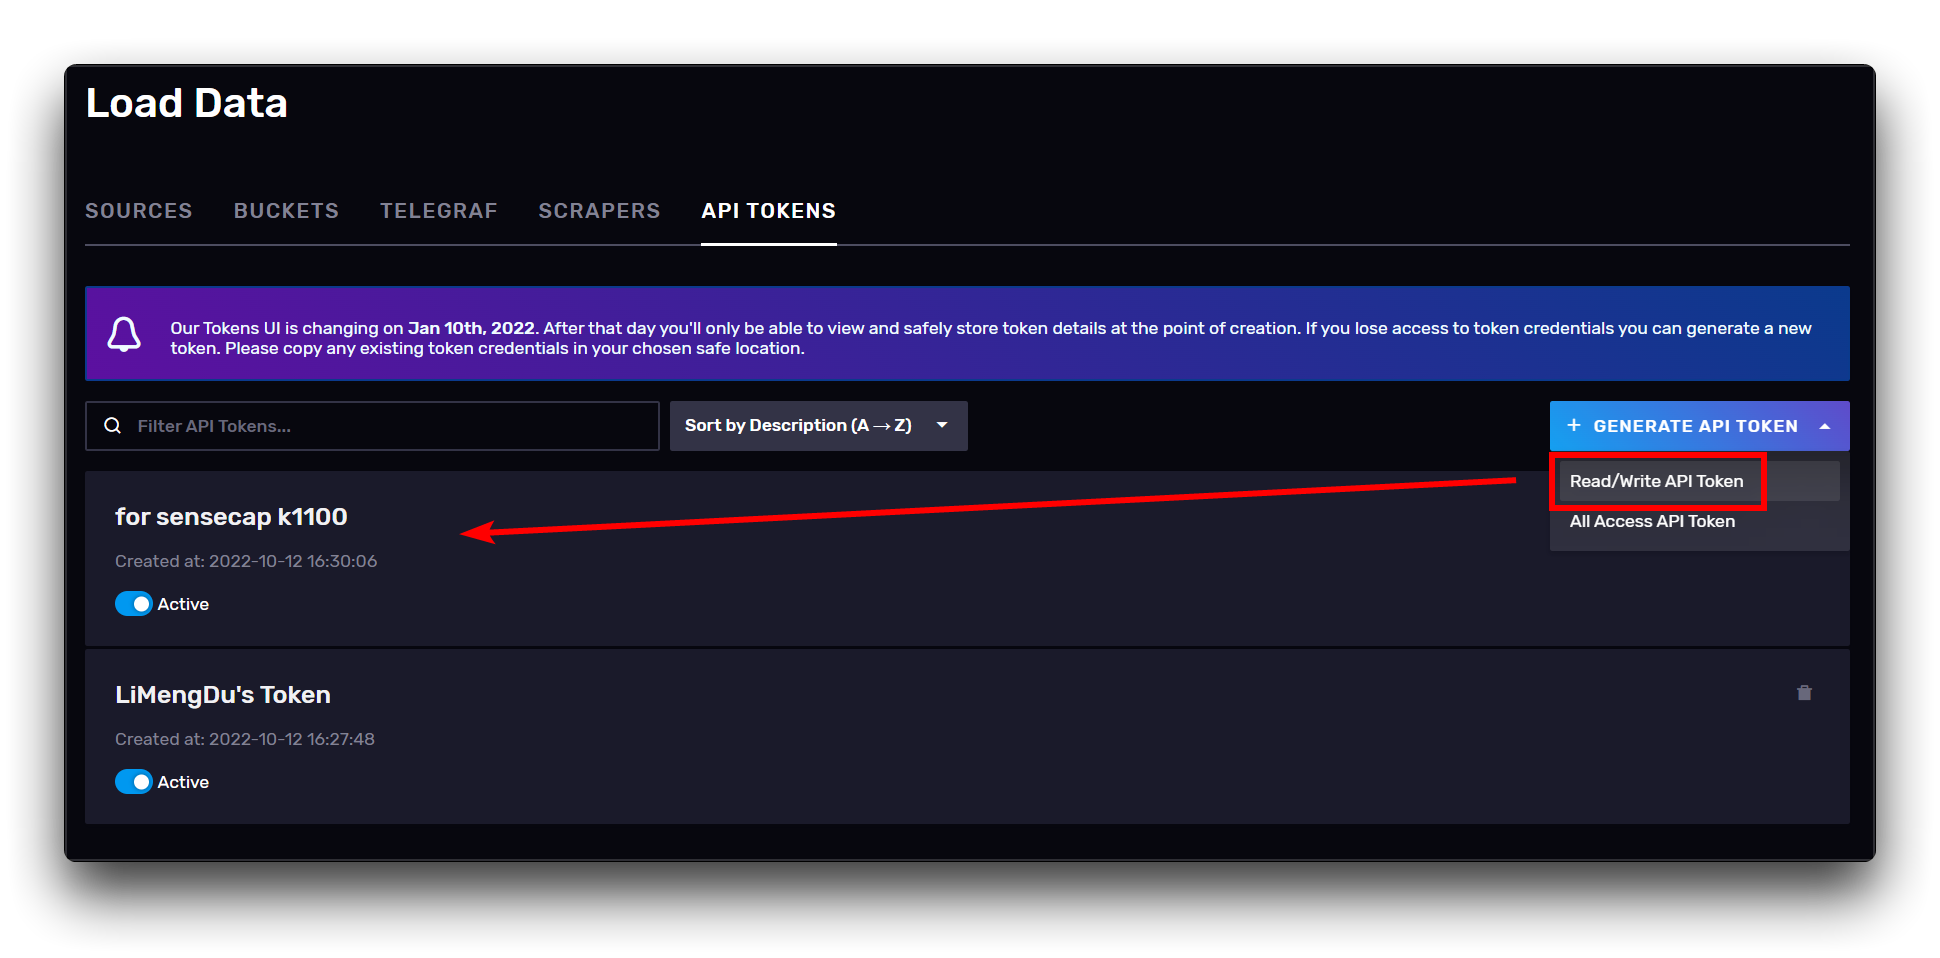
Step 3. Obtain API Token
Go to the API Tokens page as shown below, create a new API interface for Node RED and write down the Token.
Configure Node-RED
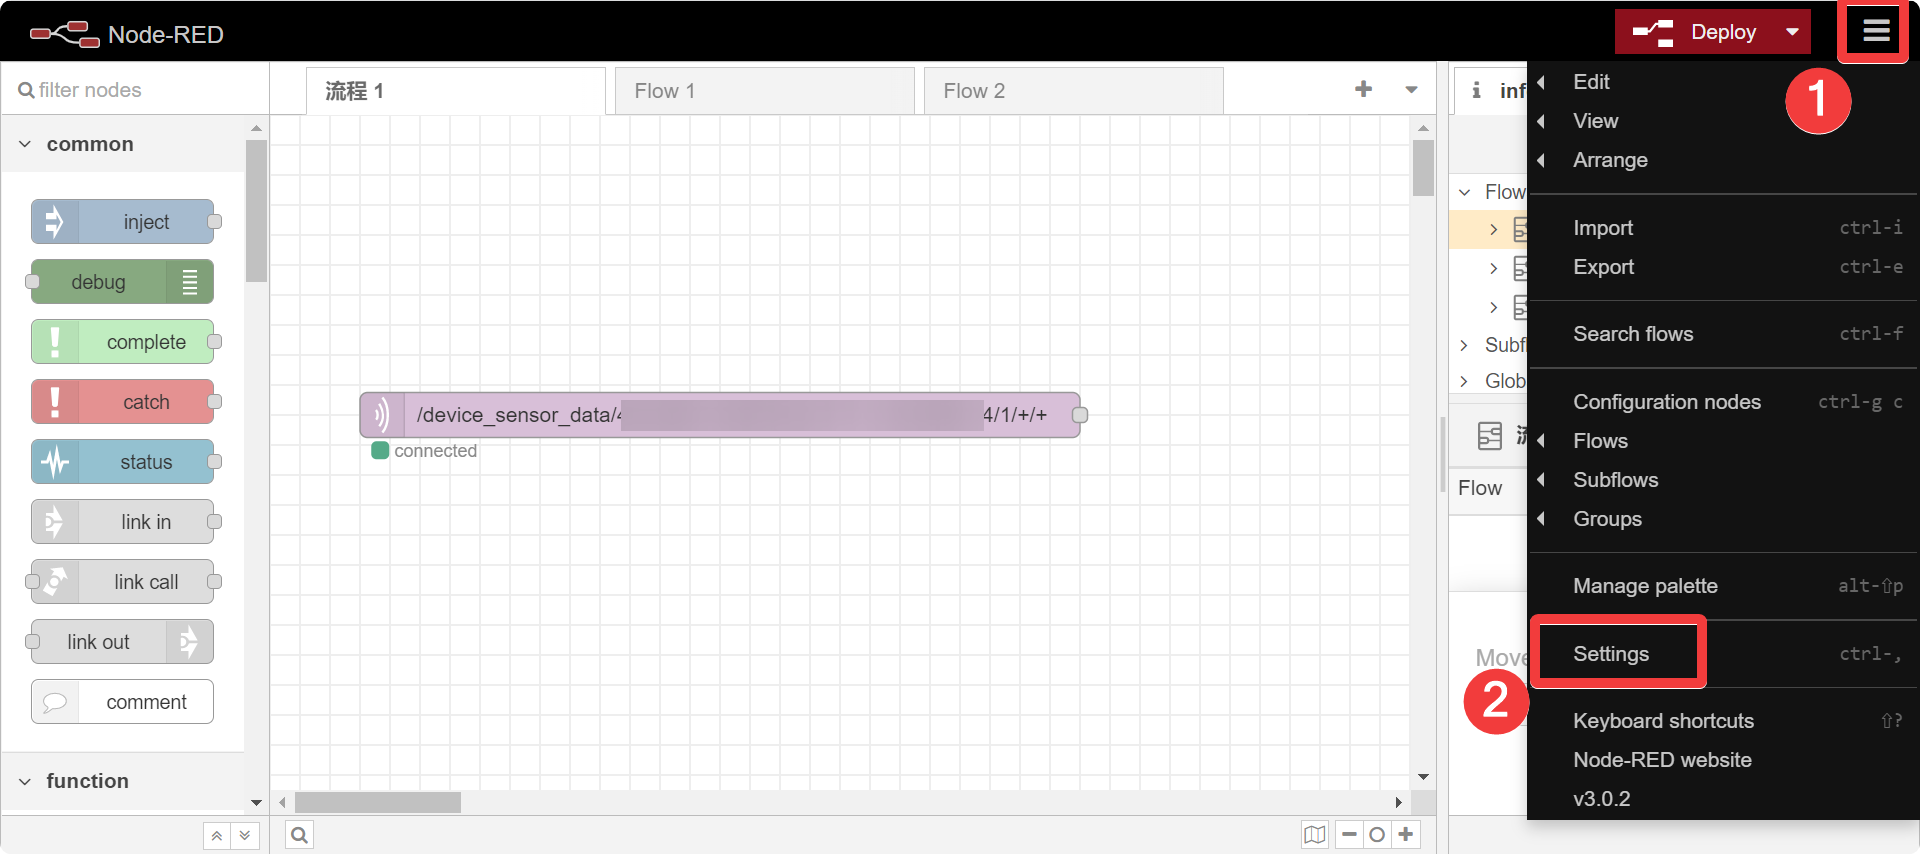
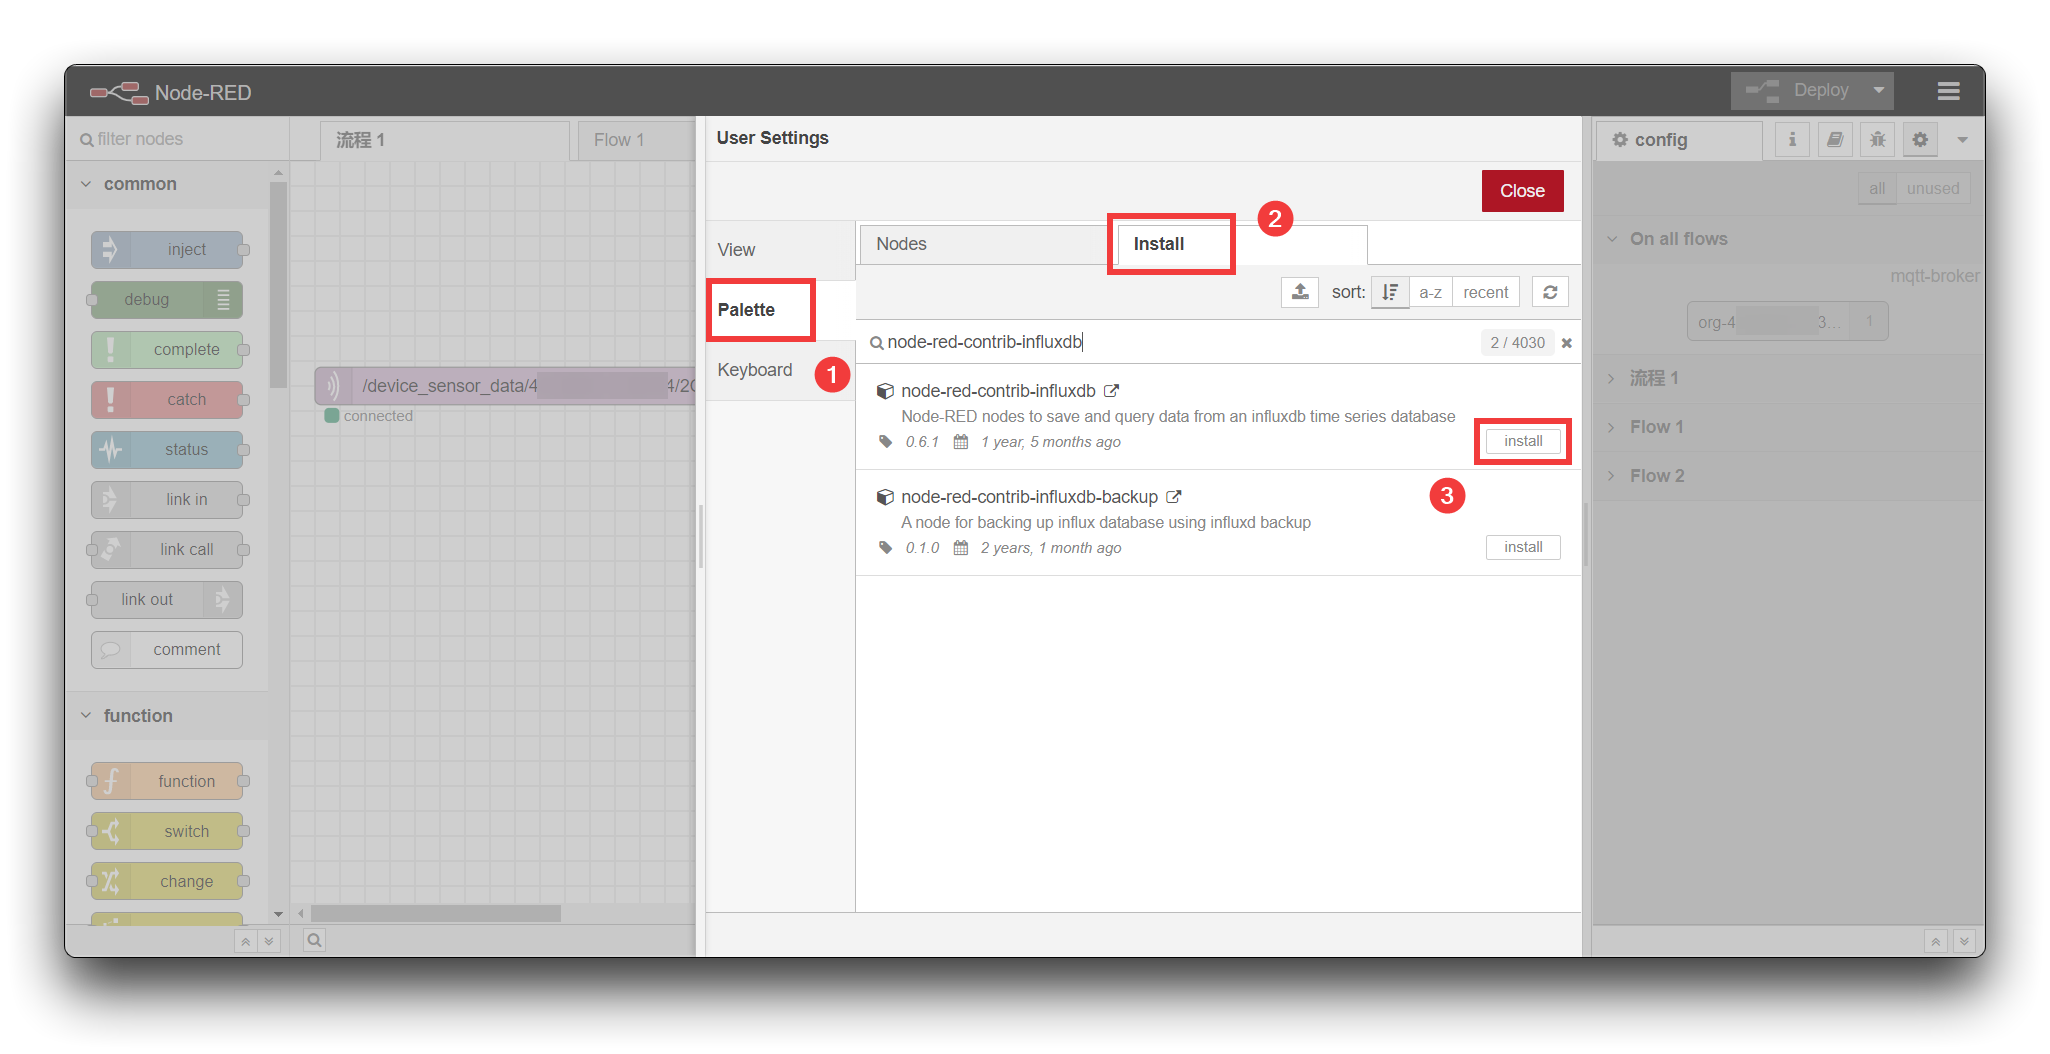
Step 1. Download InfluxDB Paletts
Click on the upper-right menu bar and select Settings.
Search and install node-red-contrib-influxdb in the Paletts -> Install.
Add influx.batch from the storage bar on the left,double-click it to enter the configuration page, then click the edit button to edit influx.batch node.
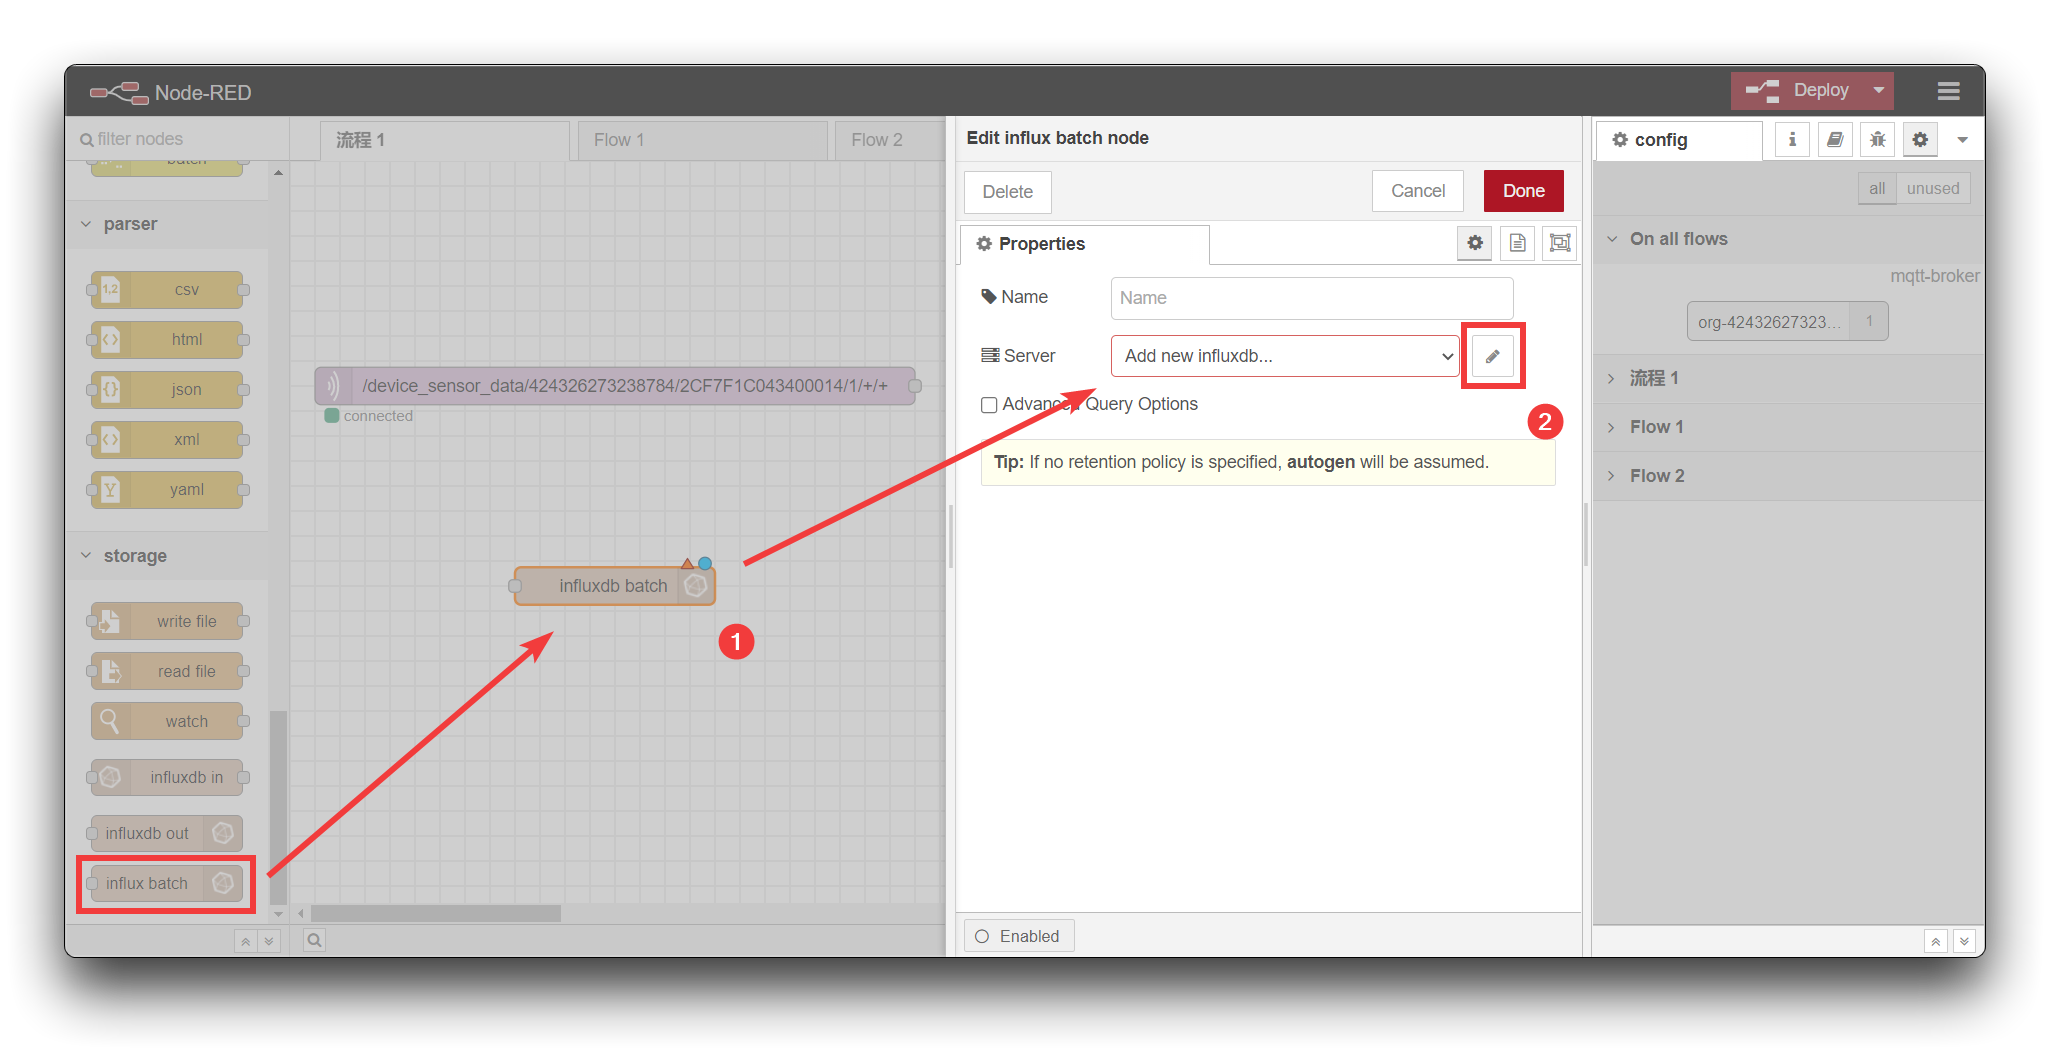
Step 2. Edit influx.batch node:
- Version: 2.0.
- URL: http://localhost:8086/
- TOKEN: Which you generate in Obtain API Token Section.
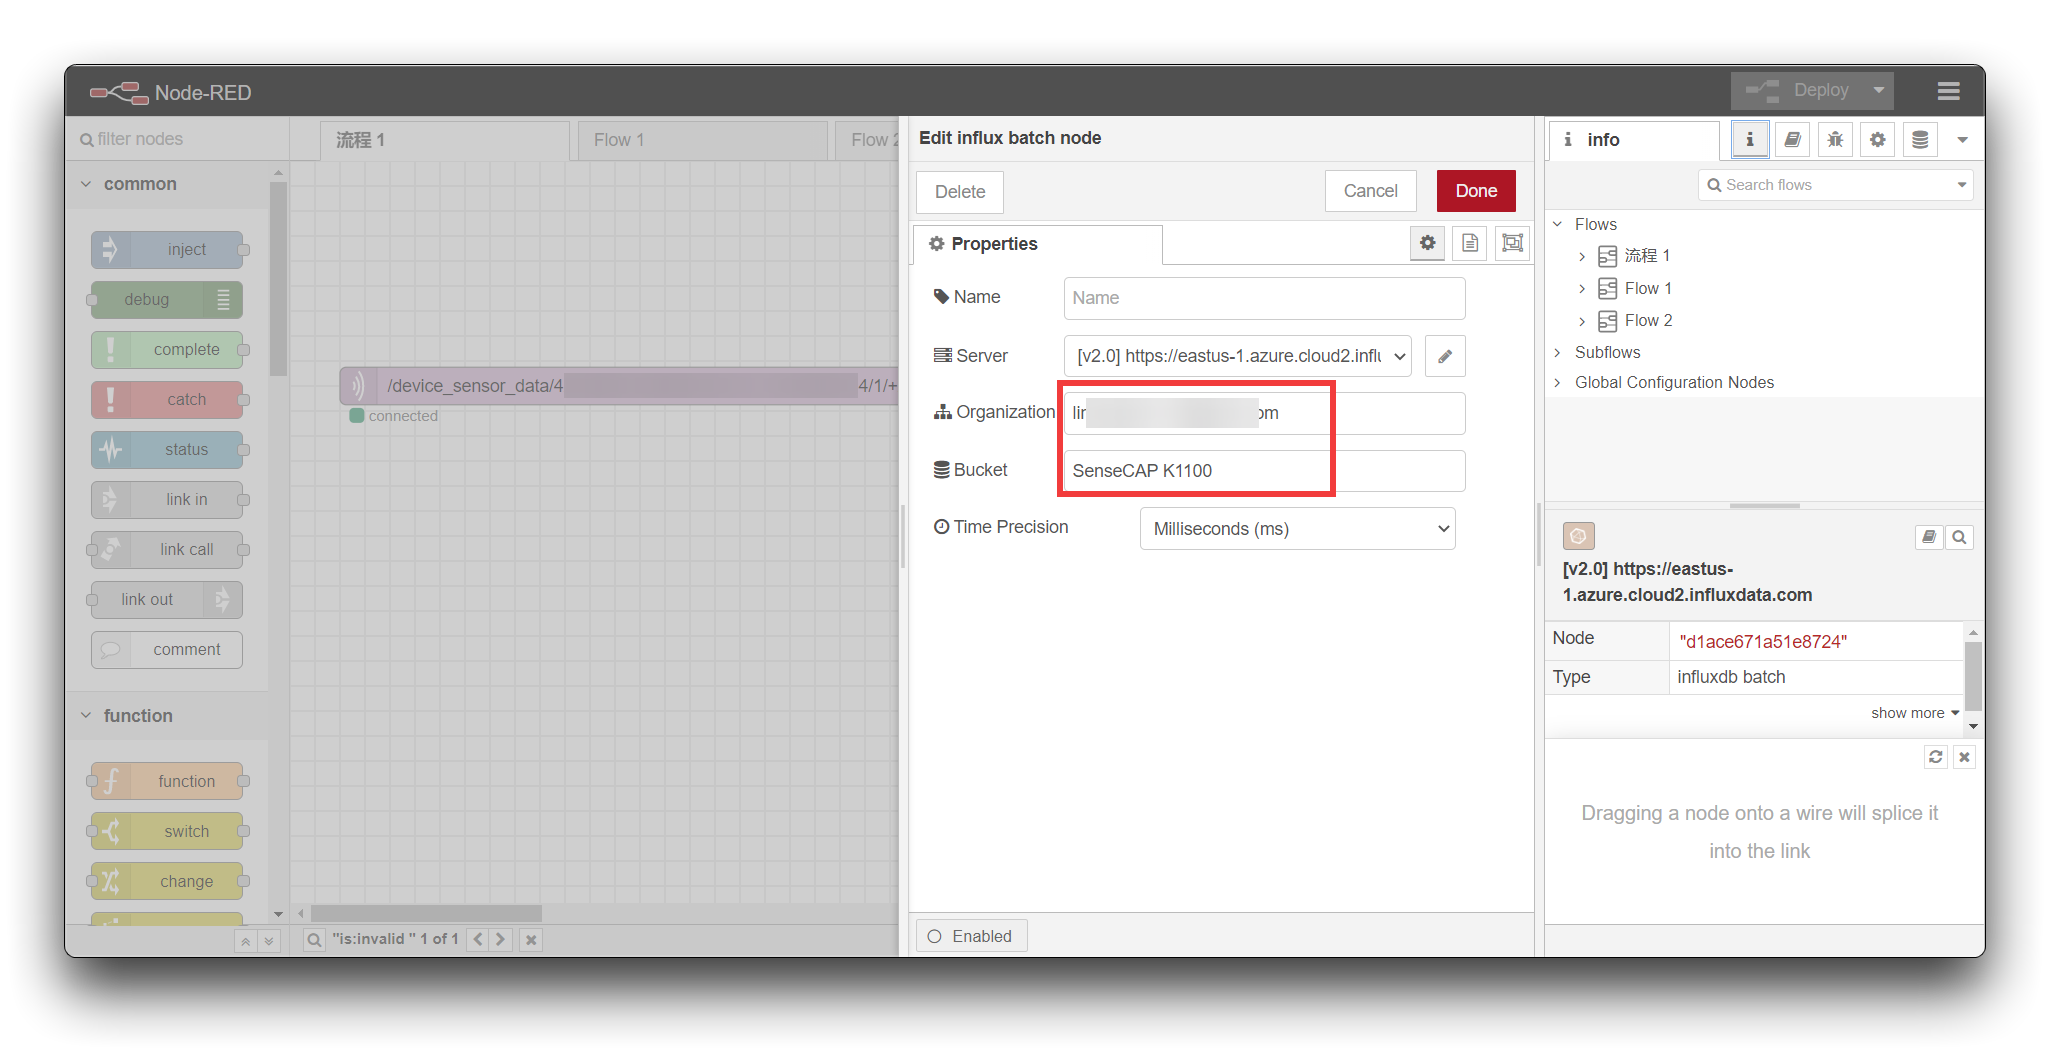
When you have finished click on the Add button in the top right hand corner to return to the properties page of the influx batch, at this point please fill in your Orgnization Name and Bucket name.
Step 3. Configure the function node
Data reporting to InfluxDB needs to follow a specific data format, so it's necessary to add a function node to process the data format.
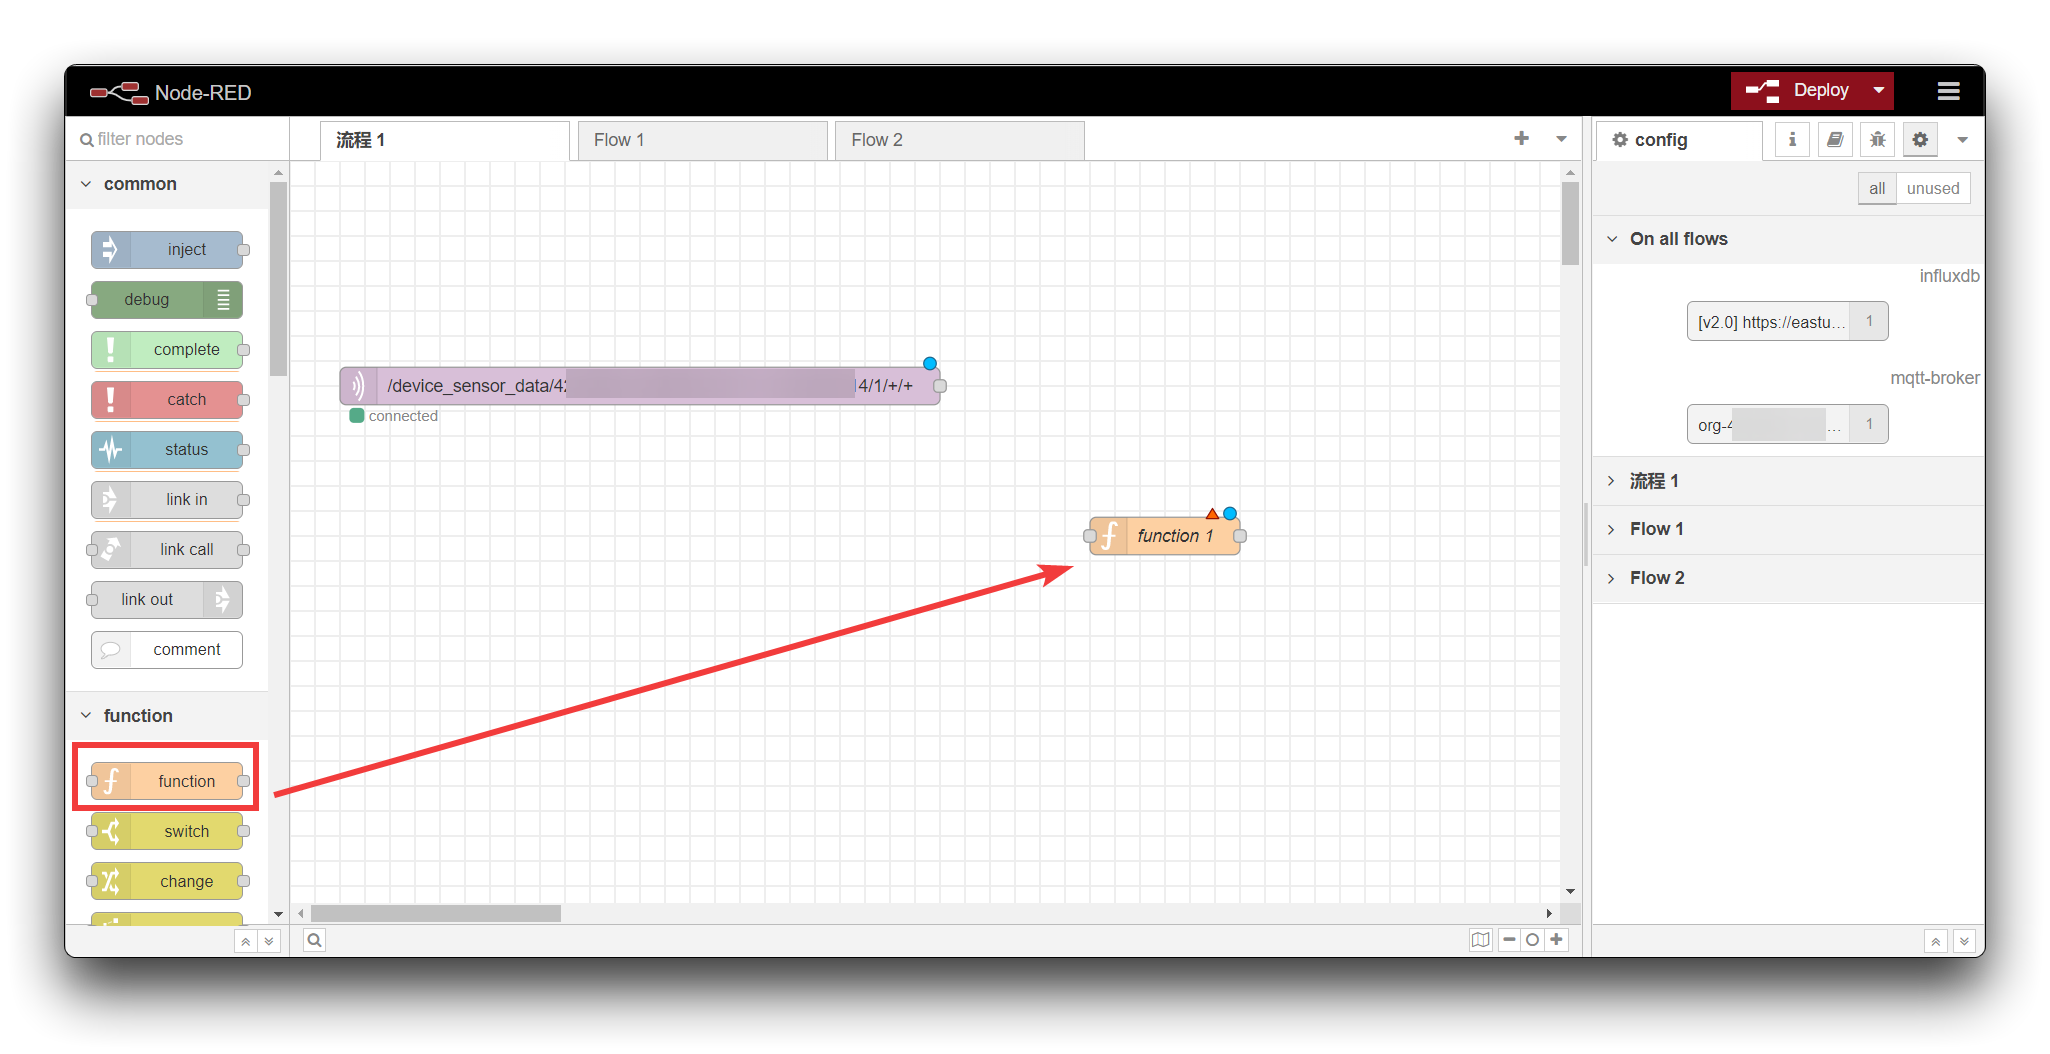
Drag out the function node from the function bar on the left, double-click it to enter the edit page, then copy the code to On Message.
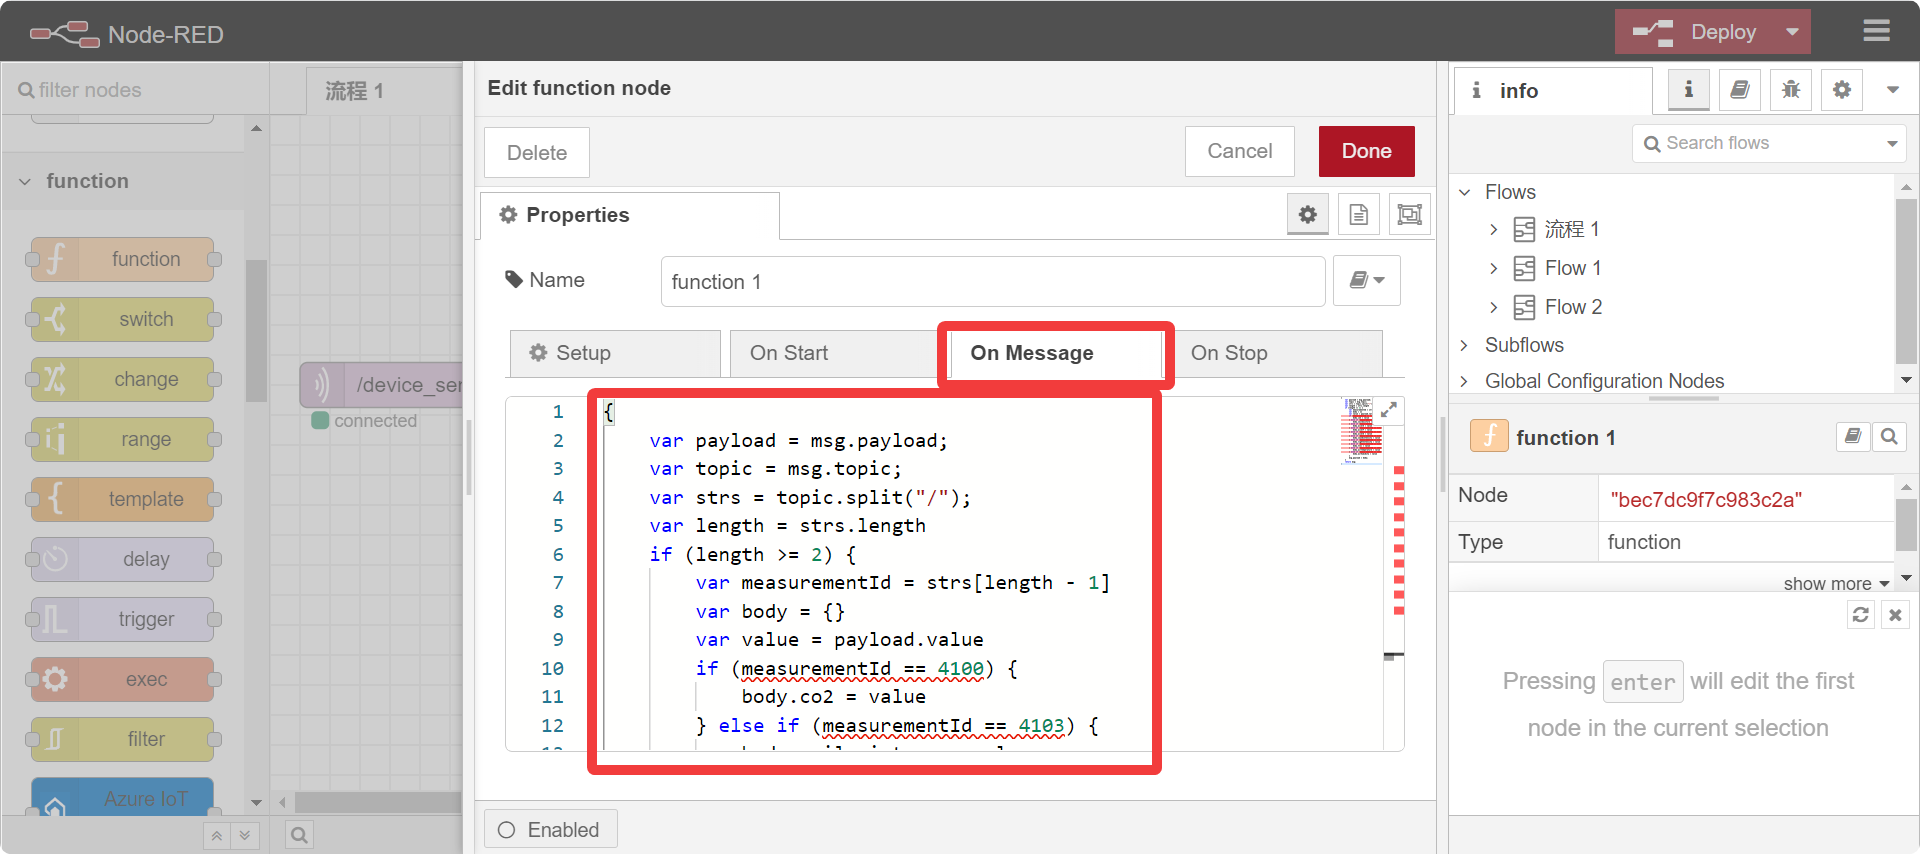
var payload = msg.payload;
var topic = msg.topic;
var strs = topic.split("/");
var length = strs.length
if (length >= 2) {
    var measurementId = strs[length - 1]
    var body = {}
    var value = payload.value
    if (measurementId == 4100) {
        body.co2 = value
        measurement = "co2"
    } else if (measurementId == 4103) {
        body.soilmoisture = value
        measurement = "soilmoisture"
    } else if (measurementId == 4150) {
        body.accelX = value
        measurement = "accelX"
    } else if (measurementId == 4151) {
        body.accelY = value
        measurement = "accelY"
    } else if (measurementId == 4152) {
        body.accelZ = value
        measurement = "accelZ"
    } else if (measurementId == 4192) {
        body.soundintensity = value
        measurement = "soundintensity"
    } else if (measurementId == 4193) {
        body.lightIntensity = value
        measurement = "lightIntensity"
    } else if (measurementId == 4195) {
        body.tvoc = value
        measurement = "tvoc"
    } else if (measurementId == 4097) {
        body.airtemperature = value
        measurement = "airtemperature"
    } else if (measurementId == 4098) {
        body.airhumidity = value
        measurement = "airhumidity"
    } else if (measurementId == 4175) {
        body.AIdetection_1 = value
        measurement = "AIdetection_1"
    } else if (measurementId == 4176) {
        body.AIdetection_2 = value
        measurement = "AIdetection_2"
    } else if (measurementId == 4177) {
        body.AIdetection_3 = value
        measurement = "AIdetection_3"
    } else if (measurementId == 4178) {
        body.AIdetection_4 = value
        measurement = "AIdetection_4"
    } else if (measurementId == 4179) {
        body.AIdetection_5 = value
        measurement = "AIdetection_5"
    } else if (measurementId == 4180) {
        body.AIdetection_6 = value
        measurement = "AIdetection_6"
    } else if (measurementId == 4181) {
        body.AIdetection_7 = value
        measurement = "AIdetection_7"
    } else if (measurementId == 4182) {
        body.AIdetection_8 = value
        measurement = "AIdetection_8"
    } else if (measurementId == 4183) {
        body.AIdetection_9 = value
        measurement = "AIdetection_9"
    } else if (measurementId == 4184) {
        body.AIdetection_10 = value
        measurement = "AIdetection_10"
    }
    msg.payload = [{
        measurement: measurement,
        fields: body,
        tags: {
            device: "SenseCAP K1100"
        },
        timestamp: new Date()
    }];
}
return msg;
Then we connect all the nodes and click on the Deploy button and if everything is set up correctly you will be able to see the mqtt in node showing connected.
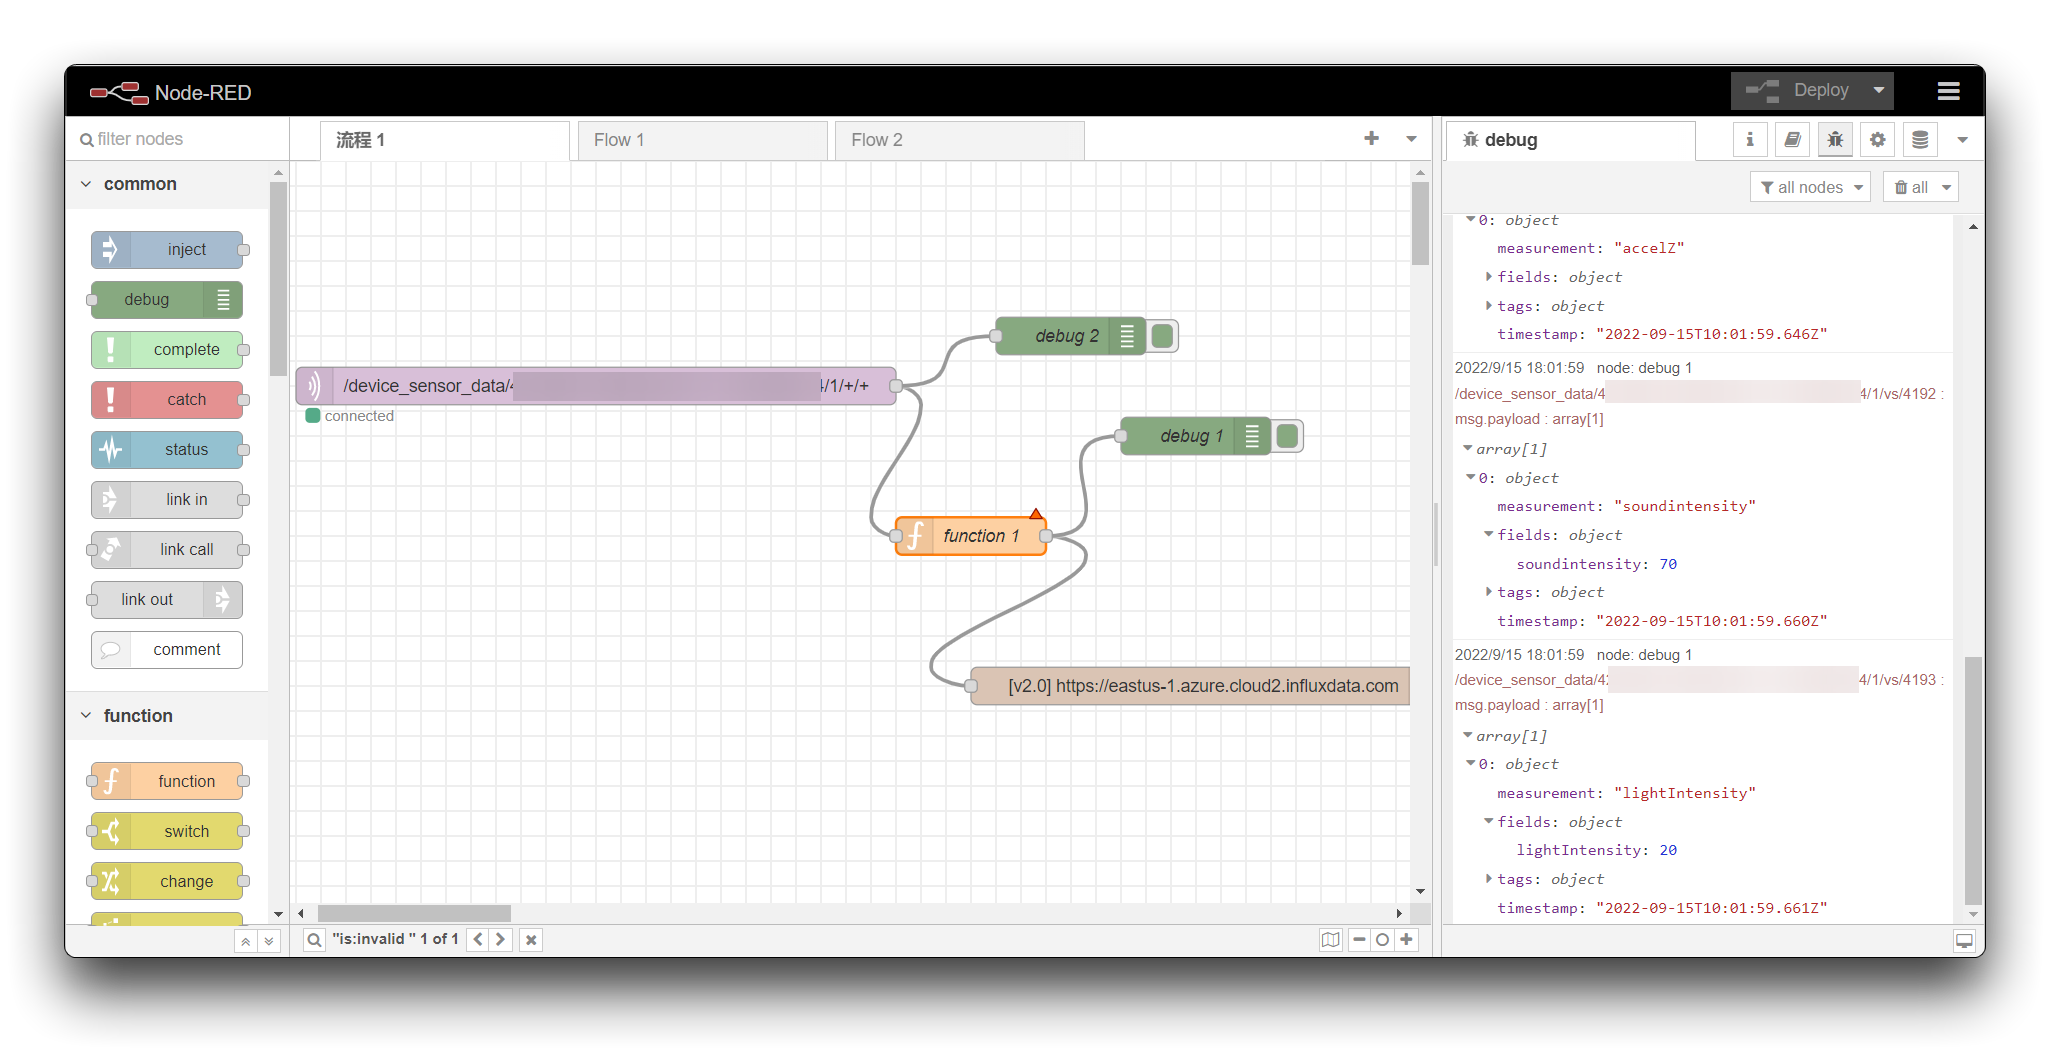
If you want to see the logging information of the data, you can add a debug node after the function node.
Once the Wio Terminal starts powering up and working and starts sending data to SenseCAP PaaS server, then we can check the data on Node-RED debug log.
Configure Grafana
Step 1. Install Grafana
Grafana can be installed on many different operating systems. For a list of the minimum hardware and software requirements, as well as instructions on installing Grafana, refer to Install Grafana.
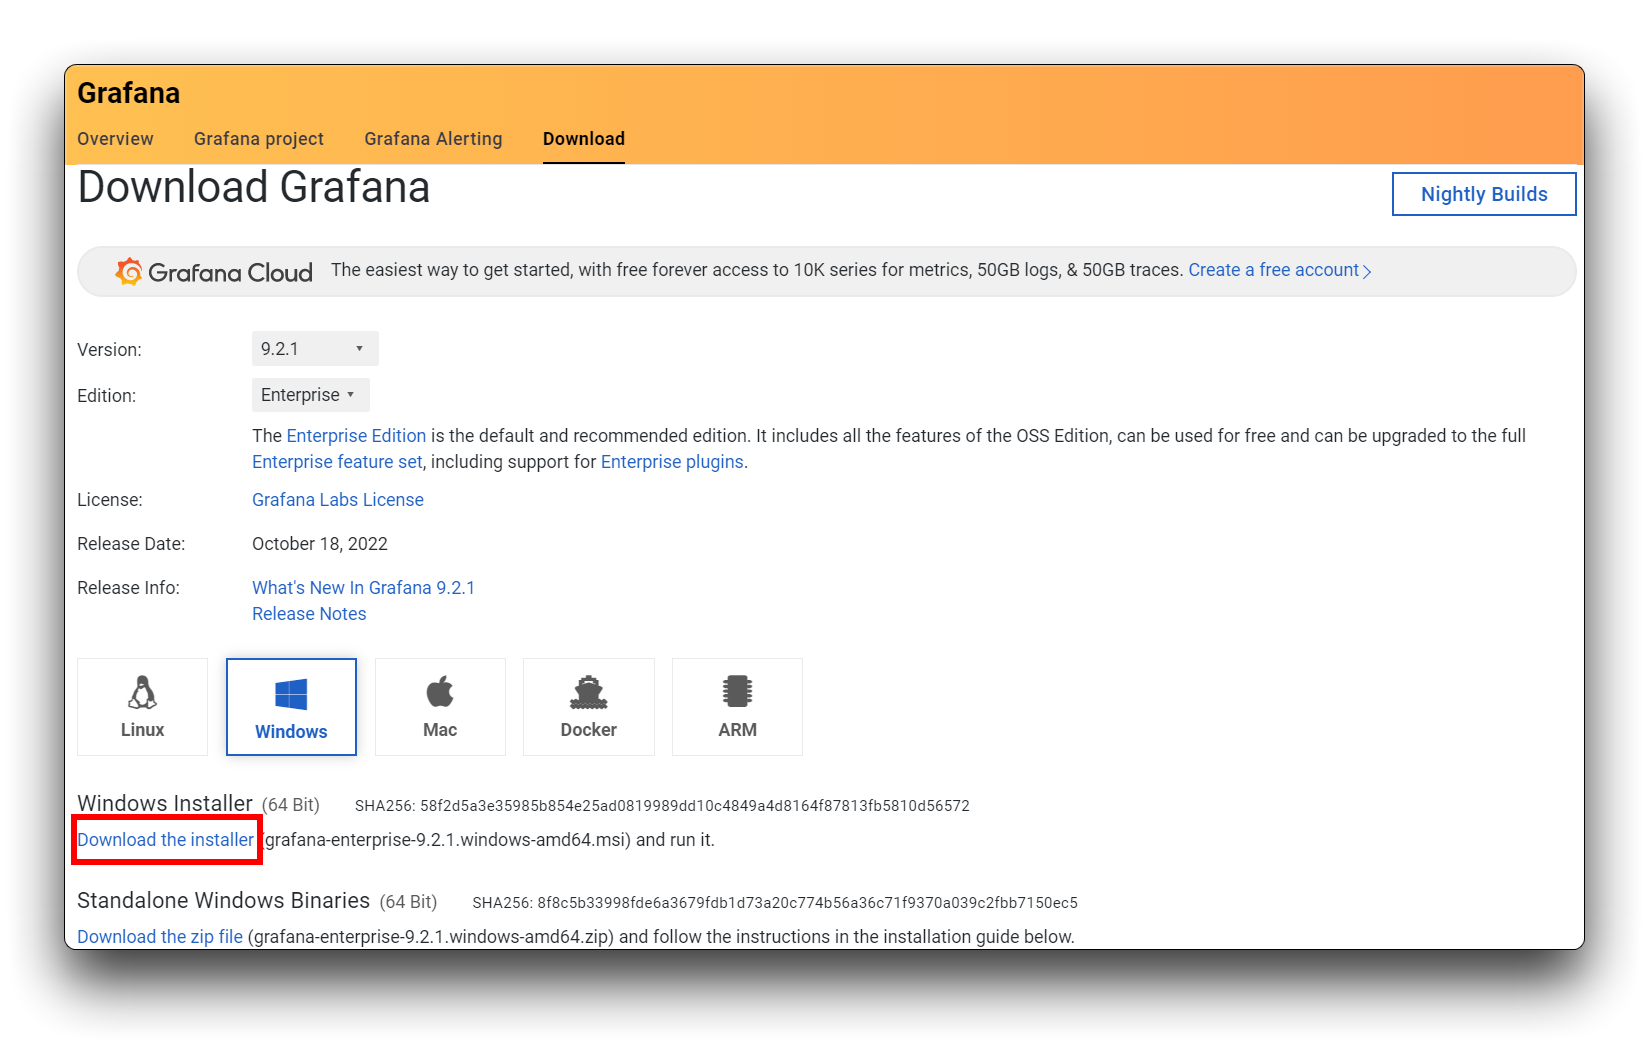
Take Windows 11 as an example, download the installation package from the Grafana website and double click to open it for installation.
Step 2. Sign in to Grafana
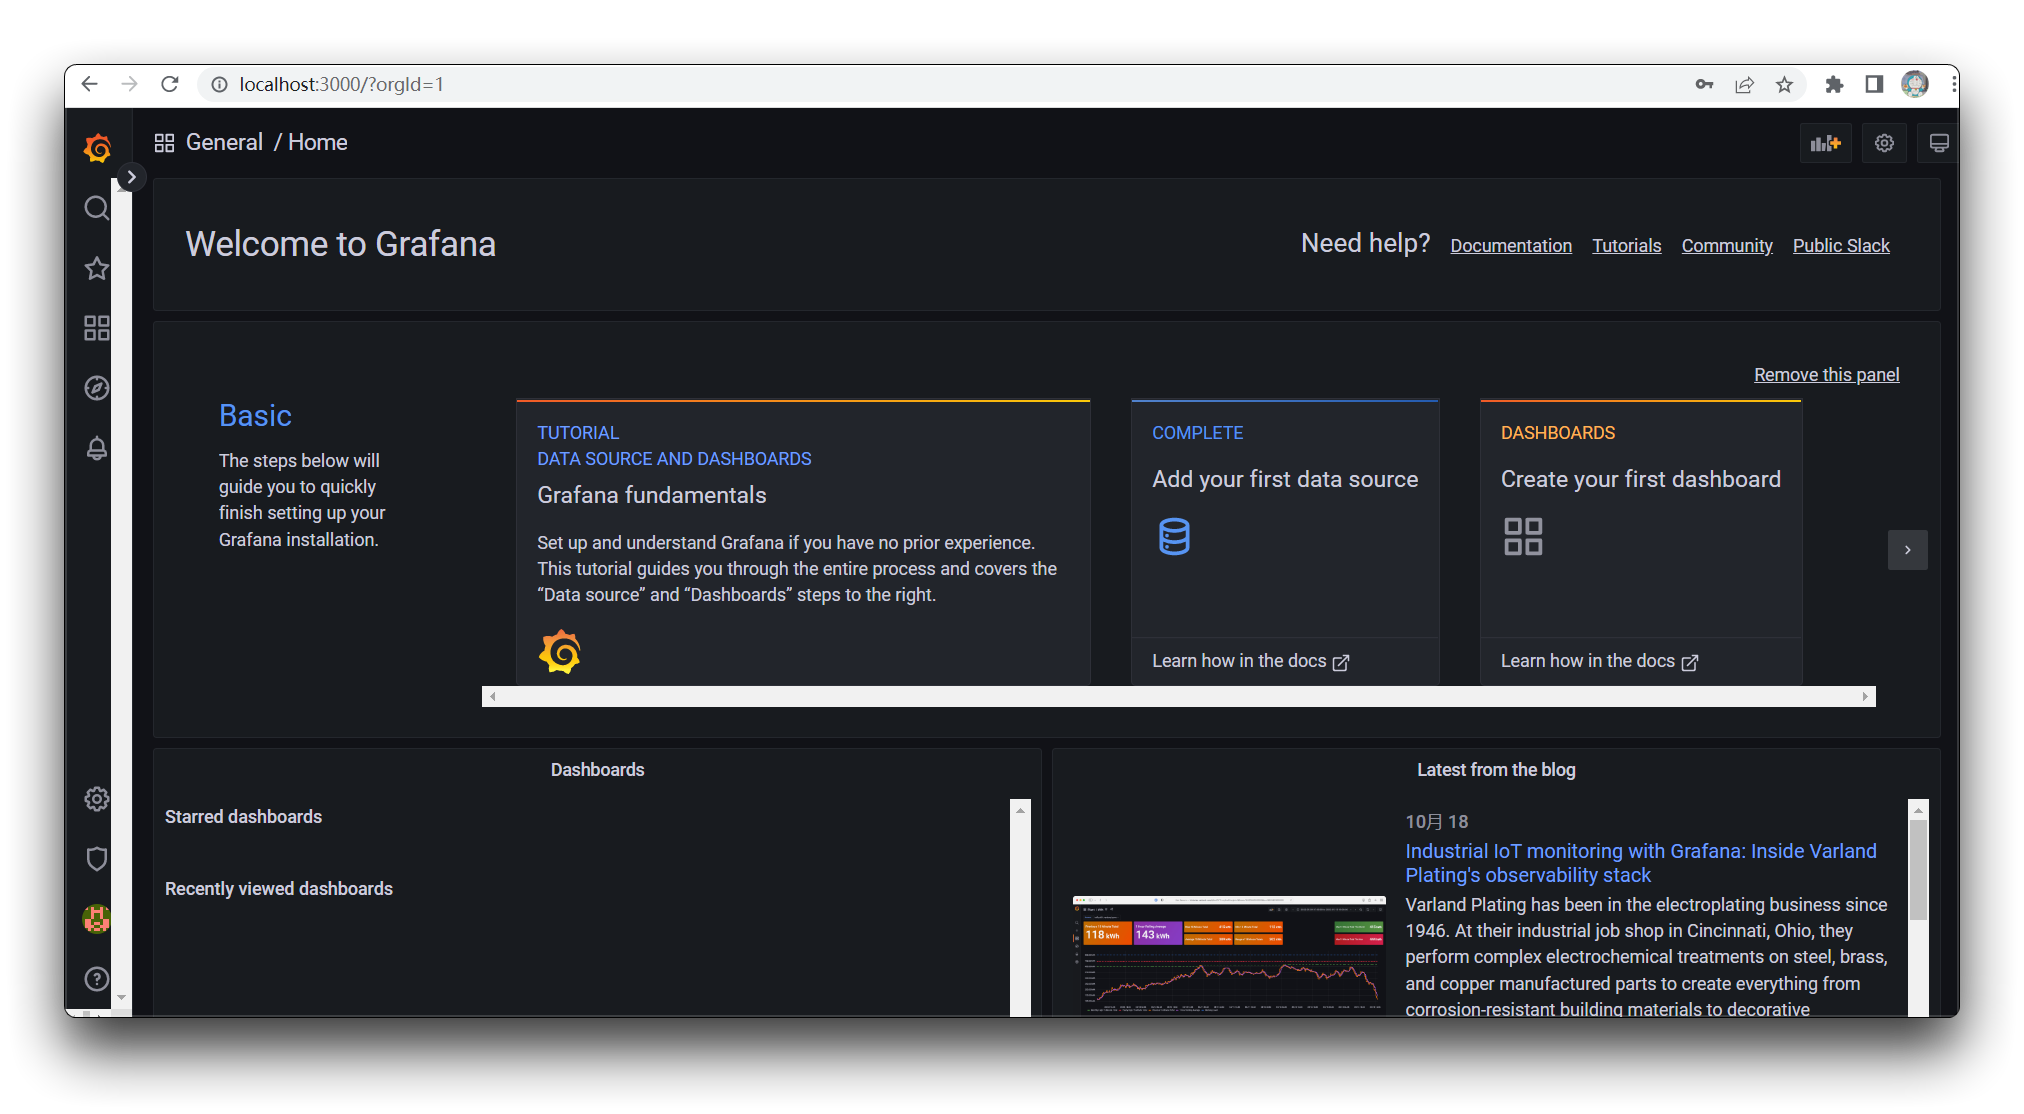
Open your web browser and go to http://localhost:3000/. The default HTTP port that Grafana listens to is 3000 unless you have configured a different port.
On the sign-in page, enter admin for the username and password.
Click Sign in. If successful, you will see a prompt to change the password.
Step 3. Add Data Source
On the main page, we click on the gear icon at the bottom left and then click on Add data source.
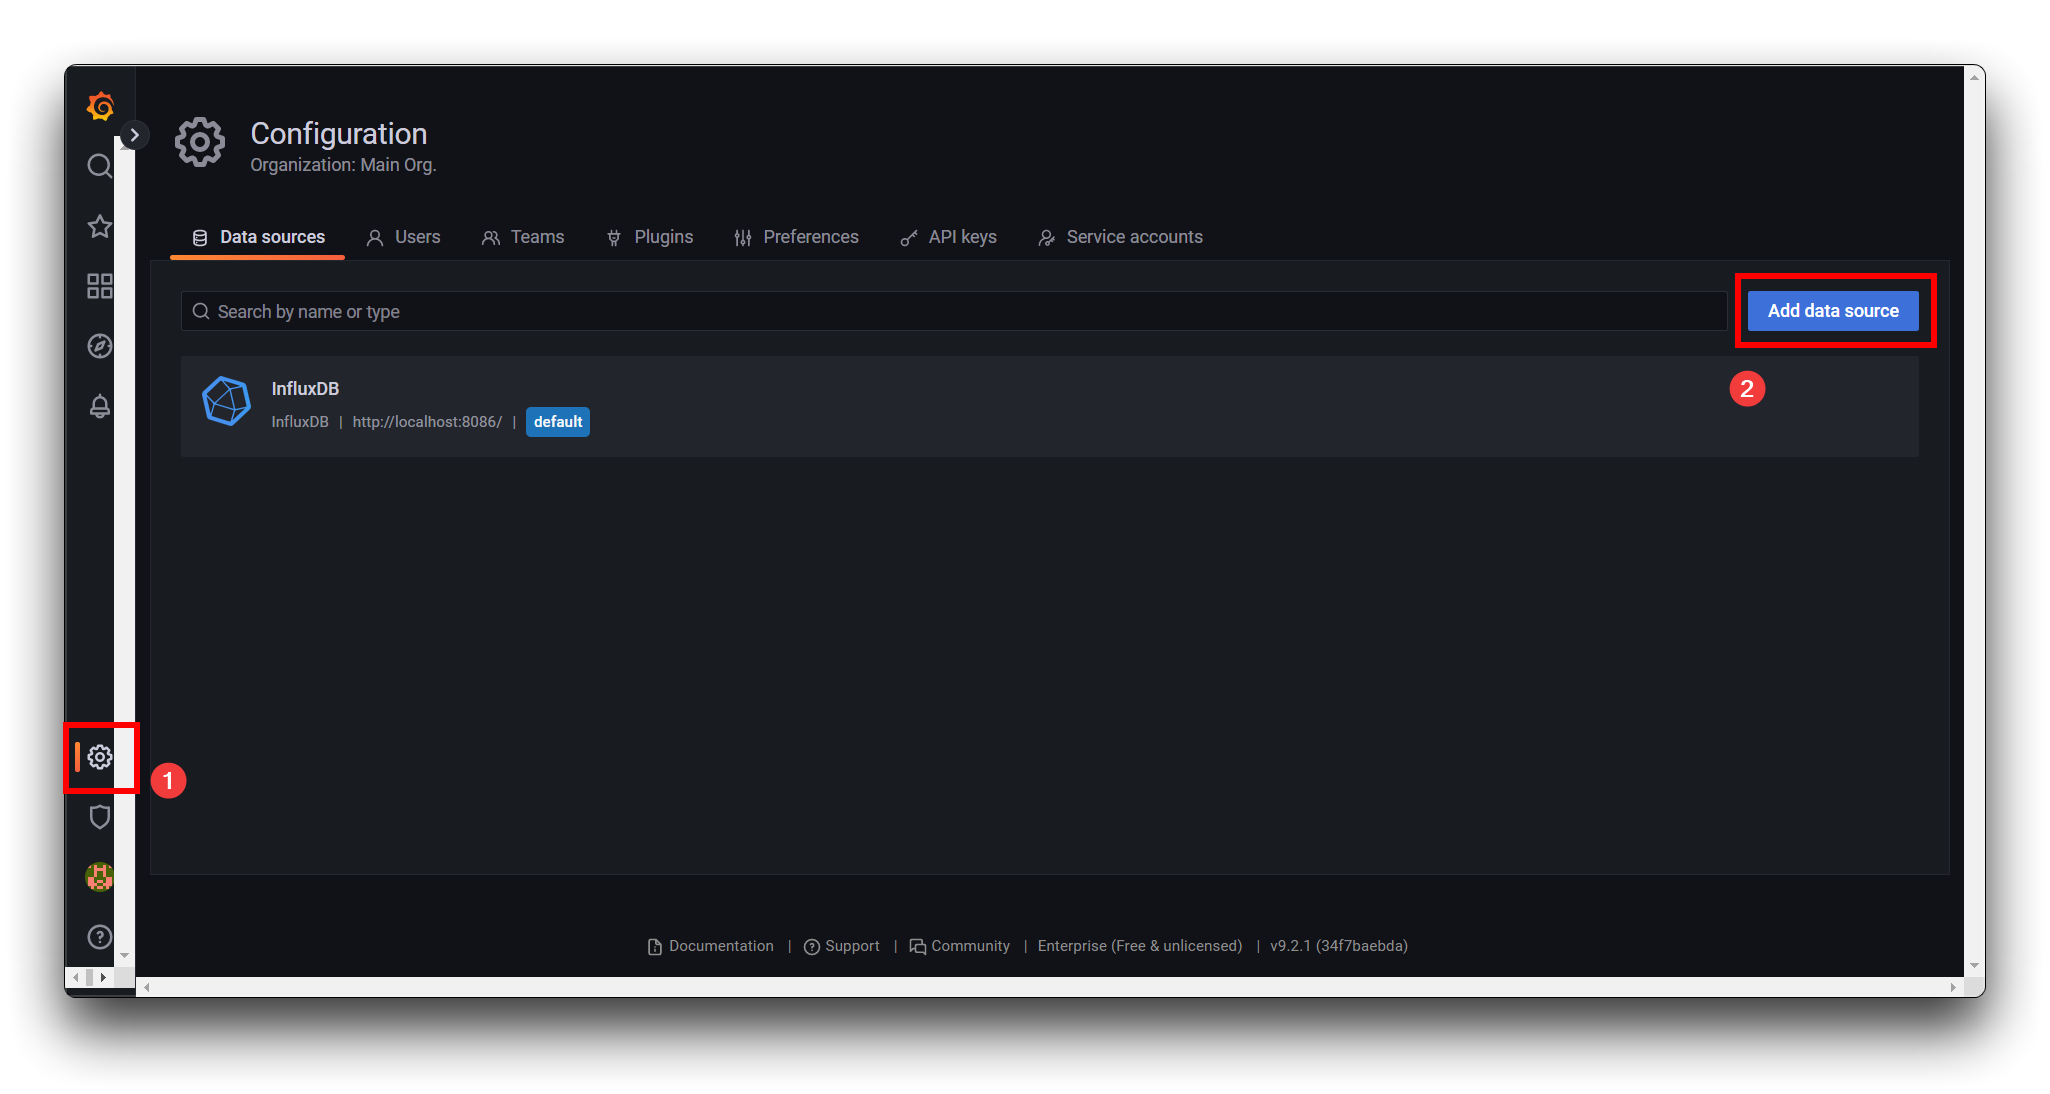
Select InfluxDB from the list of available data sources.
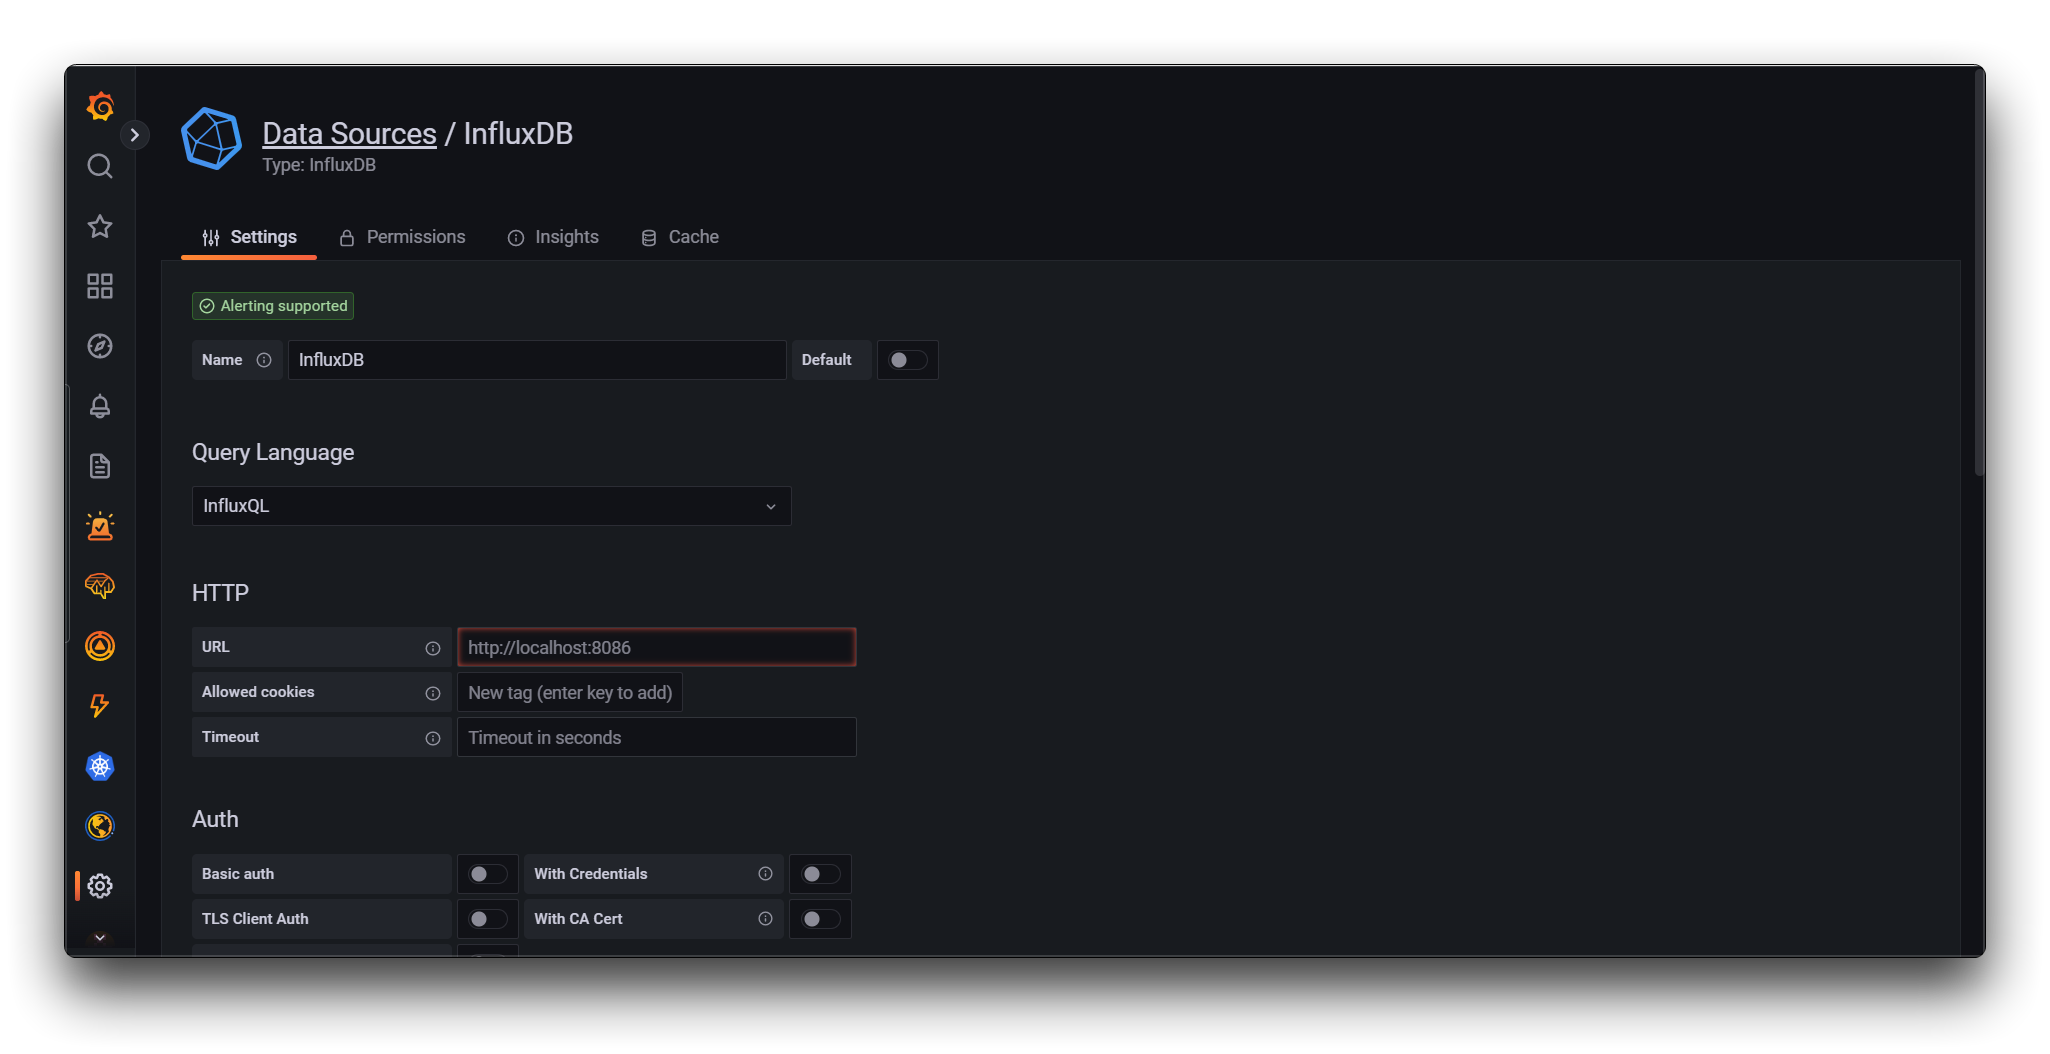
Step 3. Configure InfluxDB Data Source
On the Data Source configuration page, enter a name for your InfluxDB data source.
Then, choose or enter the following:
- Query Language: Flux
- Under HTTP, do the following:
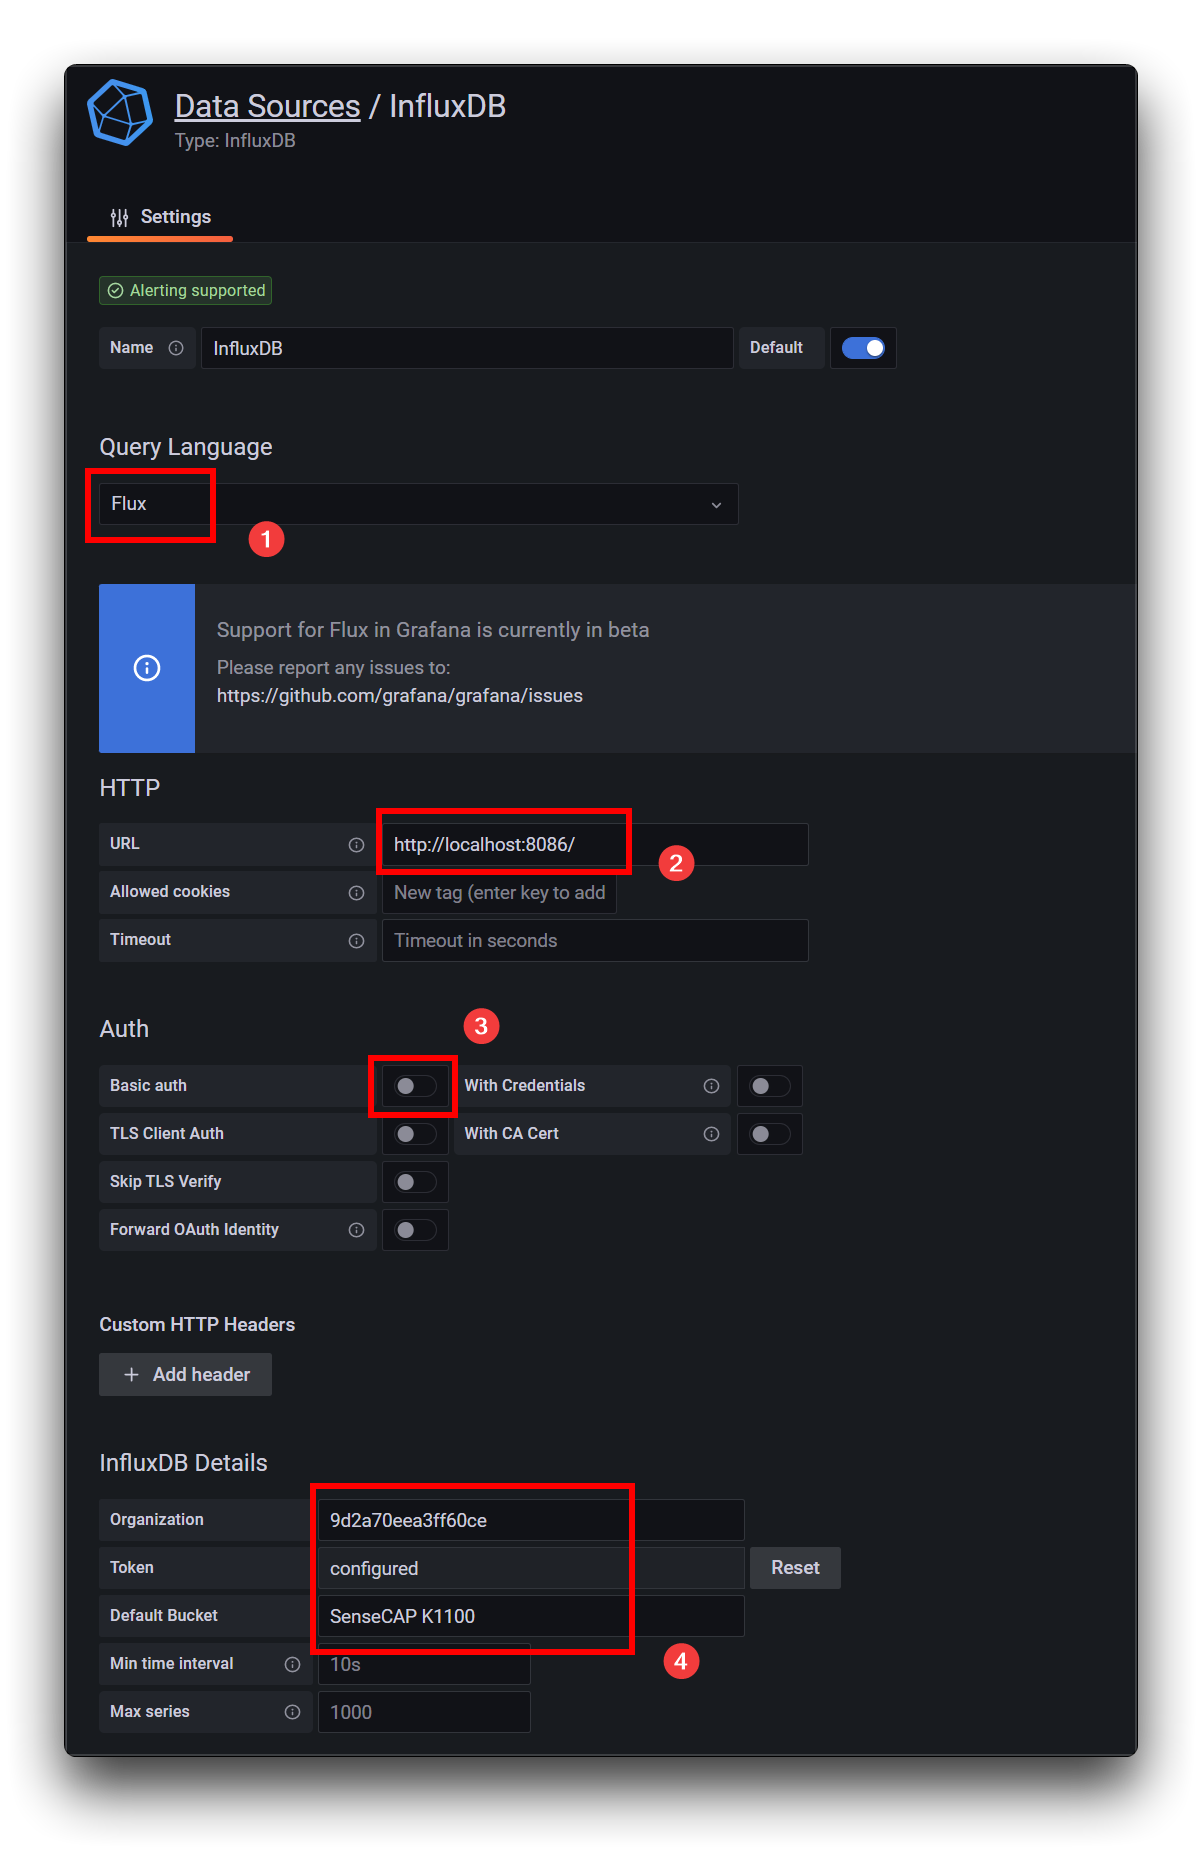
- Under Auth, do the following:
- Close Basic auth.
- Under InfluxDB Details, do the following:
- Organization: organization ID. The organisation ID can be viewed on the About page of InfuxDB.
- Token: Your InfluxDB API token.
- Default Bucket: The default bucket to use in Flux queries.
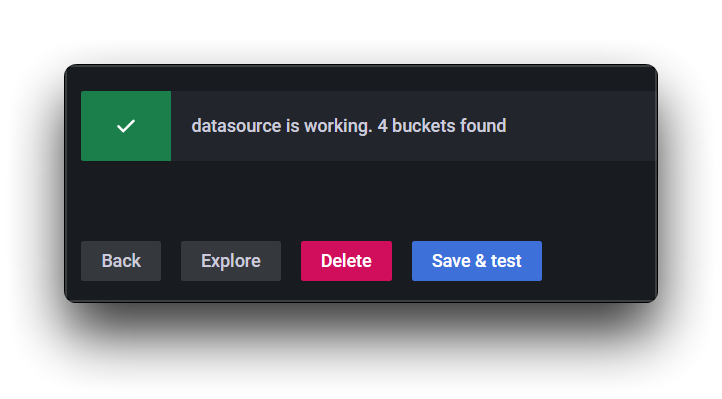
Click Save & Test. Grafana attempts to connect to the InfluxDB 2.4 data source and returns the results of the test. If all goes well, you will see the following output message.
Query and visualize data
With your InfluxDB connection configured, use Grafana and Flux to query and visualize time series data stored in your InfluxDB instance.
For more information about using Grafana, see the Grafana documentation. If you're just learning Flux, see Get started with Flux.
We also welcome you to submit your data dashboards to us, and we look forward to your work!
Tech Support & Product Discussion
Thank you for choosing our products! We are here to provide you with different support to ensure that your experience with our products is as smooth as possible. We offer several communication channels to cater to different preferences and needs.