Wio Terminal Edge Impulse Getting Started

Edge Impulse enables developers to create the next generation of intelligent device solutions with embedded Machine Learning. Machine Learning at the very edge will enable valuable use of the 99% of sensor data that is discarded today due to cost, bandwidth or power constraints.
Now, Wio Terminal is officially supported by the Edge Impulse. Let's see how to get Wio Terminal started with the Machine learning at the very edge!
Installing dependencies
To set Wio Terminal up in Edge Impulse, you will need to install the following software:
- Node.js v12 or higher.
- Arduino CLI
- The Edge Impulse CLI and a serial monitor. Install by opening command prompt or terminal and run:
npm install -g edge-impulse-cli
Problems with installing the CLI? Please check Installation and troubleshooting for more reference.
Connecting to Edge Impulse
With all the software in place it's time to connect the development board to Edge Impulse.
1. Connect the development board to your computer
Connect Wio Terminal to your computer. Entering the bootloader mode by sliding the power switch twice quickly. For more reference, please also see here.
An external drive named Arduino should appear in your PC. Drag the the downloaded Edge Impulse uf2 firmware files to the Arduino drive. Now, Edge Impulse is loaded on Seeeduino Wio Terminal!
NOTE: Here is the Wio Terminal Edge Impulse source code, you can also build the firmware from here.
2. Setting Keys
From a command prompt or terminal run:
edge-impulse-daemon
NOTE: When connecting to a new device, run edge-impulse-daemon --clean to remove previous cached.
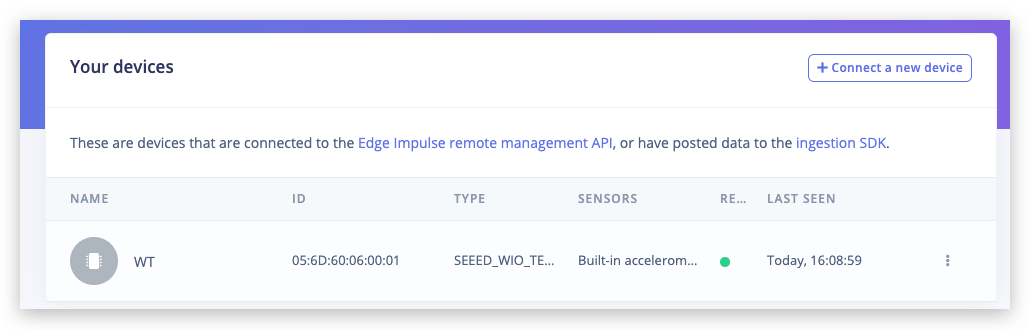
3. Verifying that the device is connected
That's all! Your device is now connected to Edge Impulse. To verify this, go to your Edge Impulse project, and click Devices. The device will be listed here.
For your first project, let’s quickly train and deploy a simple neural network for classifying rock-paper-scissors gestures with just a single light sensor. For more details and video tutorial, watch the corresponding video!
Training data acquisition
Go to Data acquisition tab. Set sample length to about 10000 ms or 10 seconds and create 10 samples for each gesture, waving the hand in vicinity of Wio terminal.
This is a small dataset, but we also have a tiny neural network, so underfitting is more likely than overfitting in this particular case.
Underfitting: A statistical model or a machine learning algorithm is said to have underfitting when it cannot capture the underlying trend of the data, that happens (among other cases) when model size is too small to develop a general rule for data that has large variety and amount of noise.
Overfitting: A statistical model is said to be overfitted, when it starts learning from the noise and inaccurate data entries in our data set. That happens when you have large model and relatively small dataset - the model can just learn "by heart" all the data points without generalizing.
When collecting samples it is important to provide diversity for model to be able to generalize better, for example have samples with different direction, speed and distance from sensor. In general, the network only can learn from data present in the dataset – so if the only samples you have are gestures being moved from left to right above the sensor, you shouldn’t expect trained model to be able to recognize gestures being moved right to left or up and down.
Building a machine learning model
After you collected the samples it is time to design an “impulse”. Impulse here is the word Edge Impulse used to denote data processing – training pipeline. Press on Create Impulse and set Window length to 1000 ms. and Window length increase to 50 ms.
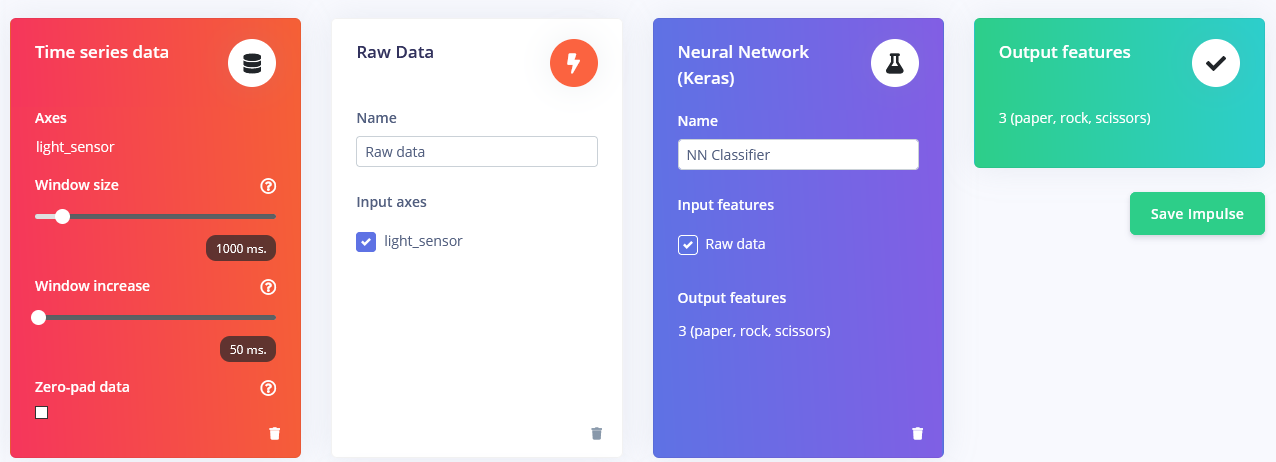
These settings mean that each time an inference is performed we're going to take sensor measurements for 1000 ms. - how many measurements your device is going to take depends on the frequency. During data collection you set sampling frequency to 40 Hz, or 40 times per 1 second. So, to sum it up, your device is going to gather 40 data samples within 1000 ms. time window and then take these values, preprocess them and feed them to neural network to get inference result. Of course we use the same window size during the training. For this proof-of-concept project, we are going to try three different prepossessing blocks with default parameters(except for adding scaling) – Flatten block, which takes computes Average, Min, Max and other functions of raw data within time window.
Spectral Features block, which extracts the frequency and power characteristics of a signal over time.
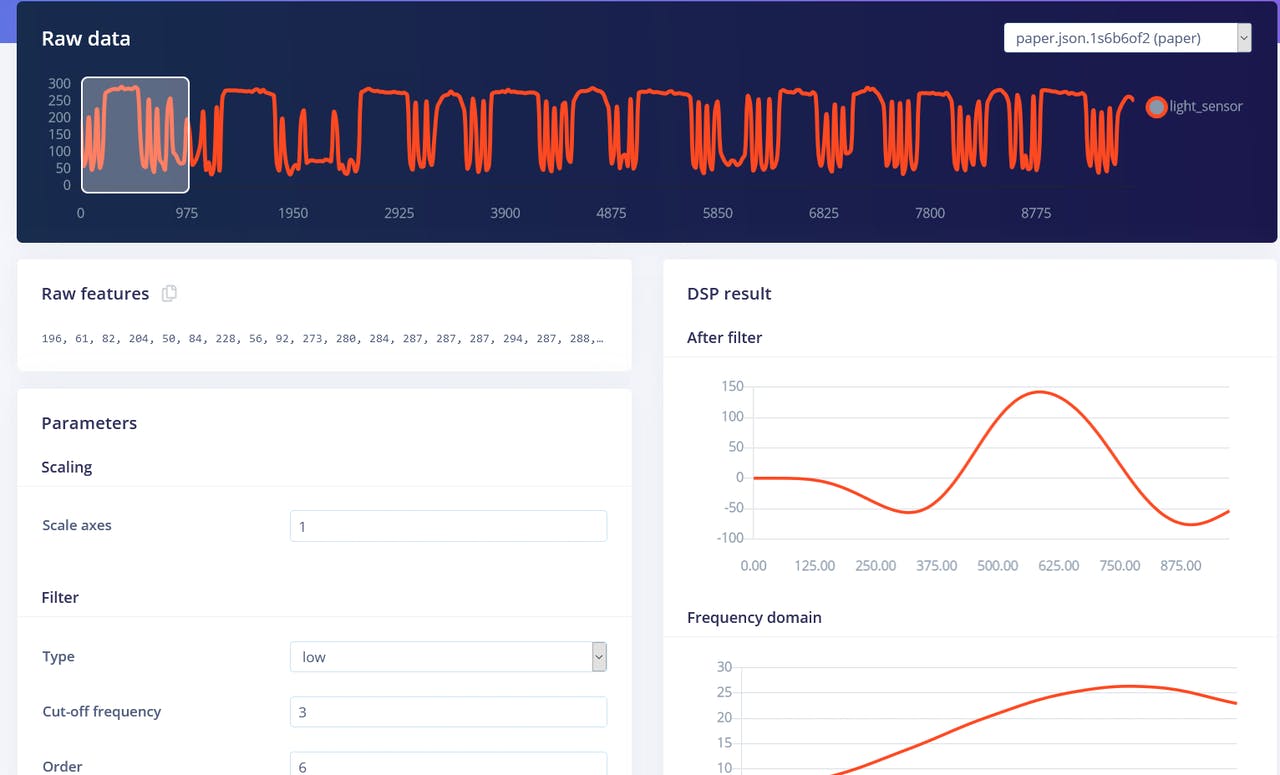
and Raw data block, which as you might have guessed just feeds raw data to NN learning block (optionally normalizing the data).
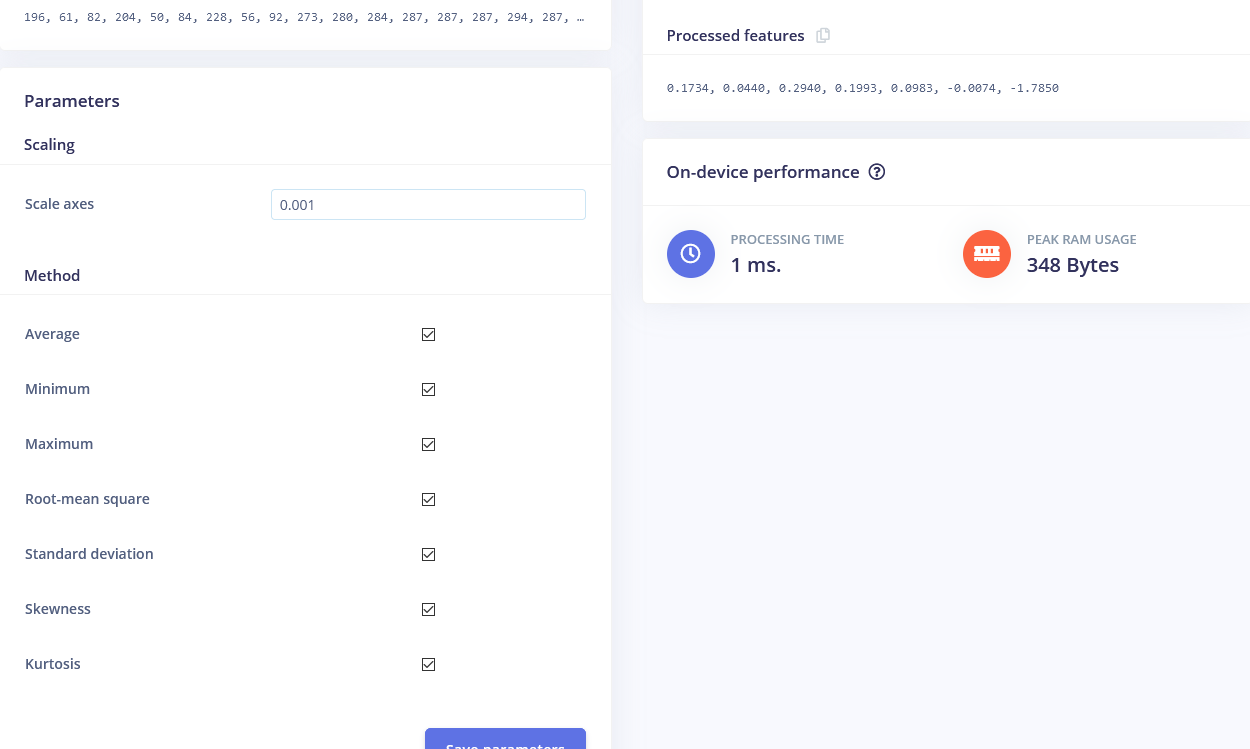
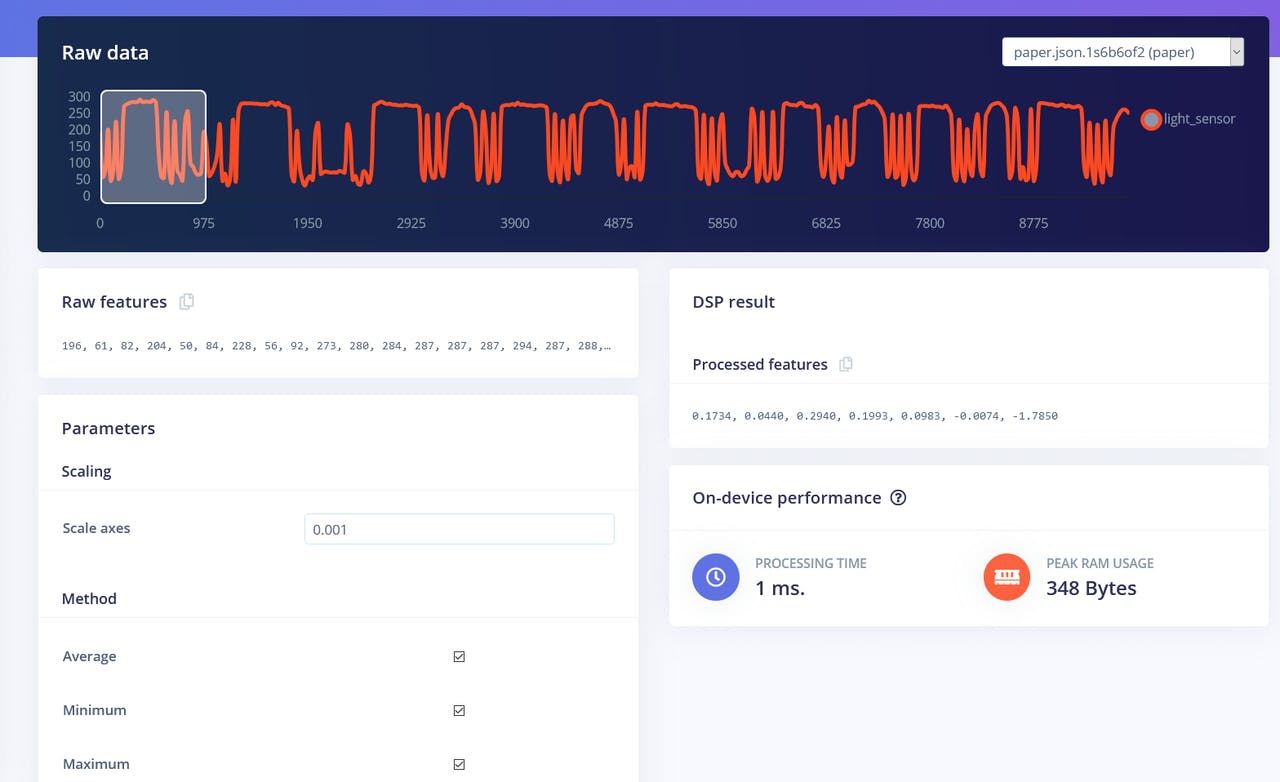
We'll start with Flatten block. Add this block and then add Neural Network (Keras) as learning block, check Flatten as input features and click on Save Impulse. Go to the next tab, which has a name of the processing block you have chosen - Flatten. There enter 0.001 in scaling and leave other parameters the same. Press on Save parameters and then Generate features.
Feature visualization is particularity useful tool in Edge Impulse web interface, as it allows users to get graphical insights into how the data looks after prepossessing. For example this is data after Flatten processing block:
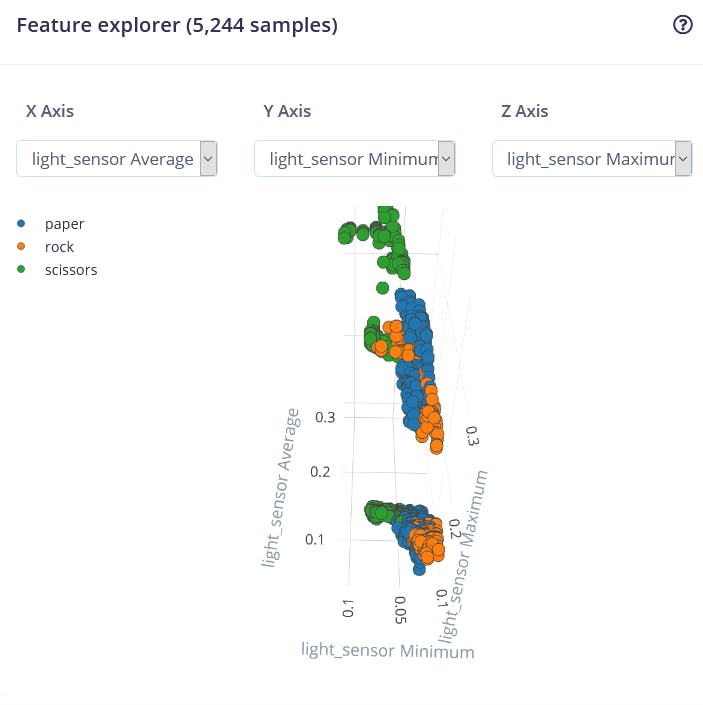
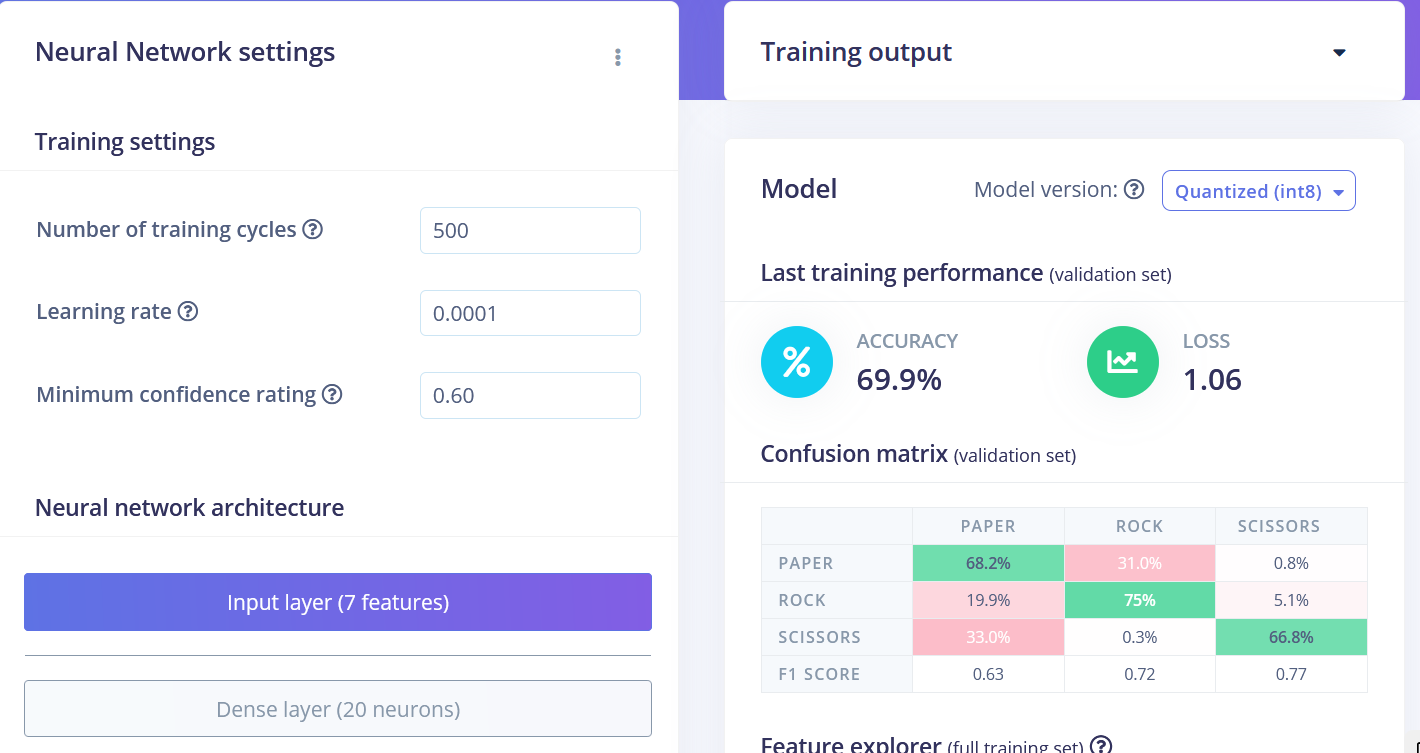
We can see that the data points for different classes are roughly divided, but there is a lot of overlap between rock and other classes, which will cause issues and low accuracy for these two classes. After you generated and inspected the features, go to NN CLassifier tab. Train a simple fully-connected network with 2 hidden layers, 20 and 10 neurons in each hidden layer for 500 epochs with 1e-4 learning rate. After the training is done you're going to see test results in confusion matrix, similar to this:
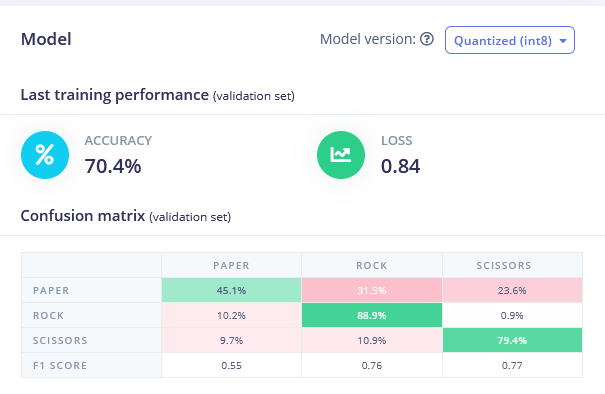
Go back to Create Impulse tab, delete Flatten block and choose Spectral Features block, generate the features (remember to set scaling to 0.001!) and train Neural network on Spectral features data. You should see slight improvement.
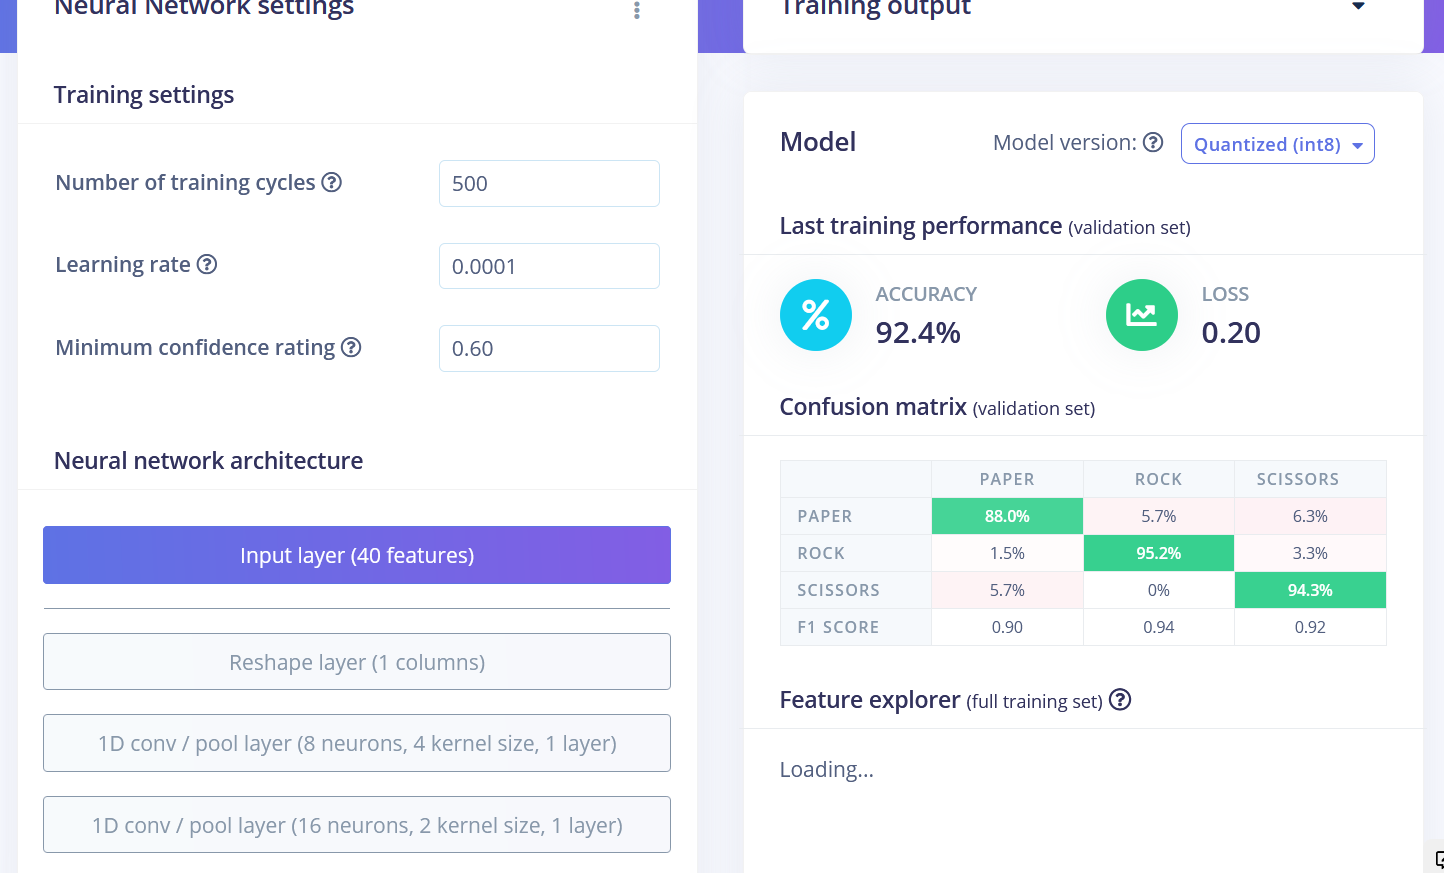
Both Flatten and Spectral Features blocks are actually not the best processing methods for rock-paper-scissors gesture recognition task. If we think about it, for classifying rock-paper-scissors gestures we just need to count how many times and for how long the light sensor has received “lower-than-normal” values. If it is one relatively long time – then it is rock (fist passing above the sensors). If it is two times, then it is scissors. Anything more than that is paper. Sounds easy, but preserving time series data is really important for neural network to be able to learn this relationship in data points. Both Flatten and Spectral Features processing blocks remove the time relationship within each window – Flatten block simply turns the raw values, that are initially in sequence to Average, Min, Max, etc. values calculated on all values in time window, irrespective of their order. Spectral Features block extracts the frequency and power characteristics and the reason it didn’t work that well for this particular task is probably, that the duration of each gesture is too short. So, the way to achieve best performance is to use Raw data block, which will preserve the time series data. Have a look at sample project where we used Raw data and Convolutional 1D network, a more specialized type of network, compared to fully-connected. We were able to achieve 92.4% accuracy on the same data!
The final results after training were
• Flatten FC 69.9 % accuracy
• Spectral Features FC 70.4 % accuracy
• Raw Data Conv1D 92.4 % accuracy
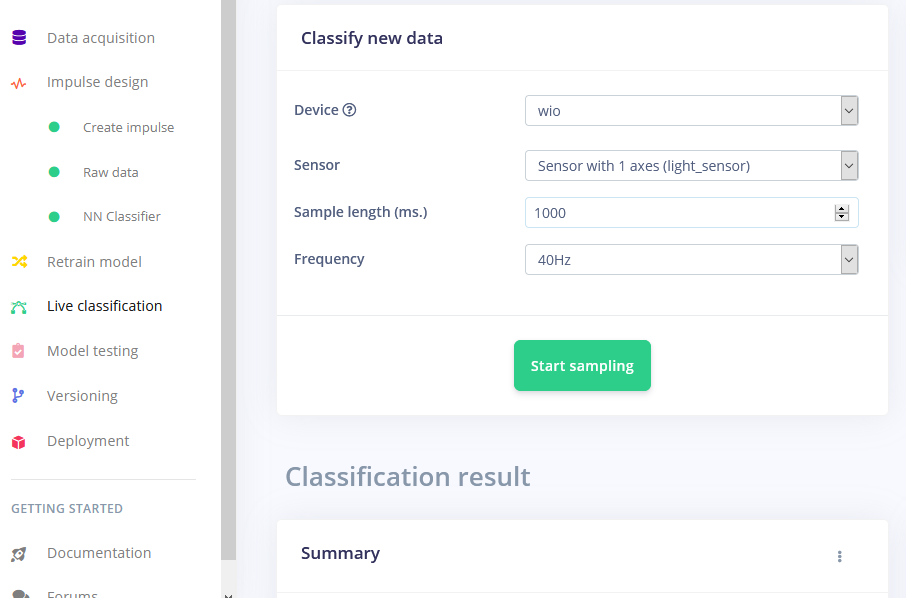
After the training you can test the model using Live classification tab, which will gather a data sample from device and classify it with model hosted on Edge Impulse. We test with three different gestures and see the accuracy is satisfactory as far as proof of concept goes.
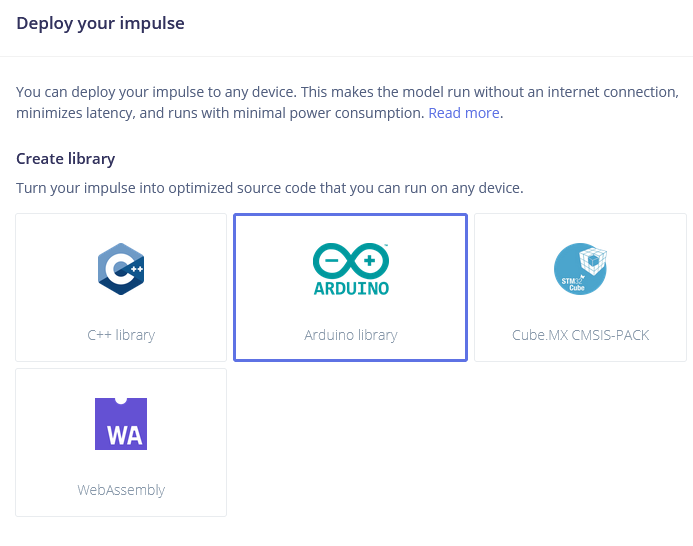
Deploying to Wio Terminal
The next step is deployment on device. After clicking on Deployment tab, choose Arduino library and download it.
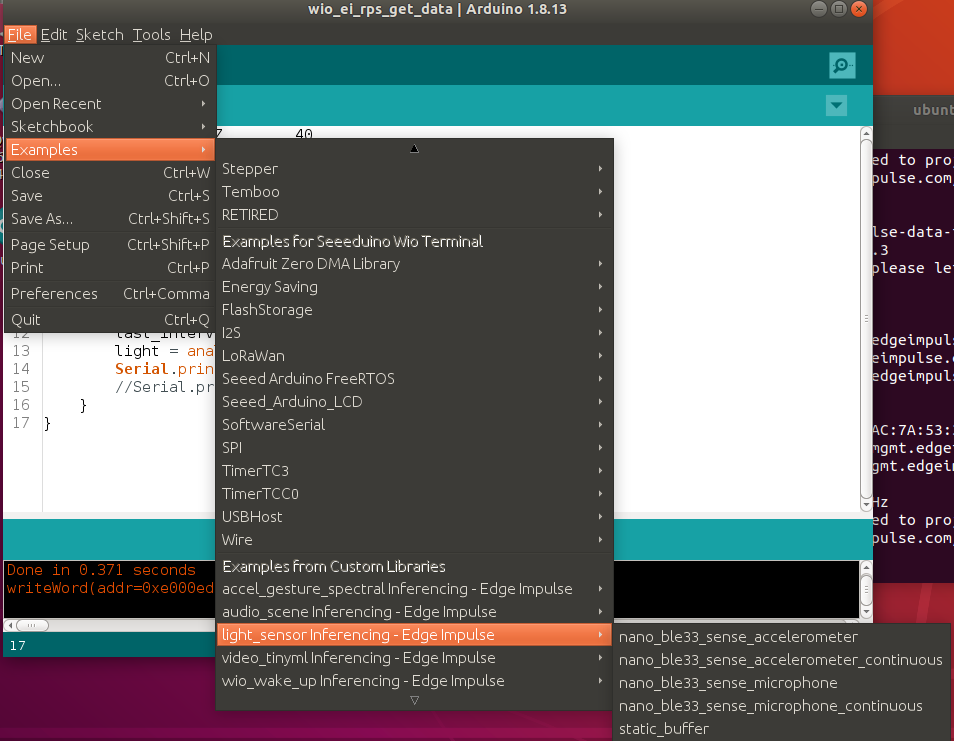
Extract the archive and place it in your Arduino libraries folder. Open Arduino IDE and choose static buffer sketch (located in File -> Examples -> name of your project -> static_buffer) , which already has all the boilerplate code for classification with your model in place. Neat!
The only thing for use to fill in is the data acquisition on-device. We’ll use a simple for loop with delay to account for frequency (if you remember we had 25 ms delay when gathering data for training dataset).
int raw_feature_get_data(size_t offset, size_t length, float *out_ptr) {
float features[40];
for (byte i = 0; i < 40; i = i + 1)
    {
    features[i]=analogRead(WIO_LIGHT);
    delay(25);
    }
    memcpy(out_ptr, features + offset, length * sizeof(float));
    return 0;
}
Certainly there are better ways to implement this, for example a sensor data buffer, which would allow us to perform inference more often. But we’ll get to that in later articles of this series.
While it was just a proof of concept demonstration, it really shows TinyML is up to something big. You probably knew it is possible to recognize gestures with a camera sensor, even if image is down-scaled a lot. But recognizing gestures with just 1 pixel is entirely different level!