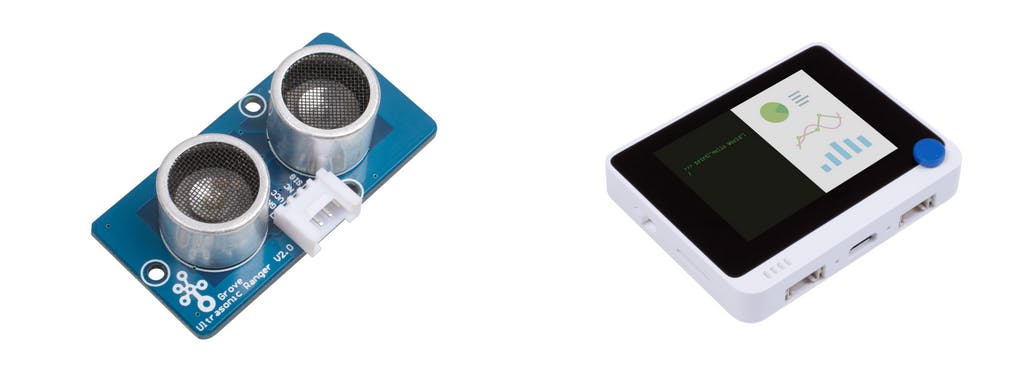
Wio Terminal Edge Impulse People counting with Ultrasonic sensor
In this project we will create a people counting system by using Wio Terminal, an ordinary Ultrasonic ranger and special Deep Learning sauce to top it off and actually make it work.
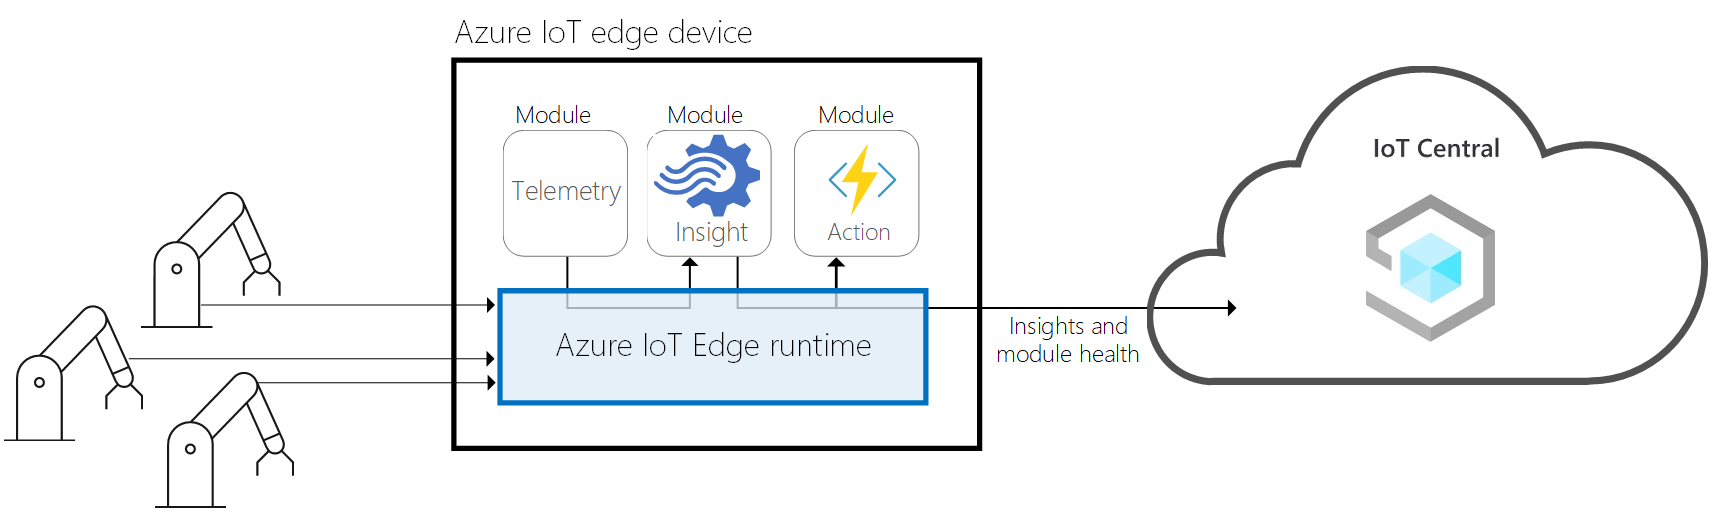
We will also utilize Microsoft Azure IoT Central service to store the room occupancy data in the cloud and visualize it on PC.
For more details and video tutorial, watch the corresponding video!
Understanding the data
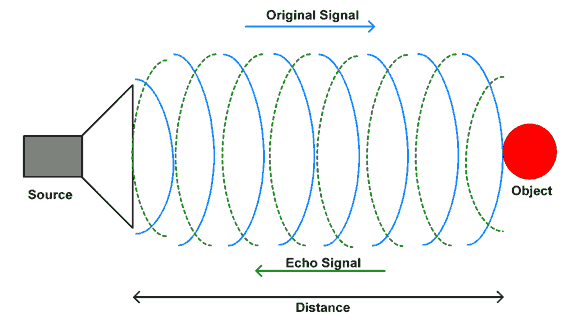
First, let’s understand the data we can get from Ultrasonic sensor and how we can utilize it for determining the direction of objects.
Grove - Ultrasonic ranger is a non-contact distance measurement module which works at 40KHz. When we provide a pulse trigger signal with more than 10uS through signal pin, the Grove_Ultrasonic_Ranger will issue 8 cycles of 40kHz cycle level and detect the echo. The pulse width of the echo signal is proportional to the measured distance. Here is the formula: Distance = echo signal high time * Sound speed (340M/S)/2.
Do not hot plug Grove-Ultrasonic-Ranger, otherwise it will damage the sensor. The measured area must be no less than 0.5 square meters and smooth.
After installing Grove - Ultrasonic Ranger library for Arduino IDE and connecting Ultrasonic Ranger to Wio Terminal D1/D2 port, we can upload this simple script to Wio Terminal connected to Grove Ultrasonic Ranger and then walk in and walk out of the room.
#include "Ultrasonic.h"
#define INTERVAL_MS 50
Ultrasonic ultrasonic(0);
void setup() {
    Serial.begin(115200);
    }
void loop() {
    static unsigned long last_interval_ms = 0;
    float distance;
    if (millis() > last_interval_ms + INTERVAL_MS) {
        last_interval_ms = millis();
        distance = ultrasonic.MeasureInCentimeters();
        if (distance < 200.0) {
        Serial.println(distance);
        }
        else
        Serial.println(-1);
        //Serial.print('\t');
    }
}
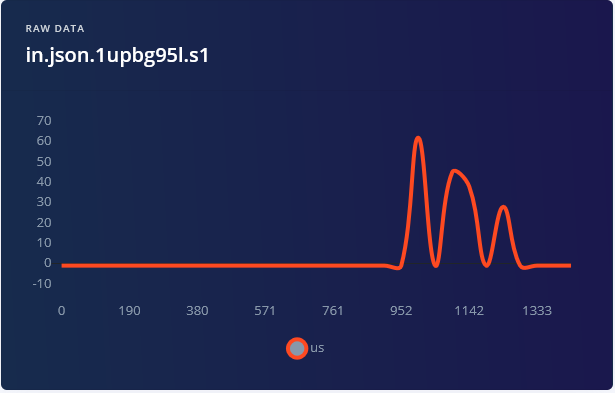
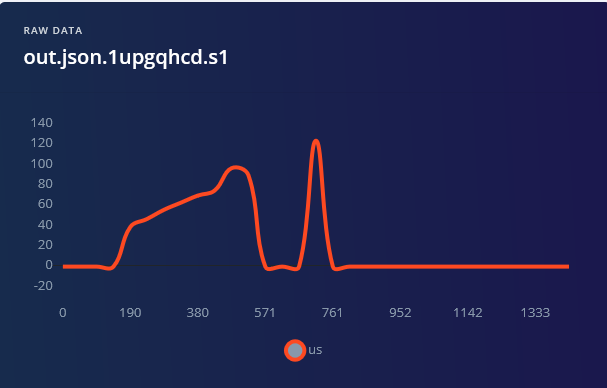
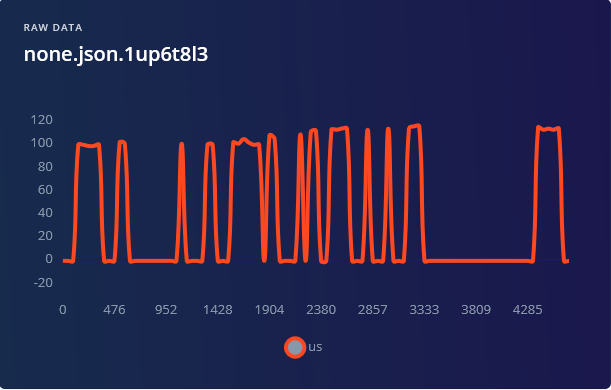
We can immediately see that for walking it, we get relatively high values(corresponding to distance from the object) first, which then decrease. And for walking out, we get completely opposite signal.
.png)
Theoretically we could write an algorithm ourselves by hand, that can determine the direction. Unfortunately, real life situations are complicated – we have people, that walk fast (shorter curve length) and slow (longer curve length), we have thinner people and people who are... not so thin and so on. So our hand-written algorithm needs to take all of these into account, which will inevitably make it complicated and convoluted. We have a task involving inference signal processing and lots of noisy data with significant variations… And the solution is — Deep Learning.
Training data acquisition
Attach Wio terminal and Ultrasonic sensor with screws to wooden or 3D printed frame, example below:
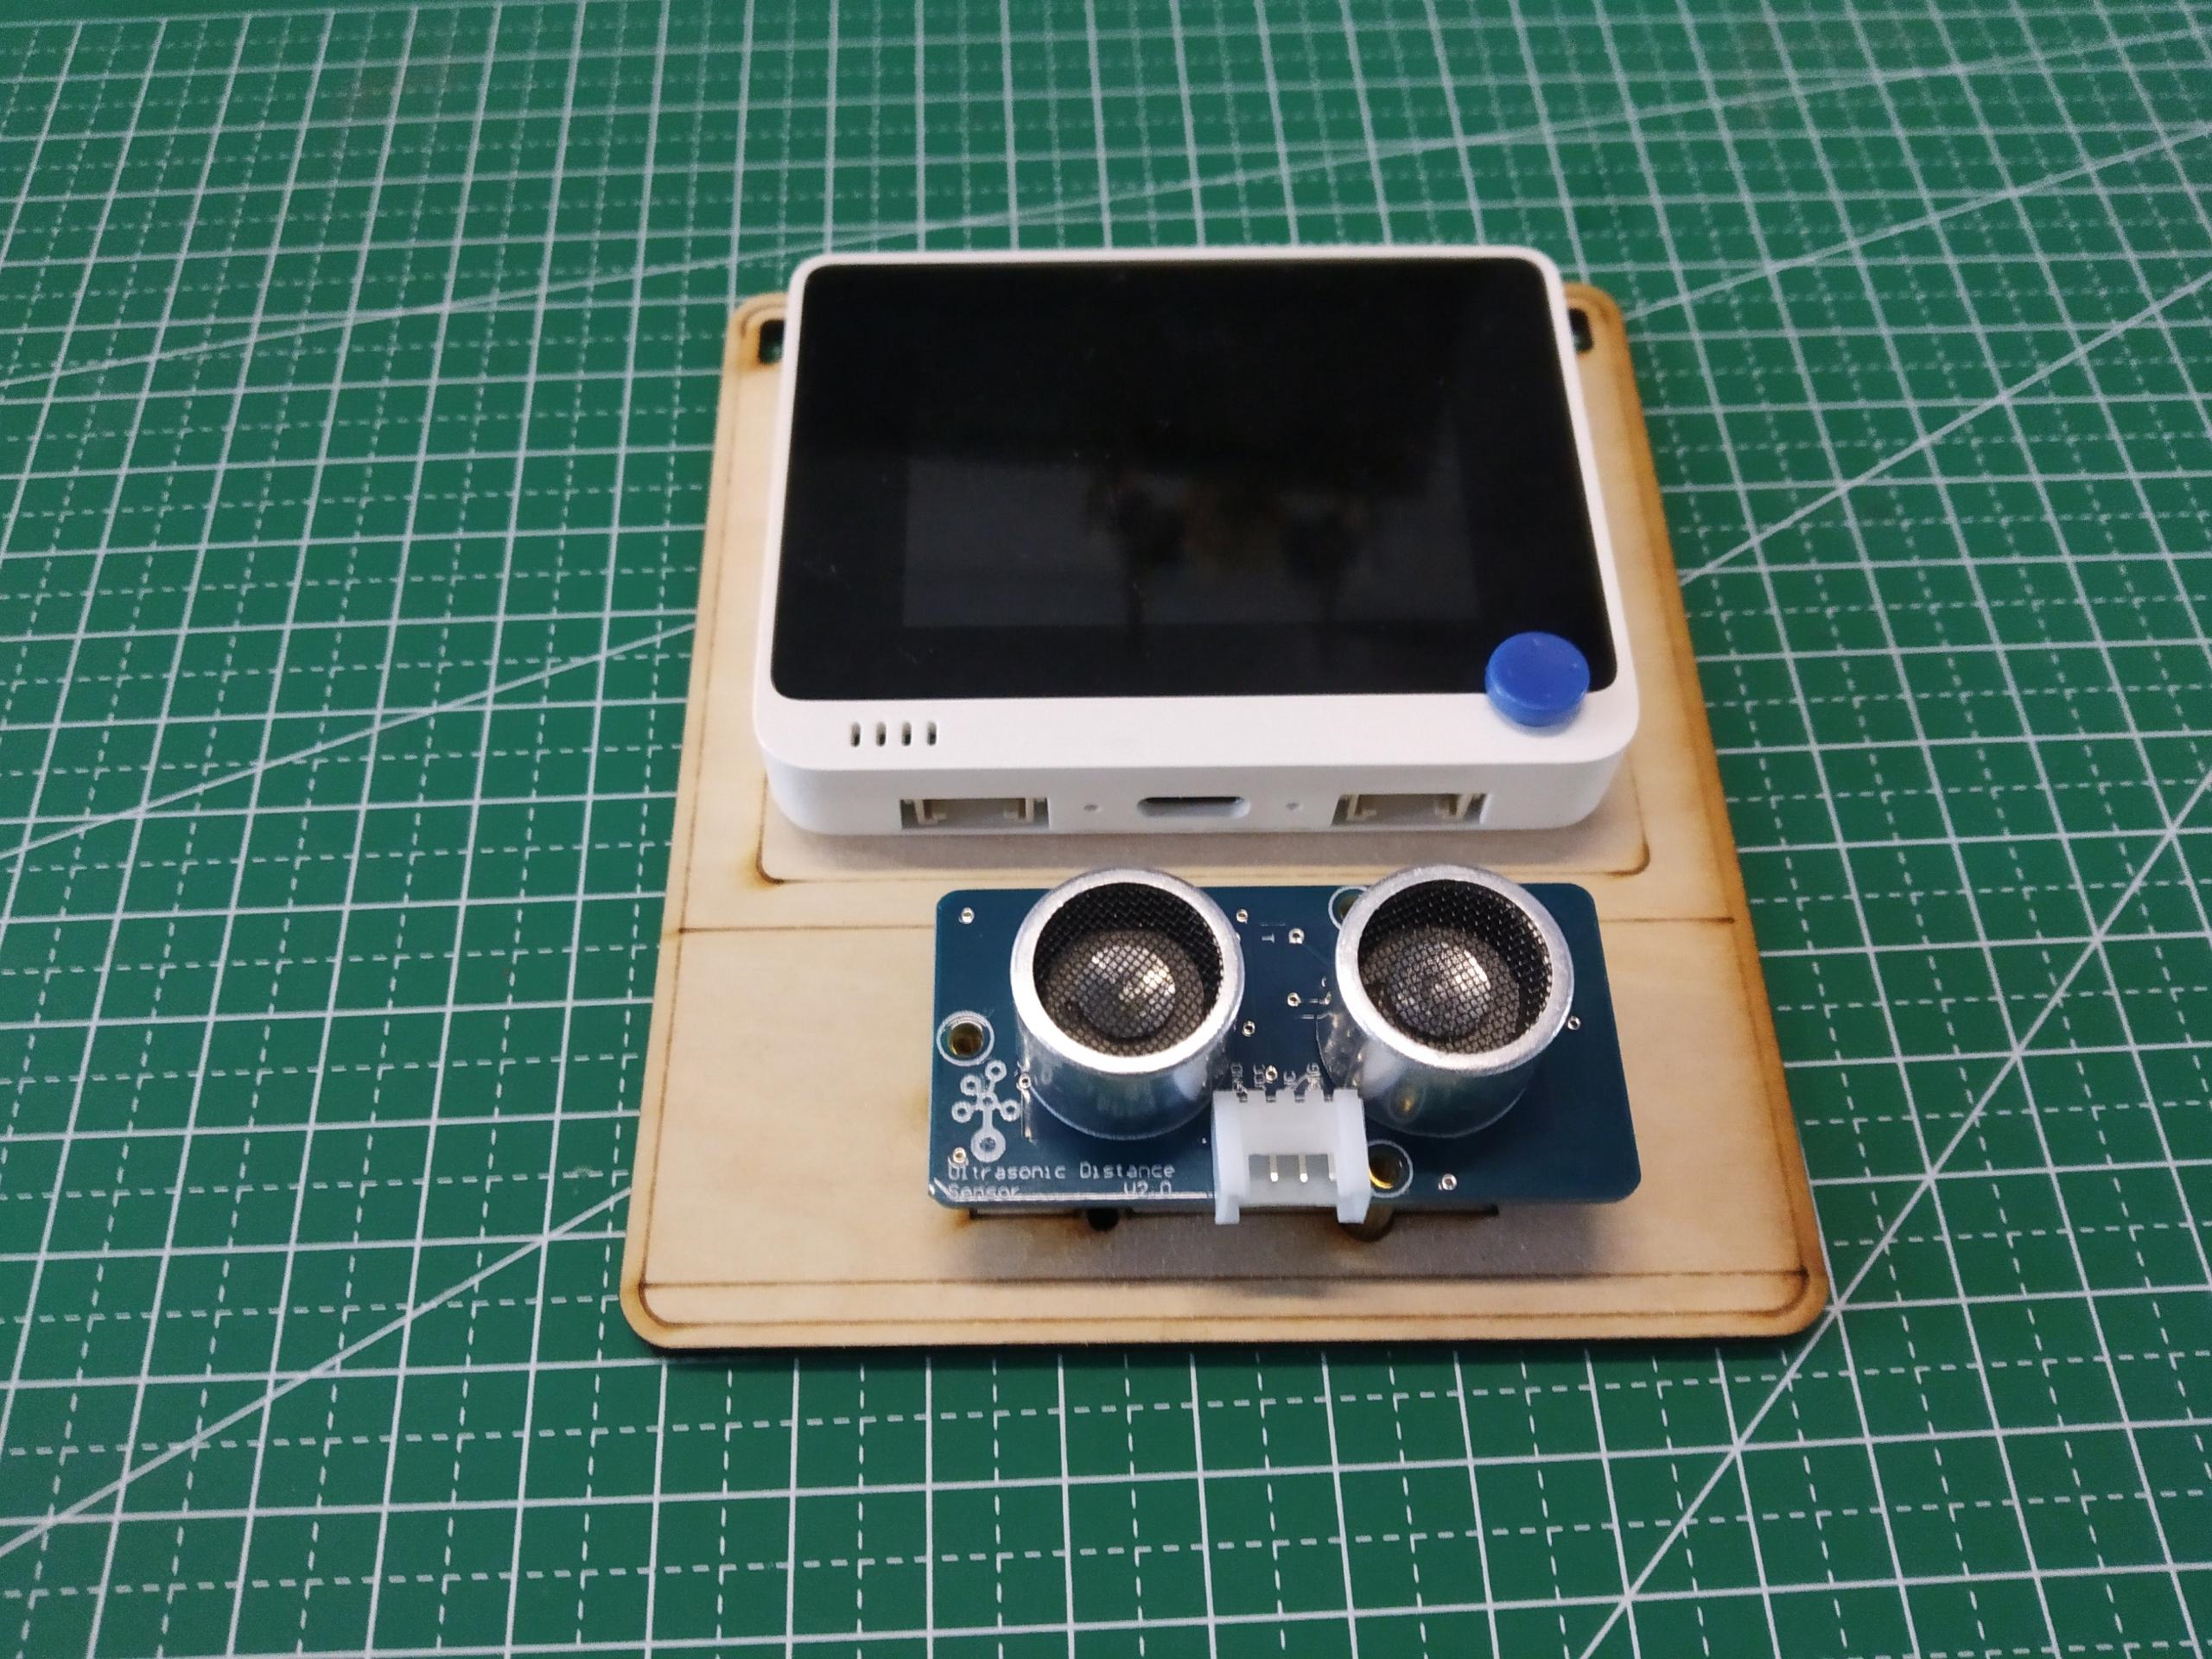
To put the frame on the wall, 3M velcro strips were used.

Additional options include using foam tape, screws or nails.
Let’s create a new project in Edge Impulse Dashboard and prepare to get the data. For gathering the data, since we don’t need very high sampling frequency, we can use data forwarder tool from edge-impulse-cli. Upload the ei_people_counter_data_collection.ino script (exactly the same script as pasted above) to Wio Terminal – the following steps assume that you have already installed Edge Impulse CLI as described in Getting started with Edge Impulse . In this particular script we filter out all the values above 200 cm, setting them to -1.
if (distance < 200.0) {
 Serial.println(distance);
}
else {
    Serial.println(-1);
}
For your application you might need to set this value lower or higher, depending on the set up. Then start walking.
For this project we recorded 1 minute 30 seconds of data for every class, each time recording 5000 ms samples and then cropping them to get 1500 ms samples – remember that variety is very important in the dataset, so make sure you have samples where you (or other people) walk fast, slow, run, etc.
For none category apart from samples that have nobody in front of the device, it is a good idea to include samples that have a person just standing close to the device and walking beside it, to avoid any movement being falsely classified as in or out.
Building a machine learning model
When you are done with data collection, create your impulse – set window length to 1500 ms and windows size increase to 500 ms.

1500 ms is more than enough to cover time duration person takes, when walking in the door or walking out, except if moving extremely slow. For processing blocks, we only have two blocks this time to experiment with – Raw data or Spectral analysis. Flatten block will erase all the time-domain information from the data, making it completely useless in determining direction, so we won’t use it. Spectral analysis block applies Fast Fourier transform to data samples, converting signal from time domain to frequency domain. While FFT can work for other types of signals, such as sounds or accelerometer data, in our case the frequency of signal actually also doesn’t matter that much, since we cannot judge if person is coming in or going out of the room based on frequency. If you look at the data visualization after Spectral analysis block, it is clear that it’s hard to separate in and out data samples.

Changing processing block to Spectrogram doesn’t really alleviate the problem and resulting accuracy still stays fairly low – the highest we could get was 79.6 %, with a lot of confusion between in and out classes. And the winner, once again is Raw data (with scaling) + 1D Convolutional network. The best results were achieved by tweaking network architecture a bit to obtain 92% accuracy, for that you will need to switch to “expert” mode and change MaxPool1D strides to 1 and pool size to 4.

How good is 92% accuracy and what can be done to improve it? 92% is fairly good as proof of concept or prototype, but horrible as a production model. For production, mileage may vary – if your application is critical and somehow used in automated control and decision making, you don’t really want to have anything below 98 – 99 percent and even that might be low, think about something like a face recognition system for payment or authentication. Are there ways to improve the accuracy of this system? • Ultrasonic sensor is cheap and ubiquitous sensor, but it is relatively slow and not very precise.

We can get better data by using Grove TF Mini LiDAR Module.
• Get more data and possibly place the sensor lower, at normal human waist level to make sure it can detect shorter than normal height people and children. • Two are better than one – having two sensors taking measurements at slightly different places will not add too much data (we only have 31 data point in each sample), but might increase the accuracy. To explore more interesting ideas, a built-in light sensor can be used if Wio Terminal is appropriately located.
Deploying to Wio Terminal
Once the model is trained we can perform live classification with data from device – here we found that window size increase of 500 ms actually doesn’t work that well and produces more false positives, so at the next step, when deploying to the device, it is better to increase the value to 750 ms. To deploy the model to Wio Terminal go to deployment tab, choose Arduino library, download it, extract the archive and put it inside of your Arduino libraries folder.
This time we will be using continuous inference example to make sure we are not missing any important data. If you remember, in the first project, for the inference, we would collect all the data points in the sample, perform the inference and then go back to sampling – that means that when feeding the data to neural network we would pause the data collection and lose some of the data.
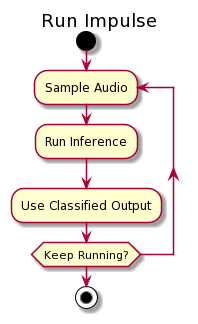
That is not optimal and we can use either DMA (Direct Memory Access), threading or multiprocessing to fix this issue.
Wio Terminal MCU (Cortex M4F core) only has one core, so multiprocessing is not an option – so in this case we will use FreeRTOS and threads. What is going to happen is that during the inference process, FreeRTOS will pause inference for a brief moment, collect the data sample and then go back to inference.
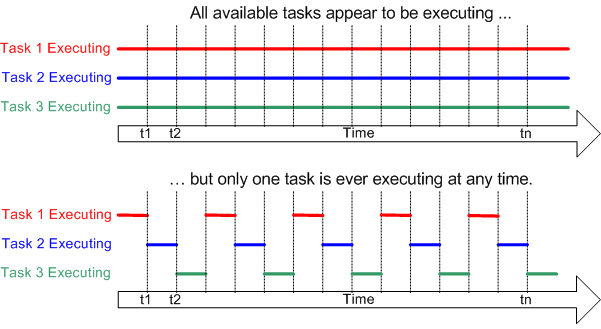
This way the actual inference will take a little longer, but the difference is negligible for this particular use case. We perform inference every 500 ms, so every 500 ms slice of the time window will be performed inference on for 3 times. Then we take the result that has the highest confidence across 3 inferences – for example we have highest confidence for “out” label 2 times and for “none” label one time, thus the result should be classified as “out”. To simplify the testing we will add the lines that turn on Wio Terminal screen when person is entering the room and turns it off when a person exits.
Open Examples -> name of your project - > nano_ble33_sense_accelerometer_continuous sketch and replace everything (including run_inference_background function declaration) above setup function with the following code block:
/* Includes ---------------------------------------------------------------- */
#include <people_counter_raw_inference.h>
#include <Seeed_Arduino_FreeRTOS.h>
#include "Ultrasonic.h"
#include "TFT_eSPI.h"

#define ERROR_LED_LIGHTUP_STATE HIGH

/* Private variables ------------------------------------------------------- */
static bool debug_nn = false; // Set this to true to see e.g. features generated from the raw signal
static uint32_t run_inference_every_ms = 500;

static float buffer[EI_CLASSIFIER_DSP_INPUT_FRAME_SIZE] = {0};
static float inference_buffer[EI_CLASSIFIER_DSP_INPUT_FRAME_SIZE];
float distance;
uint8_t axis_num = 1;

TaskHandle_t Handle_aTask;
TaskHandle_t Handle_bTask;
Ultrasonic ultrasonic(0);
TFT_eSPI tft;
In setup function, initialize LCD screen
    tft.begin();
    tft.setRotation(3);
and delete all the lines that are related to accelerometer. Then in place of inference_thread.start(mbed::callback(&run_inference_background)); paste the following code block - the reason we need to replace this line is because Thread initialization is done differently in Arduino BLE33 Sense and Wio Terminal.
    vSetErrorLed(LED_BUILTIN, ERROR_LED_LIGHTUP_STATE);

    // Create the threads that will be managed by the rtos
    // Sets the stack size and priority of each task
    // Also initializes a handler pointer to each task, which are important to communicate with and retrieve info from tasks

    xTaskCreate(run_inference_background,"Inference", 512, NULL, tskIDLE_PRIORITY + 1, &Handle_aTask);
    xTaskCreate(read_data, "Data collection", 256, NULL, tskIDLE_PRIORITY + 2, &Handle_bTask);

    // Start the RTOS, this function will never return and will schedule the tasks.

    vTaskStartScheduler();
run_inference_continuous function is largely unchanged, the only two things that need to be changed here are
• void run_inference_background() to static void run_inference_background(void*pvParameters)
• ei_classifier_smooth_init(&smooth, 10 /* no. of readings */, 7 /* min. readings the same */, 0.8 /* min. confidence */, 0.3 /* max anomaly */); to
ei_classifier_smooth_init(&smooth, 3 /* no. of readings */, 2 /* min. readings the same */, 0.6 /* min. confidence */, 0.3 /* max anomaly */);
The line above controls averaging (or smoothing) parameters, that we apply to output of the model. You can experiment with the values to see what values allow for best performance in terms of true positives/false positives rate.
While in the original code, data collection happens in loop function, for Wio Terminal FreeRTOS port, it is better to implement data collection in a thread and leave the loop function empty. Delete the loop function in original code and replace it with the following code block
/**
* @brief      Get data and run inferencing
*
* @param[in]  debug  Get debug info if true
*/
static void read_data(void* pvParameters)
{
    while (1) {
        // Determine the next tick (and then sleep later)
        uint64_t next_tick = micros() + (EI_CLASSIFIER_INTERVAL_MS * 1000);

        // roll the buffer -axis_num points so we can overwrite the last one
        numpy::roll(buffer, EI_CLASSIFIER_DSP_INPUT_FRAME_SIZE, -axis_num);

        distance = ultrasonic.MeasureInCentimeters();
        if (distance > 200.0) { distance = -1;}

        buffer[EI_CLASSIFIER_DSP_INPUT_FRAME_SIZE - 1] = distance;

        // and wait for next tick
        uint64_t time_to_wait = next_tick - micros();
        delay((int)floor((float)time_to_wait / 1000.0f));
        delayMicroseconds(time_to_wait % 1000);
    }
}

void loop()
{
  //nothing, all the work is done in two threads
}
Here we wait until it is time to get the data, then take distance measurement with ultrasonic sensor and copy it to inference buffer. Remember that since it is a thread, having delay here doesn't affect the whole system and just temporarily "stops" the thread - until it is time to take next reading. FreeRTOS can perform tasks in other threads while data collection thread is inactive.
Azure IoT Central Integration
Okay, the model works, but again all in by itself it is not suitable for actually applying it in the real world. Let’s add two elements to make it into a full-fledged application – a simple GUI and data upload to cloud with pretty graphs. We will use LVGL library for creating graphical user interface and Microsoft Azure IoT Central service for sending data to and visualization. The resulting sketch is 693 lines long and has 3 concurrent threads running in RTOS. Here is a quick recap of steps you need to make it work with IoT central. Find the project in Github repository for this project, under name WioTerminal_Azure_Central.ino and open it in Arduino IDE. After the sketch is uploaded, enter configuration mode by pressing three buttons on top of Wio Terminal and resetting the device.
“In configuration mode” will be displayed on device screen. Connect to device with Serial monitor (baud rate 115200, carriage return) and set WiFi SSID, password and Azure IoT Central credentials (in the following format set_az_iotc your_ID_scope your_primary_key your_device_ID), which you can get by following these steps:
• Go to https://apps.azureiotcentral.com/
• If you don’t have a Microsoft account yet, register one.
• Go to Build -> Custom app. Enter the app name and unique URL (can be similar to app name). Choose Free plan.
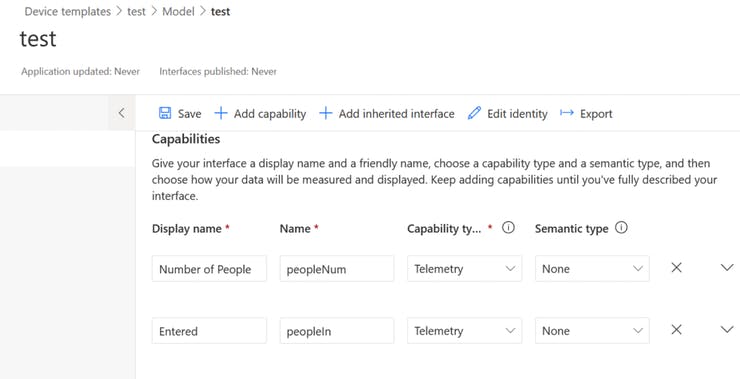
• After an app is created, go to Device Templates. Make a new template of IoT device type. Choose custom model, add three capabilities as in the below screenshot and two interfaces (press on Views -> Visualizing the device). After finishing that and making sure everything is correct, publish the template.
• Create a new device from template by going to Devices and pressing on New, remember to choose the Template you just created and published!
• Get the ID scope from Administration -> Device connection, Primary key from Administration -> Device connection -> SAS-IoT-Devices and device ID from Devices tab, where you created your device on Step 5.
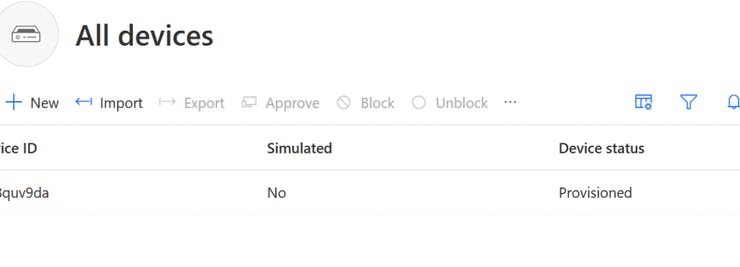
After configuration is successful, restart Wio Terminal and it will start connecting to Azure IoT Central, you can watch the detailed progress feedback on the Serial Terminal. You will then be able to see a) Device status on dashboard has changed to Provisioned b) Telemetry data from Accelerometer sensor in Device -> Raw data.
We then add the parts responsible for Edge Impulse model inference, threading and modify send telemetry function to send values for number of people entered, people left and total number of people in the room. We also add simple GUI consisting of three buttons and a text field, which displays information updates – you can see the resulting sketch by opening WioTerminal_EI_People_Counting_Azure_Central_LVGL.ino from the project Github repository.
The hardest part was really making sure everything works normally in each separate thread and does not influence other threads. Sacrifices were made in order to accommodate that without over-complicating the code too much, for example placing LVGL task update function right after interface updates and not letting it run periodically.