Grove - TF Mini LiDAR

该产品基于ToF(飞行时间)原理,集成了独特的光学和电气设计,从而实现稳定、精确、高灵敏度和高速距离检测。
ToF是飞行时间技术的缩写,其工作原理如下:传感器发出调制的近红外光,经物体反射后返回;传感器通过计算光发射和光反射之间的时间差或相位差,可以转换出到被测物体的距离,从而产生深度信息。

防止灰尘或任何其他异物进入镜头;否则可能会影响光传输。
版本
| 产品版本 | 变更 | 发布日期 |
|---|---|---|
| Grove-TF Mini LiDAR V1.0 | 初始版本 | 2017年11月 |
规格参数
| 产品名称 | TFmini |
|---|---|
| 工作范围 | 0.3m-12m |
| 10%反射率下的最大工作范围 | 5m |
| 平均功耗 | 0.6W |
| 适用电压范围 | 4.5V-6V |
| 接收角 | 2.3° |
| 最小分辨率 | 1cm |
| 频率 | 100Hz |
| 精度 | 1% (小于6m), 2% (6m-12m) |
| 距离检测单位 | cm |
| 波长 | 850nm |
| 尺寸 | 42mm×15mm×16mm |
| 工作温度 | -20℃-60℃ |
| 光敏感度 | 70,000lux |
| 重量 | 4.7g |
| 通信接口 | UART 115200 |
| LED峰值电流 | 800ma |
| 串口TTL电压电平 | 3.3V |
| 电磁兼容性(EMC) | EN 55032 Class B |
有关Grove模块的更多详细信息,请参考Grove系统
支持的平台
| Arduino | Raspberry Pi | |||
|---|---|---|---|---|
上述提到的支持平台是/是该模块软件或理论兼容性的指示。在大多数情况下,我们只为Arduino平台提供软件库或代码示例。不可能为所有可能的MCU平台提供软件库/演示代码。因此,用户必须编写自己的软件库。
开始使用
与Arduino一起使用
硬件
- 步骤 1. 准备以下物品:
| Seeeduino V4.2 | Base Shield | Grove-TF Mini LiDAR |
|---|---|---|
 |  |  |
| 立即购买 | 立即购买 | 立即购买 |
-
步骤 2. 将Grove-TF-Mini-LiDAR连接到Base Shield的D2端口,并通过USB线将Seeeduino连接到PC。
-
步骤 3. 下载演示代码,复制整个Seeed_Arduino_TFlidar文件并粘贴到您的Arduino IDE库文件中。

软件
- 步骤 1. Grove-TF Mini LiDAR是十六进制输出数据。每帧数据用9个字节编码,包括1个距离数据(Dist)。每个距离数据都有相应的信号强度信息(Strength)。帧结束是数据校验位。
| 字节 | 数据编码解释 |
|---|---|
| Byte1 | 0x59,帧头,所有帧都相同 |
| Byte2 | 0x59,帧头,所有帧都相同 |
| Byte3 | Dist_L 距离值低8位。 |
| Byte4 | Dist_H 距离值高8位。 |
| Byte5 | Strength_L 低8位。 |
| Byte6 | Strength_H 高8位。 |
| Byte7 | 积分时间。 |
| Byte8 | 保留字节。 |
| Byte9 | 校验和奇偶校验。 |
- 步骤 2. 将代码复制到Arduino IDE中并上传。
#include "TFLidar.h"

#define USETFMINI
// #define USETFLUNA

#define SERIAL Serial

#if defined(SEEED_XIAO_M0)
    #define uart  Serial1
#elif defined(SEEED_WIO_TERMINAL)
    #define uart  Serial1
#else
    SoftwareSerial uart(2, 3);
#endif

#ifdef USETFLUNA
TFLuna SeeedTFLuna;
TFLidar SeeedTFLidar(&SeeedTFLuna);
#endif

#ifdef USETFMINI
TFMini SeeedTFMini;
TFLidar SeeedTFLidar(&SeeedTFMini);
#endif


void setup() {
  // put your setup code here, to run once:
  SERIAL.begin(9600);
  while(!Serial);
  SeeedTFLidar.begin(&uart,115200);
}

void loop() {
  while(!SeeedTFLidar.get_frame_data()){
    delay(1);
  }
  // put your main code here, to run repeatedly:
  SERIAL.print("dist = ");
  SERIAL.print(SeeedTFLidar.get_distance()); //output measure distance value of LiDAR
  SERIAL.print('\t');
  SERIAL.print("strength = ");
  SERIAL.print(SeeedTFLidar.get_strength()); //output signal strength value
#ifdef USETFLUNA
  SERIAL.print("\t Chip Temprature = ");
  SERIAL.print(SeeedTFLidar.get_chip_temperature());
  SERIAL.print(" celcius degree"); //output chip temperature of Lidar
#endif
  SERIAL.println(" ");
  // delay(1000);
}
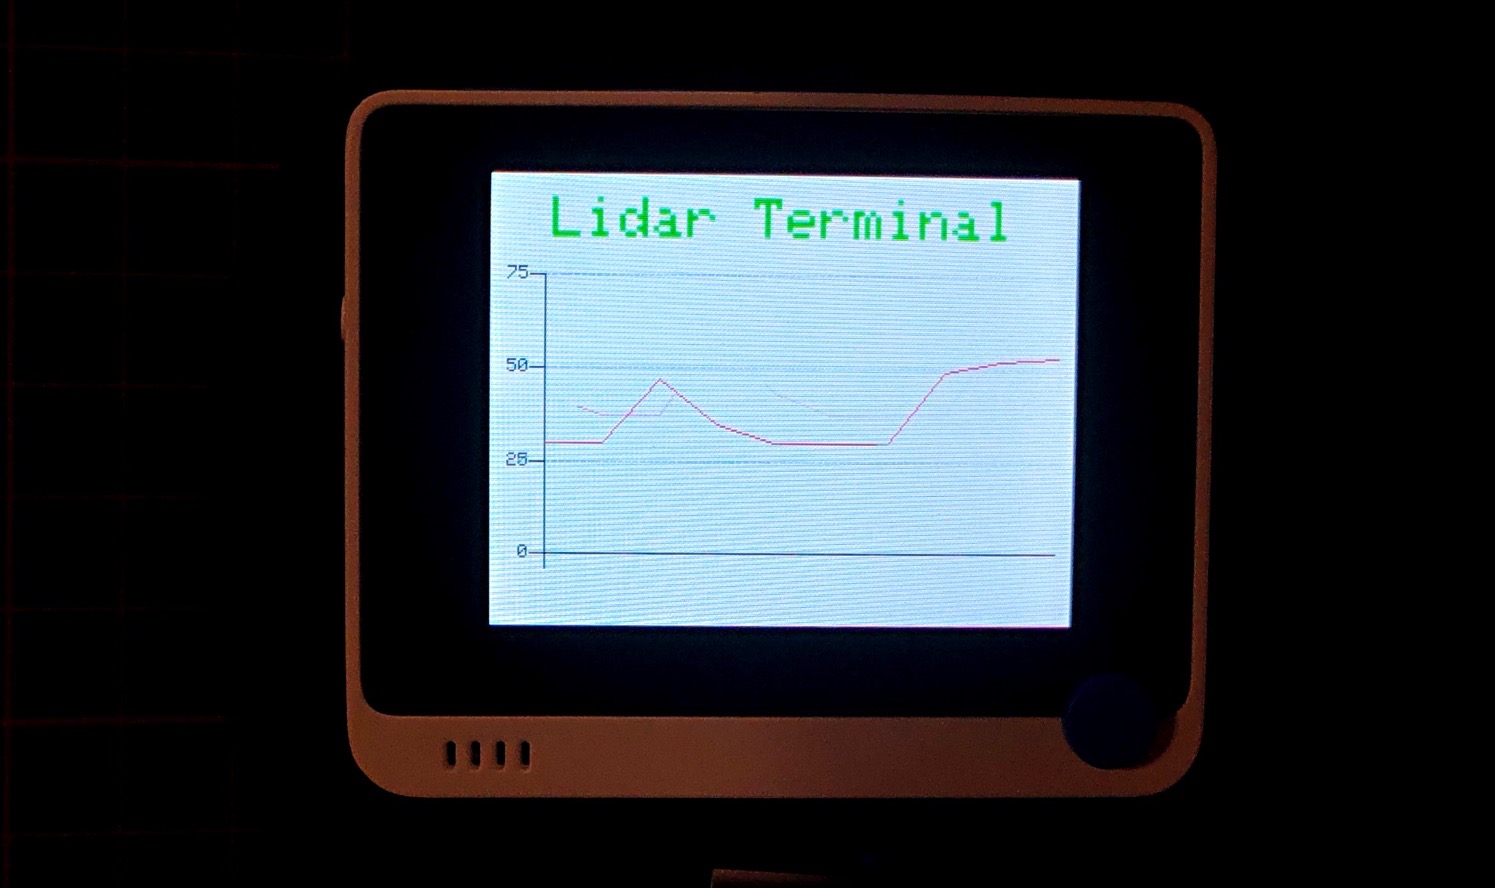
- 步骤 3. 我们将在终端上看到距离显示。蓝色曲线是距离,红色是强度。

如果只需要距离,您可以删除演示代码的第41行到第43行:
SERIAL.print("strength = ");
SERIAL.print(SeeedTFLidar.get_strength()); //output signal strength value
与Wio Terminal一起使用
硬件
| Wio Terminal | Grove-TF-Mini-LiDAR | 跳线 |
|---|---|---|
 | |  |
| 立即购买 | 立即购买 | 立即购买 |
硬件连接

引脚图

在开始使用跳线连接Wio Terminal之前,请参考上面的引脚图说明。
步骤 1 通过跳线将Grove-TF-Mini-LiDAR插入Wio Terminal,同时通过USB线将Wio Terminal连接到PC。
步骤 2 下载演示代码,复制整个Seeed_Arduino_Linechart文件并粘贴到您的Arduino IDE库文件中。
步骤 3 将演示代码复制到您的Arduino IDE中。
软件
#include"seeed_line_chart.h" //include the library
#include "TFLidar.h"
#define LINE_DIS 0X00
#define STRING_DIS 0X01
TFMini SeeedTFMini;
TFLidar SeeedTFLidar(&SeeedTFMini);
#define uart  Serial1

TFT_eSPI tft;

#define max_size 10 //maximum size of data
doubles data; //Initilising a doubles type to store data
TFT_eSprite spr = TFT_eSprite(&tft);  // Sprite

void setup() {
    Serial.begin(115200);
    pinMode(WIO_KEY_C, INPUT_PULLUP);
    tft.begin();
    tft.setRotation(3);
    spr.createSprite(TFT_HEIGHT,TFT_WIDTH);
    SeeedTFLidar.begin(&uart,115200);
}
uint8_t mode = LINE_DIS;
void loop() {

    if (digitalRead(WIO_KEY_C) == LOW) {
        mode ++;
        if(mode > STRING_DIS ) mode = LINE_DIS;
        while(!digitalRead(WIO_KEY_C));
    }
    display(get_Lidar_data(),mode);
    delay(50);
}

uint16_t get_Lidar_data()
{
    while(!SeeedTFLidar.get_frame_data()){
        delay(1);
    }
    return SeeedTFLidar.get_distance();
}

void display(uint16_t lidar_data,uint8_t mode){

    spr.fillSprite(TFT_WHITE);
    //Settings for the line graph title
    auto header =  text(0, 0)
                .value("Lidar Terminal")
                .align(center)
                .valign(vcenter)
                .width(tft.width())
                .color(green)
                .thickness(3);
    header.height(header.font_height() * 2);
    header.draw(); //Header height is the twice the height of the font
    if (LINE_DIS == mode){
        if (data.size() == max_size) {
            data.pop();//this is used to remove the first read variable
        }
        data.push(lidar_data); //read variables and store in data
    //Settings for the line graph
        auto content = line_chart(10, header.height()); //(x,y) where the line graph begins
            content
                    .height(tft.height() - header.height() * 1.5) //actual height of the line chart
                    .width(tft.width() - content.x() * 2) //actual width of the line chart
                    .based_on(0.0) //Starting point of y-axis, must be a float
                    .show_circle(false) //drawing a cirle at each point, default is on.
                    .value(data) //passing through the data to line graph
                    .color(TFT_RED) //Setting the color for the line
                    .draw();
    }
    else if (STRING_DIS == mode){
        for(int8_t line_index = 0;line_index < 5 ; line_index++)
        {
            spr.drawLine(0, 50 + line_index, tft.width(), 50 + line_index, TFT_GREEN);
        }
        auto header =  text(0, 0)
                    .thickness(1);
        spr.setFreeFont(&FreeSansBoldOblique24pt7b);
        spr.setTextColor(TFT_BLUE);
        spr.drawFloat(lidar_data / 100.00,2,80,110);
        spr.drawString(" M",80 + 90,110,1);

    }
    spr.pushSprite(0, 0);

}
如果一切正常,Wio terminal 的屏幕上将显示如下图像。
资源
- [数据手册] Grove-TF-Mini-LiDAR
- [数据手册] Grove-TF-Luna-LiDAR
- [ZIP] Seeed_Arduino_TFlidar
- [ZIP] Seeed_Arduino_Linechart
技术支持与产品讨论
感谢您选择我们的产品!我们在此为您提供不同的支持,以确保您使用我们产品的体验尽可能顺畅。我们提供多种沟通渠道,以满足不同的偏好和需求。