直方图
本文档介绍如何在 Wio Terminal 上绘制直方图。与折线图库类似,您可以使用它来显示原始传感器数值,在屏幕上可视化读数。这个库非常灵活,可以根据您的需要进行修改。
库安装
安装直方图库
-
访问 Seeed_Arduino_Histogram 并将整个仓库下载到您的本地驱动器。
-
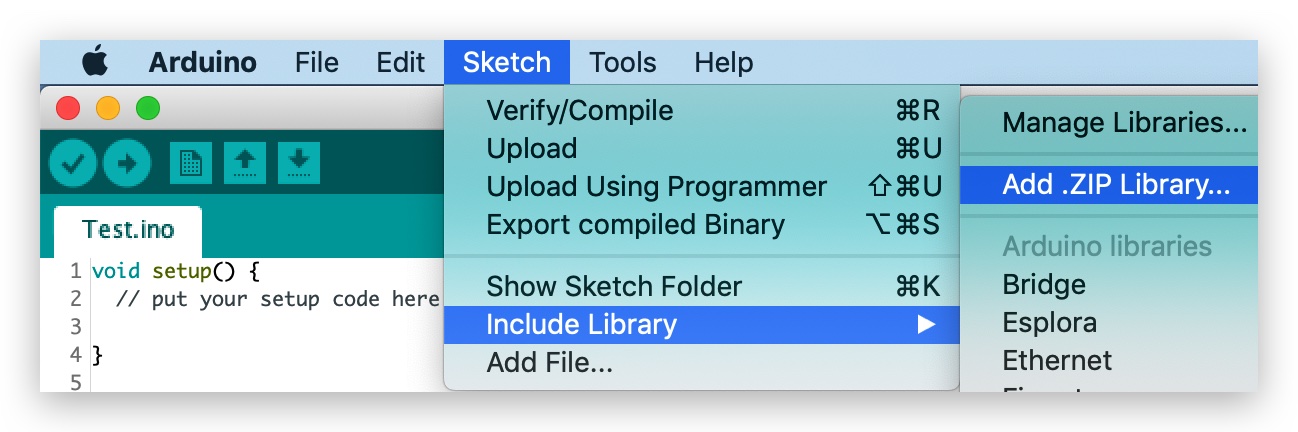
现在,可以将库安装到 Arduino IDE 中。打开 Arduino IDE,点击
sketch->Include Library->Add .ZIP Library,然后选择您刚刚下载的Seeed_Arduino_Histogram文件。
入门指南
初始化绘制直方图
包含直方图库并按如下方式初始化直方图:
#include <TFT_eSPI.h> // Hardware-specific library
#include <SPI.h>
#include"Histogram.h"

TFT_Histogram histogram=TFT_Histogram(); //Initializing Histogram
TFT_eSPI tft = TFT_eSPI(); //Initializing TFT

void setup(void) {
  tft.init();
  histogram.initHistogram(&tft);
  ...
}
在直方图中创建列
在直方图中创建列:
void formHistogram(String label,int NO,double Histogram_value,int Histogram_WIDTH,uint32_t colour);
其中 label 是列下方的列名,NO 是直方图列的编号标签,Histogram_value 是直方图列的值,Histogram_WIDTH 是直方图列的宽度,colour 是直方图列的颜色。
显示直方图
显示直方图:
void showHistogram();
更改列值
更改现有列的值:
void changeParam(uint8_t NO, String lable, float Histogram_value, uint32_t colour);
其中 NO 指向直方图列的编号标签(要更改哪一列)。
删除列
从直方图中删除列:
void deleteCylinder(uint8_t NO);
其中 NO 指向直方图列的编号标签。
向直方图添加折线图
添加折线图:
void lineChart(uint32_t colour);
其中 color 是折线图的颜色。
隐藏直方图的坐标轴
void notShowAxis();
其他有用的函数
有关直方图库的更多其他有用函数,请参考 Histogram.h。此外,它还提供了一系列示例以及完整的功能演示,可以在 examples 文件夹中找到。
示例代码
#include <TFT_eSPI.h> //Hardware-specific library
#include <SPI.h>
#include"Histogram.h" //include histogram library
TFT_Histogram histogram=TFT_Histogram(); //Initializing tft and histogram
TFT_eSPI tft = TFT_eSPI();
void setup() {
tft.init();
histogram.initHistogram(&tft);
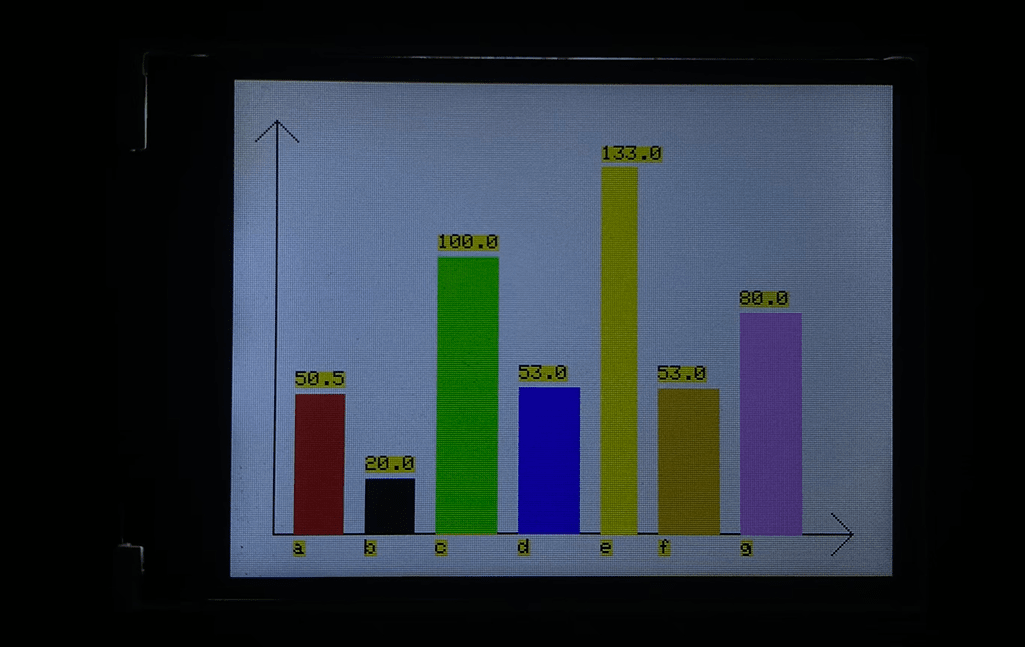
histogram.formHistogram("a",1,50.55,40,TFT_RED); //Column 1
histogram.formHistogram("b",2,20,40,TFT_BLACK); //Column 2
histogram.formHistogram("c",3,100,50,TFT_GREEN); //Column 3
histogram.formHistogram("d",4,53,50,TFT_BLUE); //Column 4
histogram.formHistogram("e",5,133,30,TFT_YELLOW); //Column 5
histogram.formHistogram("f",6,53,50,TFT_ORANGE); //Column 6
histogram.formHistogram("g",7,80,50,TFT_PINK); //Column 7
histogram.showHistogram(); //show histogram
delay(3000);
histogram.changeParam(6,"F",55,TFT_PINK);//change column 6
histogram.deleteCylinder(7);//delete colum 7
histogram.lineChart(TFT_BLACK);
delay(2000);
histogram.notShowAxis();//hiding the axis of histogram
}
void loop() {
}
技术支持与产品讨论
感谢您选择我们的产品!我们在这里为您提供不同的支持,以确保您使用我们产品的体验尽可能顺畅。我们提供多种沟通渠道,以满足不同的偏好和需求。