折线图
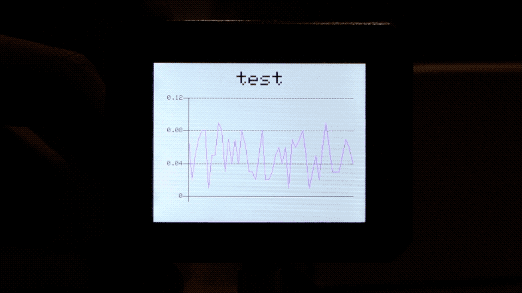
本文档介绍如何在 Wio Terminal 上绘制折线图。您可以使用此功能显示原始传感器数值,在屏幕上可视化读数,就像串口绘图器一样!该库非常灵活,可以根据您的需要进行调整。
库安装
为 Wio Terminal 安装 Seeed_Arduino_Linechart 2D 图形库
-
访问 Seeed_Arduino_Linechart 并将整个仓库下载到您的本地驱动器。
-
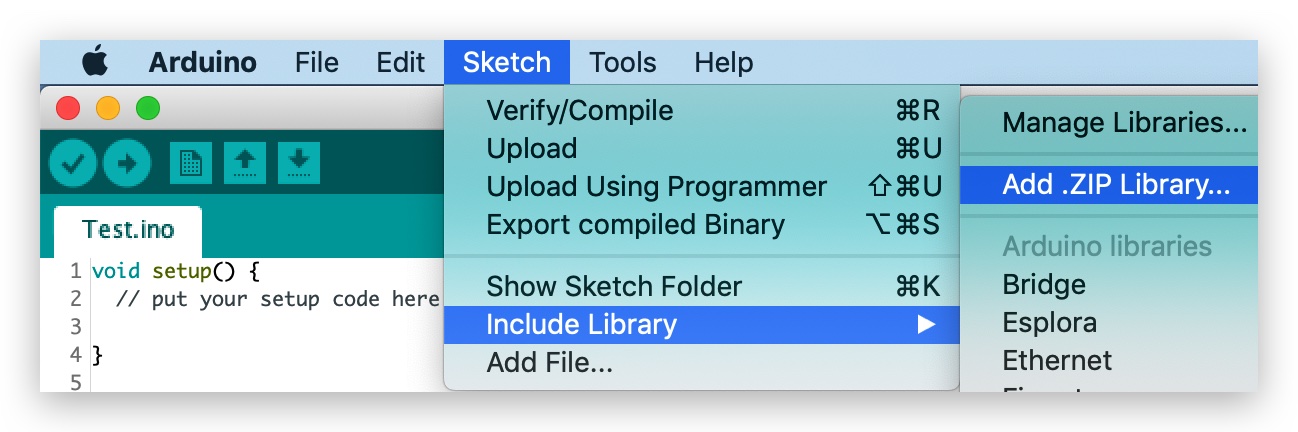
现在,可以将 Wio Terminal_graphics 库安装到 Arduino IDE 中。打开 Arduino IDE,点击
sketch->Include Library->Add .ZIP Library,然后选择您刚刚下载的Seeed_Arduino_Linechart文件。
入门指南
初始化绘制折线图
首先,定义要存储的变量的最大数量,以及一个用于存储数据的 doubles 类型,并使用 TFT Sprite 功能创建一个缓冲区。
#define max_size 50 //数据的最大大小
doubles data; //初始化一个 doubles 类型来存储数据
TFT_eSprite spr = TFT_eSprite(&tft);  // Sprite
初始化 LCD 屏幕
void setup() {
    tft.begin();
    tft.setRotation(3);
    spr.createSprite(TFT_HEIGHT,TFT_WIDTH);
}
将变量加载到数据中
使用 data.push(variable) 将变量(即传感器读数)存储在数据中,如果达到预定义的最大数量,则删除第一个变量(继续进行)。
    spr.fillSprite(TFT_WHITE);
    if (data.size() == max_size) {
        data.pop(); //这用于删除第一个读取的变量
    }
    data.push(0.01 * random(1, 10)); //读取变量并存储在数据中
初始化折线图标题的设置
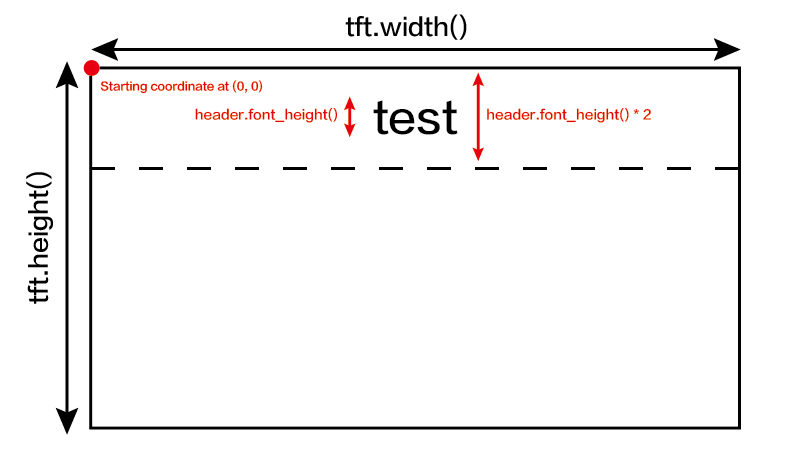
一些配置折线图标题所需显示的设置。初始化一个 text(x, y) 结构体,其中 (x, y) 是标题的起始坐标。并按如下配置设置。在此示例中,header 是此结构体的名称,可以更改设置并配置,如 header.value("test") 等。
    //折线图标题的设置
    auto header =   text(0, 0)           //标题的起始坐标
                .value("test")      //折线图的实际标题
                .align(center)      //标题的水平对齐
                .valign(vcenter)    //标题的垂直对齐
                .width(tft.width()) //标题的宽度
                .thickness(3);      //字体的粗细

    header.height(header.font_height() * 2); //标题的高度是字体高度的两倍
    header.draw();
为了帮助理解此示例代码,请参考下图中的标题配置:
初始化折线图的设置并在 LCD 屏幕上绘制
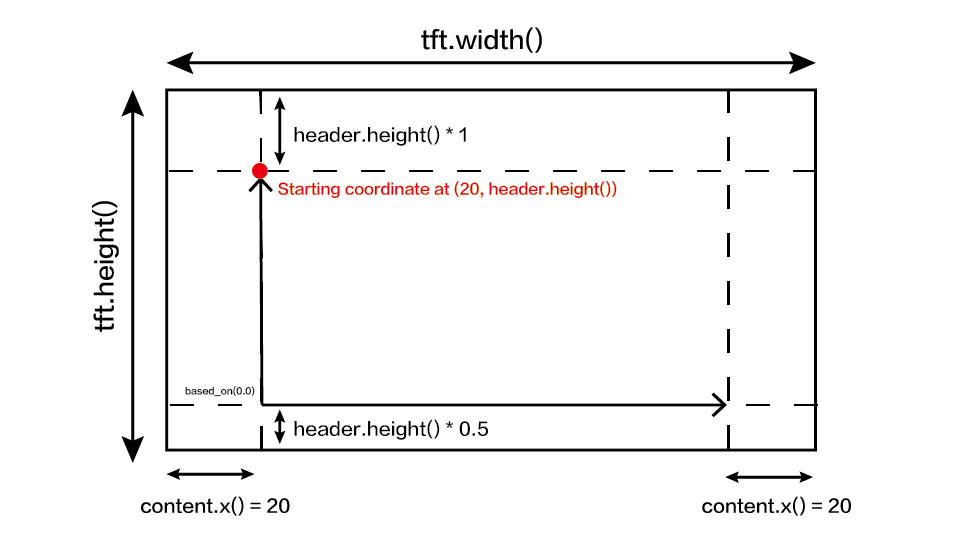
一些配置折线图所需显示的设置。初始化一个 line_chart(x, y) 结构体,其中 (x, y) 是折线图的起始坐标。并按如下配置设置。在此示例中,content 是此结构体的名称,可以更改设置并配置,如 content.based_on(0.0) 等。调整这些设置以获得首选显示!
  //折线图的设置
    auto content = line_chart(20, header.height()); //(x,y) 折线图开始的位置
         content
                .height(tft.height() - header.height() * 1.5) //折线图的实际高度
                .width(tft.width() - content.x() * 2) //折线图的实际宽度
                .based_on(0.0) //y轴的起始点,必须是浮点数
                .show_circle(false) //在每个点绘制圆圈,默认为开启
                .value(data) //将数据传递给折线图
                .color(TFT_PURPLE) //设置线条的颜色
                .draw();

    spr.pushSprite(0, 0);
    delay(50);
为了帮助理解此示例代码,请参考下图中的折线图配置:
完整代码
#include"seeed_line_chart.h" //包含库文件
TFT_eSPI tft;

#define max_size 50 //数据的最大大小
doubles data; //初始化一个doubles类型来存储数据
TFT_eSprite spr = TFT_eSprite(&tft);  // Sprite

void setup() {
    tft.begin();
    tft.setRotation(3);
    spr.createSprite(TFT_HEIGHT,TFT_WIDTH);
}

void loop() {
    spr.fillSprite(TFT_WHITE);
    if (data.size() == max_size) {
        data.pop();//这用于移除第一个读取的变量
    }
    data.push(0.01 * random(1, 10)); //读取变量并存储在data中

    //折线图标题的设置
    auto header =  text(0, 0)
                .value("test")
                .align(center)
                .valign(vcenter)
                .width(tft.width())
                .thickness(3);

    header.height(header.font_height() * 2);
    header.draw(); //标题高度是字体高度的两倍

  //折线图的设置
    auto content = line_chart(20, header.height()); //(x,y) 折线图开始的位置
         content
                .height(tft.height() - header.height() * 1.5) //折线图的实际高度
                .width(tft.width() - content.x() * 2) //折线图的实际宽度
                .based_on(0.0) //y轴的起始点,必须是浮点数
                .show_circle(false) //在每个点绘制圆圈,默认是开启的。
                .value(data) //将数据传递给折线图
                .color(TFT_PURPLE) //设置线条的颜色
                .draw();

    spr.pushSprite(0, 0);
    delay(50);
}
技术支持与产品讨论
感谢您选择我们的产品!我们在这里为您提供不同的支持,以确保您使用我们产品的体验尽可能顺畅。我们提供多种沟通渠道,以满足不同的偏好和需求。