使用 Grafana 构建您自己的天气仪表板

介绍
我们将在这里向您介绍如何在您的 reTerminal 上使用 Grafana 制作您自己的天气仪表板,这要归功于 Michaelm Klementsk。
InfluxDB 是由 InfluxData 公司开发的开源时间序列数据库 (TSDB)。它使用 Go 编程语言编写,用于存储和检索运营监控、应用程序指标、物联网传感器数据和实时分析等领域的时间序列数据。它还支持处理来自 Graphite 的数据。
Grafana 是一个多平台开源分析和交互式可视化 Web 应用程序。当连接到支持的数据源时,它为 Web 提供图表、图形和警报。还提供具有附加功能的许可 Grafana Enterprise 版本,可作为自托管安装或 Grafana Labs 云服务上的帐户。它可通过插件系统进行扩展。最终用户可以使用交互式查询构建器创建复杂的监控仪表板。Grafana 分为前端和后端,分别用 TypeScript 和 Go 编写。
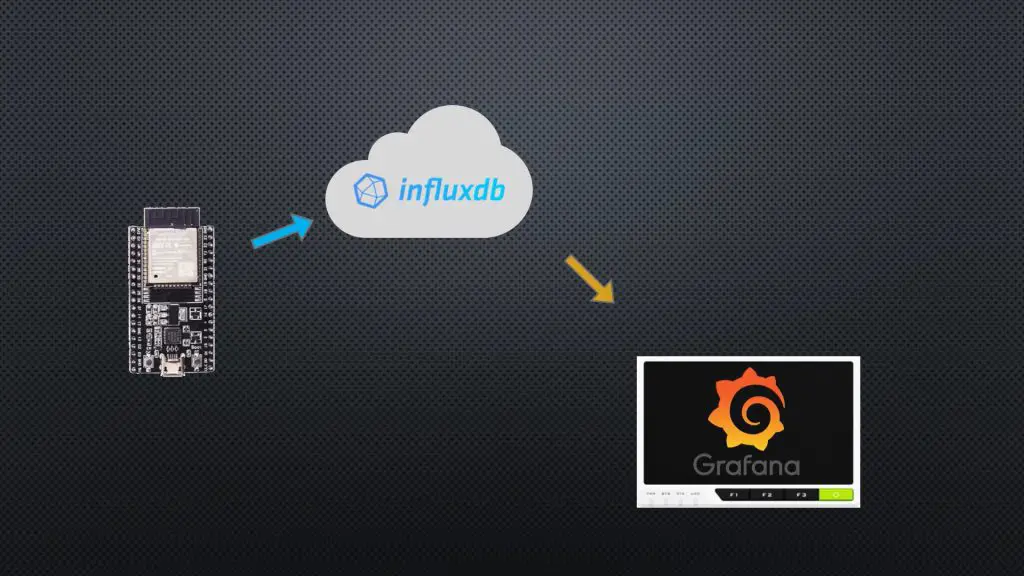
我们将使用 ESP32 来收集温度、湿度和压力读数。然后这些数据将被发布到 InfluxDB 中的时间序列数据库。InfluxDB 可以在 Raspberry Pi 上本地运行,也可以在他们的云服务器上运行,我们将使用他们的云服务器。然后我们将使用一个名为 Grafana 的分析和可视化应用程序来显示存储在数据库中的信息。Grafana 也可以在我们的 Raspberry Pi(在这种情况下是 reTerminal)上本地运行,或者在他们的云服务器上运行。我们将在我们的 reTerminal 上本地安装和运行它。您不需要为 InfluxDB 和 Grafana 使用单独的 Pi,如果您愿意,您可以在您的 reTerminal 上本地运行两者 - 我只是不想为了收集数据而必须让 reTerminal 一直运行。
所需材料
- reTerminal
- 电源
- ESP32
- Grove 传感器入门套件
- 面包板
- 面包板跳线
Azure 和 InfluxDB 设置
我们需要首先创建一个虚拟机。
- 步骤 1. 打开以下页面并登录到您的 Microsoft Azure 服务。点击
Virtual machines并点击Create。

- 步骤 2. 在虚拟机中选择 Ubuntu 18.04 系统作为默认系统。点击
Review + create并转到下一页。

- 步骤 3. 所有配置都已选择,点击
Create。

进度需要一段时间,完成后,点击 Go to resource 按钮。

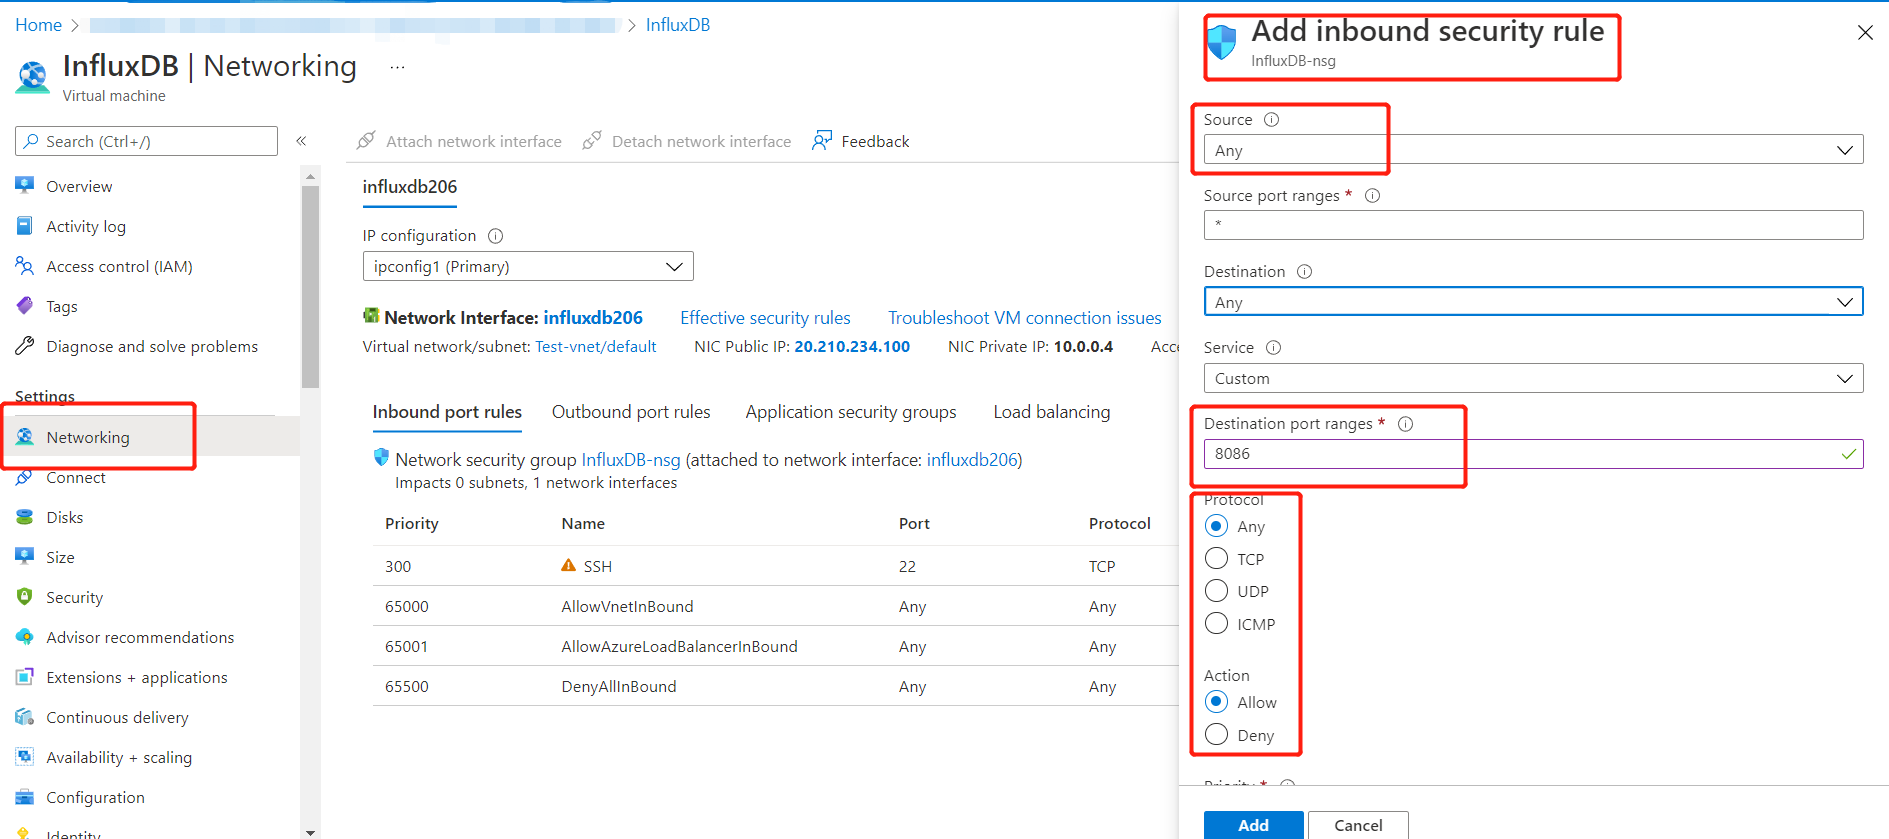
然后会转到下面的页面。点击 Networking,选择 Add inbound port rule 并添加 8086 端口,目标设置为任意。
- 步骤 4. 复制这些命令来安装 docker 并启用它。
sudo apt udpate
sudo apt install docker docker-compose -y
sudo systemctl enable --now docker && sudo systemctl start docker
sudo systemctl status docker

- 步骤 5. 使用命令拉取 InfluxDB 镜像。
sudo docker pull influxdb:2.1.1

- 步骤 6. 应用命令在后台运行 InfluxDB。
sudo docker run -d --name influxdb -p 8086:8086 influxdb:2.1.1

- 步骤 7. 打开浏览器,然后输入
http://yourip:8086(您的IP地址)。点击"Get Started"开始使用。

- 步骤 8. 记录您的
Organization Name和Bucket Name,然后点击"Continue"

- 步骤 9. 点击
Data > API Tokens

Azure 和 InflexDB 现在已经设置完成,接下来我们将转到 ESP32。
ESP32 设置
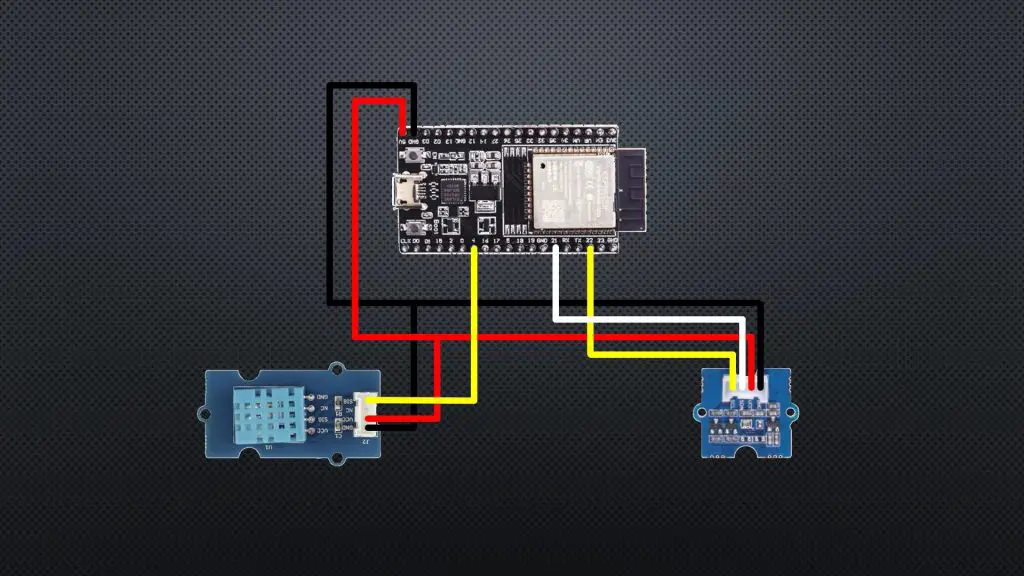
为了收集天气数据,我们将使用一个 ESP32,连接一个 DHT11 传感器到引脚 4,以及一个 BMP280 压力传感器连接到 I2C 接口(引脚 21 和 22)。这里的示例使用了来自初学者套件的两个 Grove 传感器模块,因为它们已经内置了所有必需的电子元件(附加电阻等)。
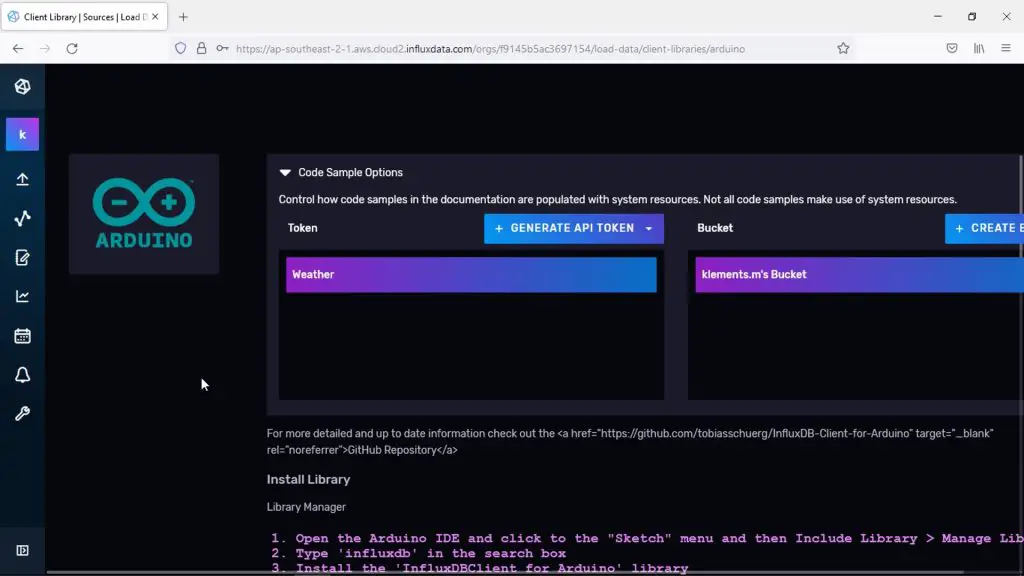
- 步骤 1. 打开 Arduino IDE 并安装库文件。这里我们提供两种安装方式。
- 使用库管理器
1. Open the Arduino IDE and click to the "Sketch" menu and then Include Library > Manage Libraries.
2. Type 'influxdb' in the search box
3. Install the 'InfluxDBClient for Arduino' library
- 手动安装
1. cd <arduino-sketch-location>/library.
2. git clone https://github.com/tobiasschuerg/InfluxDB-Client-for-Arduino
3. Restart the Arduino IDE
- 步骤 2. 在草图中复制以下代码。
#include <Wire.h>                                                   //Import the required libraries
#include "DHT.h"
#include "Seeed_BMP280.h"
#include <WiFiMulti.h>
WiFiMulti wifiMulti;
#define DEVICE "ESP32"

#include <InfluxDbClient.h>
#include <InfluxDbCloud.h>

#define WIFI_SSID "xxxxxxxx"                                            //Network Name
#define WIFI_PASSWORD "xxxxxxxxxx"                                        //Network Password
#define INFLUXDB_URL "http://xxxxxxxx:8086"                                                 //InfluxDB v2 server url, e.g. https://eu-central-1-1.aws.cloud2.influxdata.com (Use: InfluxDB UI -> Load Data -> Client Libraries)
#define INFLUXDB_TOKEN "xxxxxxxxx"                                                                                             //InfluxDB v2 server or cloud API token (Use: InfluxDB UI -> Data -> API Tokens -> <select token>)
#define INFLUXDB_ORG "xxxxxxx"                                                                                               //InfluxDB v2 organization id (Use: InfluxDB UI -> User -> About -> Common Ids )
#define INFLUXDB_BUCKET "xxxxxxx"                                                                                            //InfluxDB v2 bucket name (Use: InfluxDB UI ->  Data -> Buckets)
#define TZ_INFO "JST-9"                                                                                                //InfluxDB v2 timezone

DHT dht(4,DHT11);                                                   //DHT and BMP sensor parameters
BMP280 bmp280;

int temp = 0;                                                       //Variables to store sensor readings
int humid = 0;
int pressure = 0;

//InfluxDBClient client(INFLUXDB_URL, INFLUXDB_ORG, INFLUXDB_BUCKET, INFLUXDB_TOKEN, InfluxDbCloud2CACert);                 //InfluxDB client instance with preconfigured InfluxCloud certificate
InfluxDBClient client(INFLUXDB_URL, INFLUXDB_ORG, INFLUXDB_BUCKET, INFLUXDB_TOKEN);

Point sensor("weather");                                            //Data point

void setup()
{
  Serial.begin(115200);                                             //Start serial communication

  dht.begin();                                                      //Connect to the DHT Sensor
  if(!bmp280.init())                                                //Connect to pressure sensor
    Serial.println("bmp280 init error!");

  WiFi.mode(WIFI_STA);                                              //Setup wifi connection
  wifiMulti.addAP(WIFI_SSID, WIFI_PASSWORD);

  Serial.print("Connecting to wifi");                               //Connect to WiFi
  while (wifiMulti.run() != WL_CONNECTED)
  {
    Serial.print(".");
    delay(100);
  }
  Serial.println();

  sensor.addTag("device", DEVICE);                                   //Add tag(s) - repeat as required
  sensor.addTag("SSID", WIFI_SSID);

  timeSync(TZ_INFO, "pool.ntp.org", "time.nis.gov");                 //Accurate time is necessary for certificate validation and writing in batches

  if (client.validateConnection())                                   //Check server connection
  {
    Serial.print("Connected to InfluxDB: ");
    Serial.println(client.getServerUrl());
  }
  else
  {
    Serial.print("InfluxDB connection failed: ");
    Serial.println(client.getLastErrorMessage());
  }
}

void loop()                                                          //Loop function
{
  temp = dht.readTemperature();                                      //Record temperature
  humid = dht.readHumidity();                                        //Record temperature
  pressure = bmp280.getPressure()/100;                               //Record pressure

  sensor.clearFields();                                              //Clear fields for reusing the point. Tags will remain untouched

  sensor.addField("temperature", temp);                              // Store measured value into point
  sensor.addField("humidity", humid);                                // Store measured value into point
  sensor.addField("pressure", pressure);                             // Store measured value into point


  if (wifiMulti.run() != WL_CONNECTED)                               //Check WiFi connection and reconnect if needed
    Serial.println("Wifi connection lost");

  if (!client.writePoint(sensor))                                    //Write data point
  {
    Serial.print("InfluxDB write failed: ");
    Serial.println(client.getLastErrorMessage());
  }

  Serial.print("Temp: ");                                            //Display readings on serial monitor
  Serial.println(temp);
  Serial.print("Humidity: ");
  Serial.println(humid);
  Serial.print("Pressure: ");
  Serial.println(pressure);
  delay(1000);                                                      //Wait 60 seconds
}
注意: 代码尚未完成。如果您设置了 API 令牌和存储桶,从 InfluxDB 仪表板访问的 Arduino 接口页面上生成的代码将已经包含正确的设置信息,因此您只需要将其复制到您的代码中。
- 步骤 3. 上传代码并检查结果。

过一会儿,我们可以看到信息现在已经在我们的 InfluxDB 数据库中可用,所以我们知道我们的 ESP32 工作正常。现在我们可以继续在我们的 reTerminal 上安装 Grafana 并设置它来显示数据库中的信息。
在 reTerminal 上安装和设置 Grafana
接下来,我们将按照他们网站上概述的终端说明来安装 Grafana,用于在 Debian 或 Ubuntu 上安装。然后我们只需要启动 Grafana 并将其设置为在启动时重新启动。
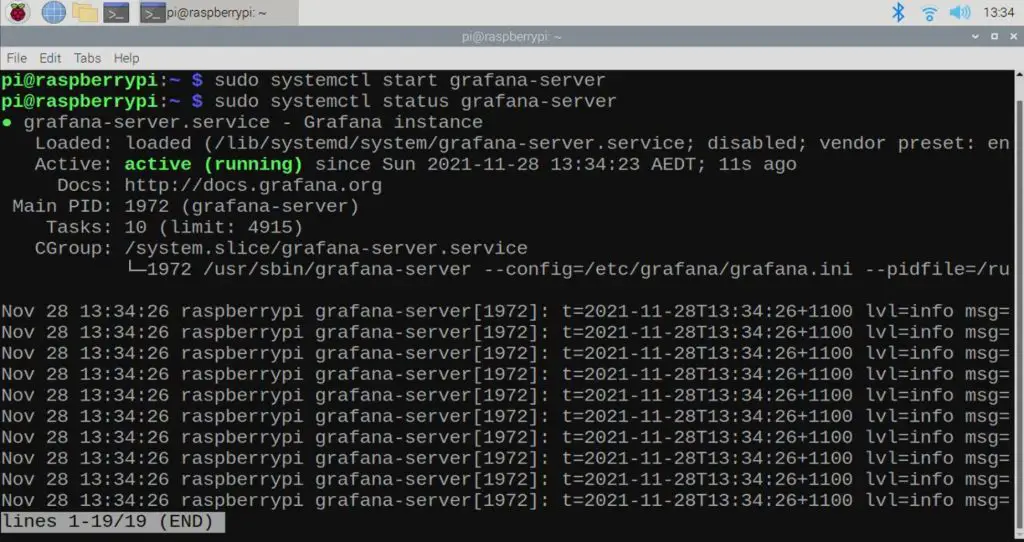
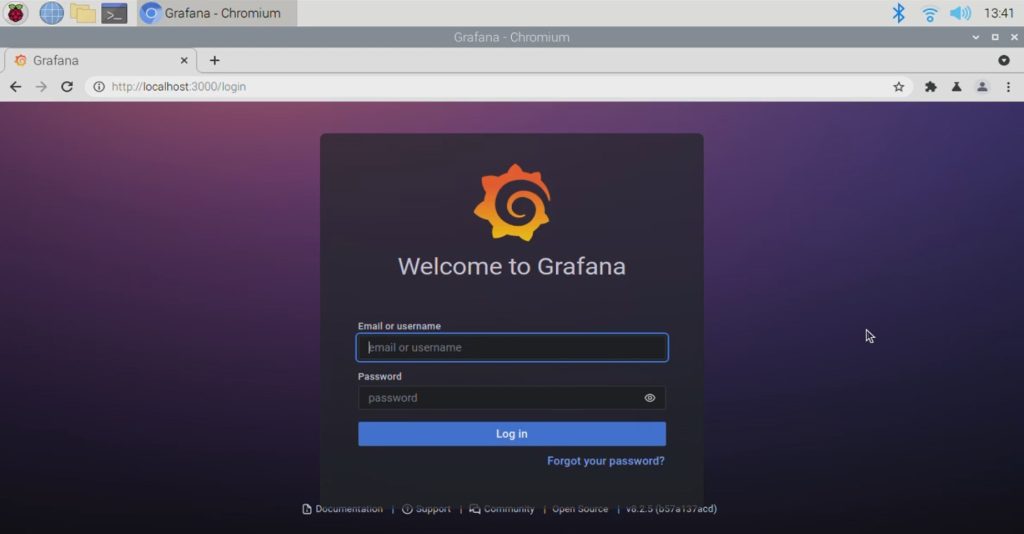
- 步骤 1. 通过在浏览器中打开新标签页访问 Grafana Web 界面,指向 localhost,端口 3000。您可以在 reTerminal 上打开浏览器并输入
http://localhost:3000
然后我们需要配置它从 InfluxDB 读取数据,通过输入服务器和身份验证信息。这些都可以通过您的 InfluxDB Web 界面找到,与您的 ESP32 发布数据的信息非常相似。
- 步骤 2. 点击
Setting按钮并选择Data sources。

- 步骤 3. 在过滤器中输入
InfluxDB并选择InfluxDB。

现在我们已经在 reTerminal 上安装并设置了 Grafana
配置 Grafana 使用 Flux
在您的 InfluxDB 数据源中选择 Flux 作为查询语言后,我们将配置 InfluxDB 连接:
-
步骤 1. 设置 Connection 并点击 Save & Test。相应的信息为:
-
URL:您的 InfluxDB URL。
http://yourip:8086/ -
Organization:您的 InfluxDB 组织名称 或 ID。
-
Token:您的 InfluxDB API 令牌。
-
Default Bucket:在 Flux 查询中使用的默认存储桶。
-
Min time interval:Grafana 最小时间间隔。
-

Grafana 应该连接到 InfluxDB 2.0 数据源并返回测试结果。
- 步骤 2. 在这里添加面板。

- 步骤 3. 返回到
InfluxDB,按照下面的说明操作,然后创建脚本。

- 步骤 4. 复制脚本并将其粘贴到 reTerminal 中。


- 步骤 5. 检查 reTerminal 上的结果,信息应该如下所示。
