Crowd Flow Heatmap with Home Assistant
Want a clear view of how people move through a space? With Home Assistant and a Floorplan Heatmap, you can do just that. This solution lets you overlay person-hour data onto your floor plan, making it easy to see how the space is being used at a glance.
Home Assistant not only collects and manages data from various devices but also seamlessly connects with other platforms through its powerful integration features. By integrating a heatmap plugin, you can directly use existing device data. If your devices are already connected to Home Assistant, you can easily incorporate their data into a visual chart. This simplifies the setup process and maximizes the utility of your existing smart home ecosystem.
A Floorplan Heatmap is a technique that visualizes data on top of a building floor plan or indoor layout. It uses a color scale from cool (like blue, green) to warm (like yellow, red) to show the intensity, density, or frequency of data in specific areas. For example, it can show how frequently a room is occupied or the temperature distribution in a particular area.
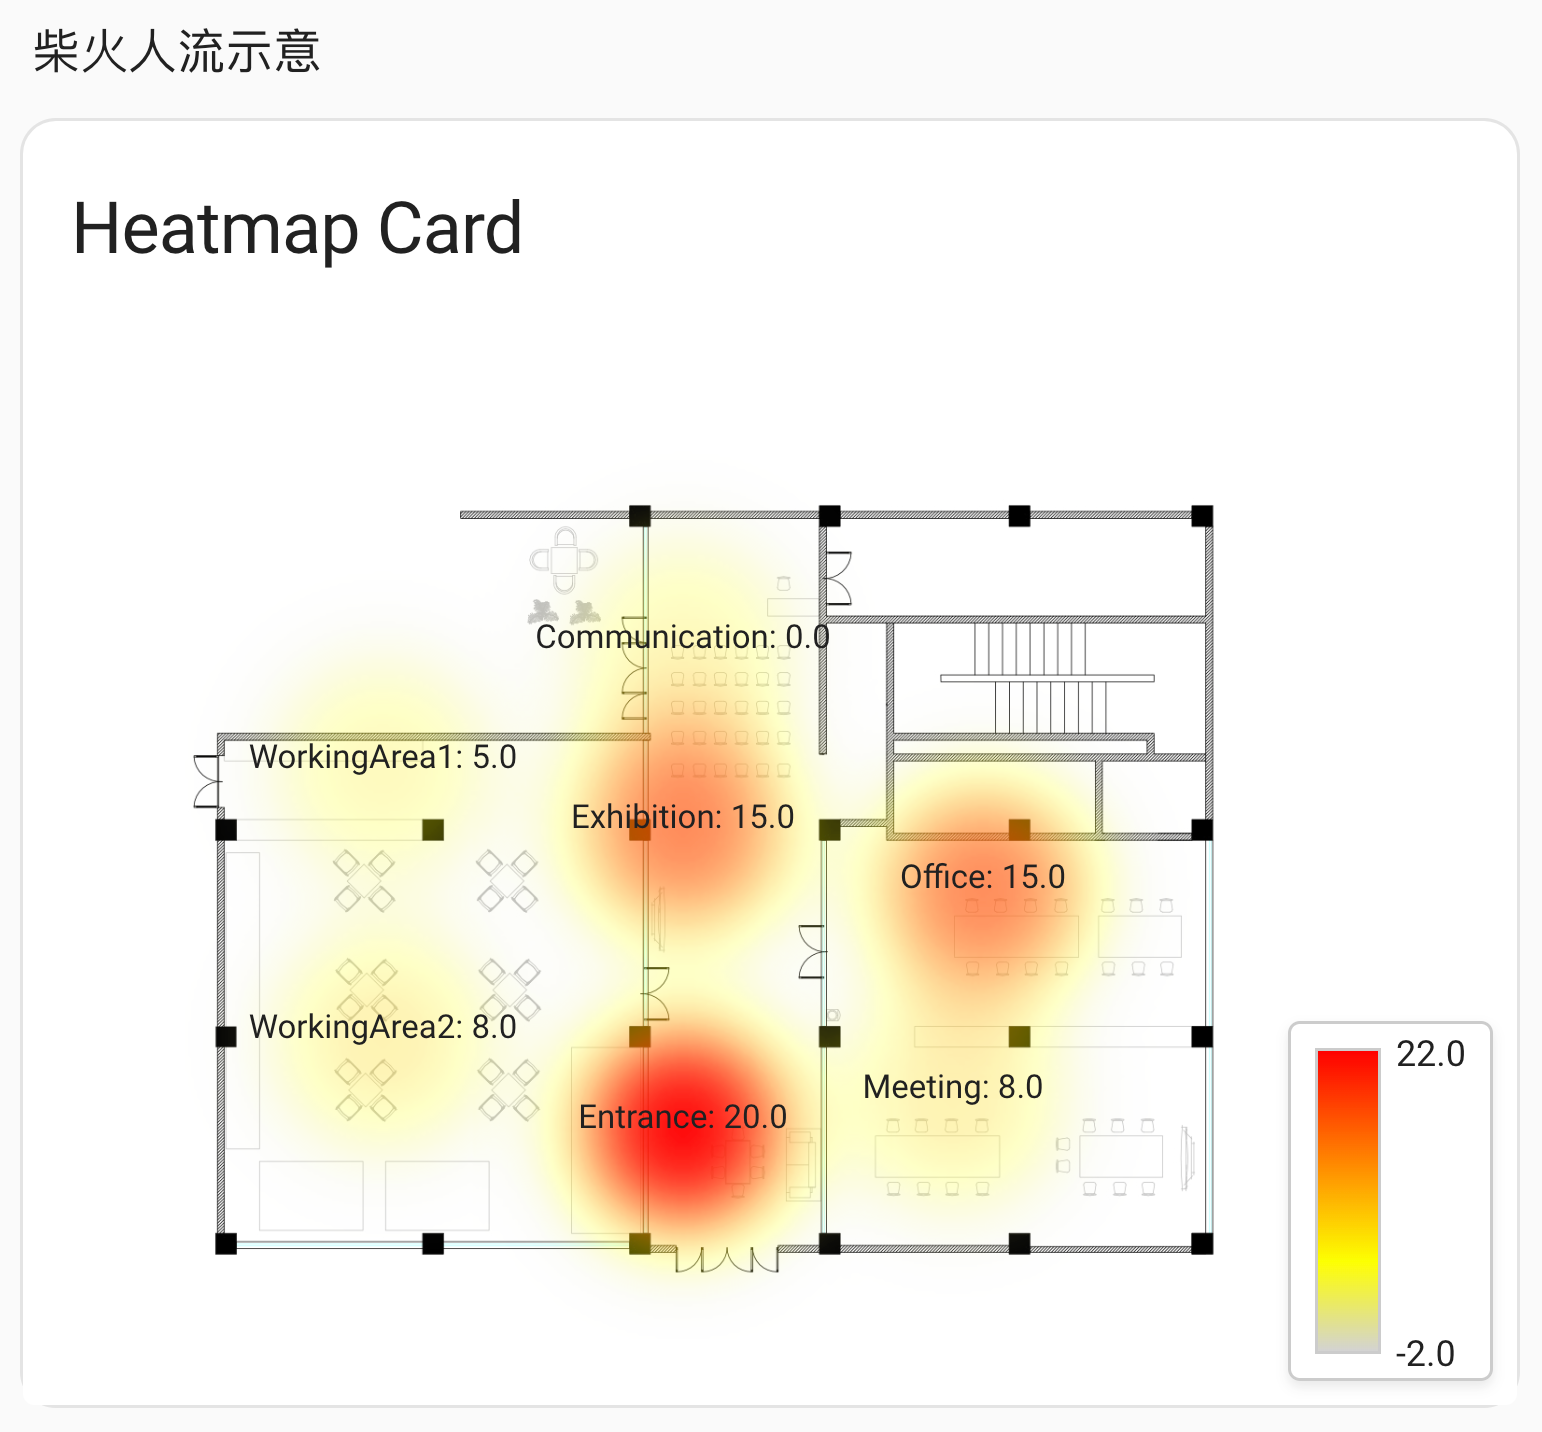
Person-Hour Statistics Example
You will need:
- A Node-RED platform
- A Home Assistant system
- A Grove Vision AI V2 camera kit
Grove Vision AI V2
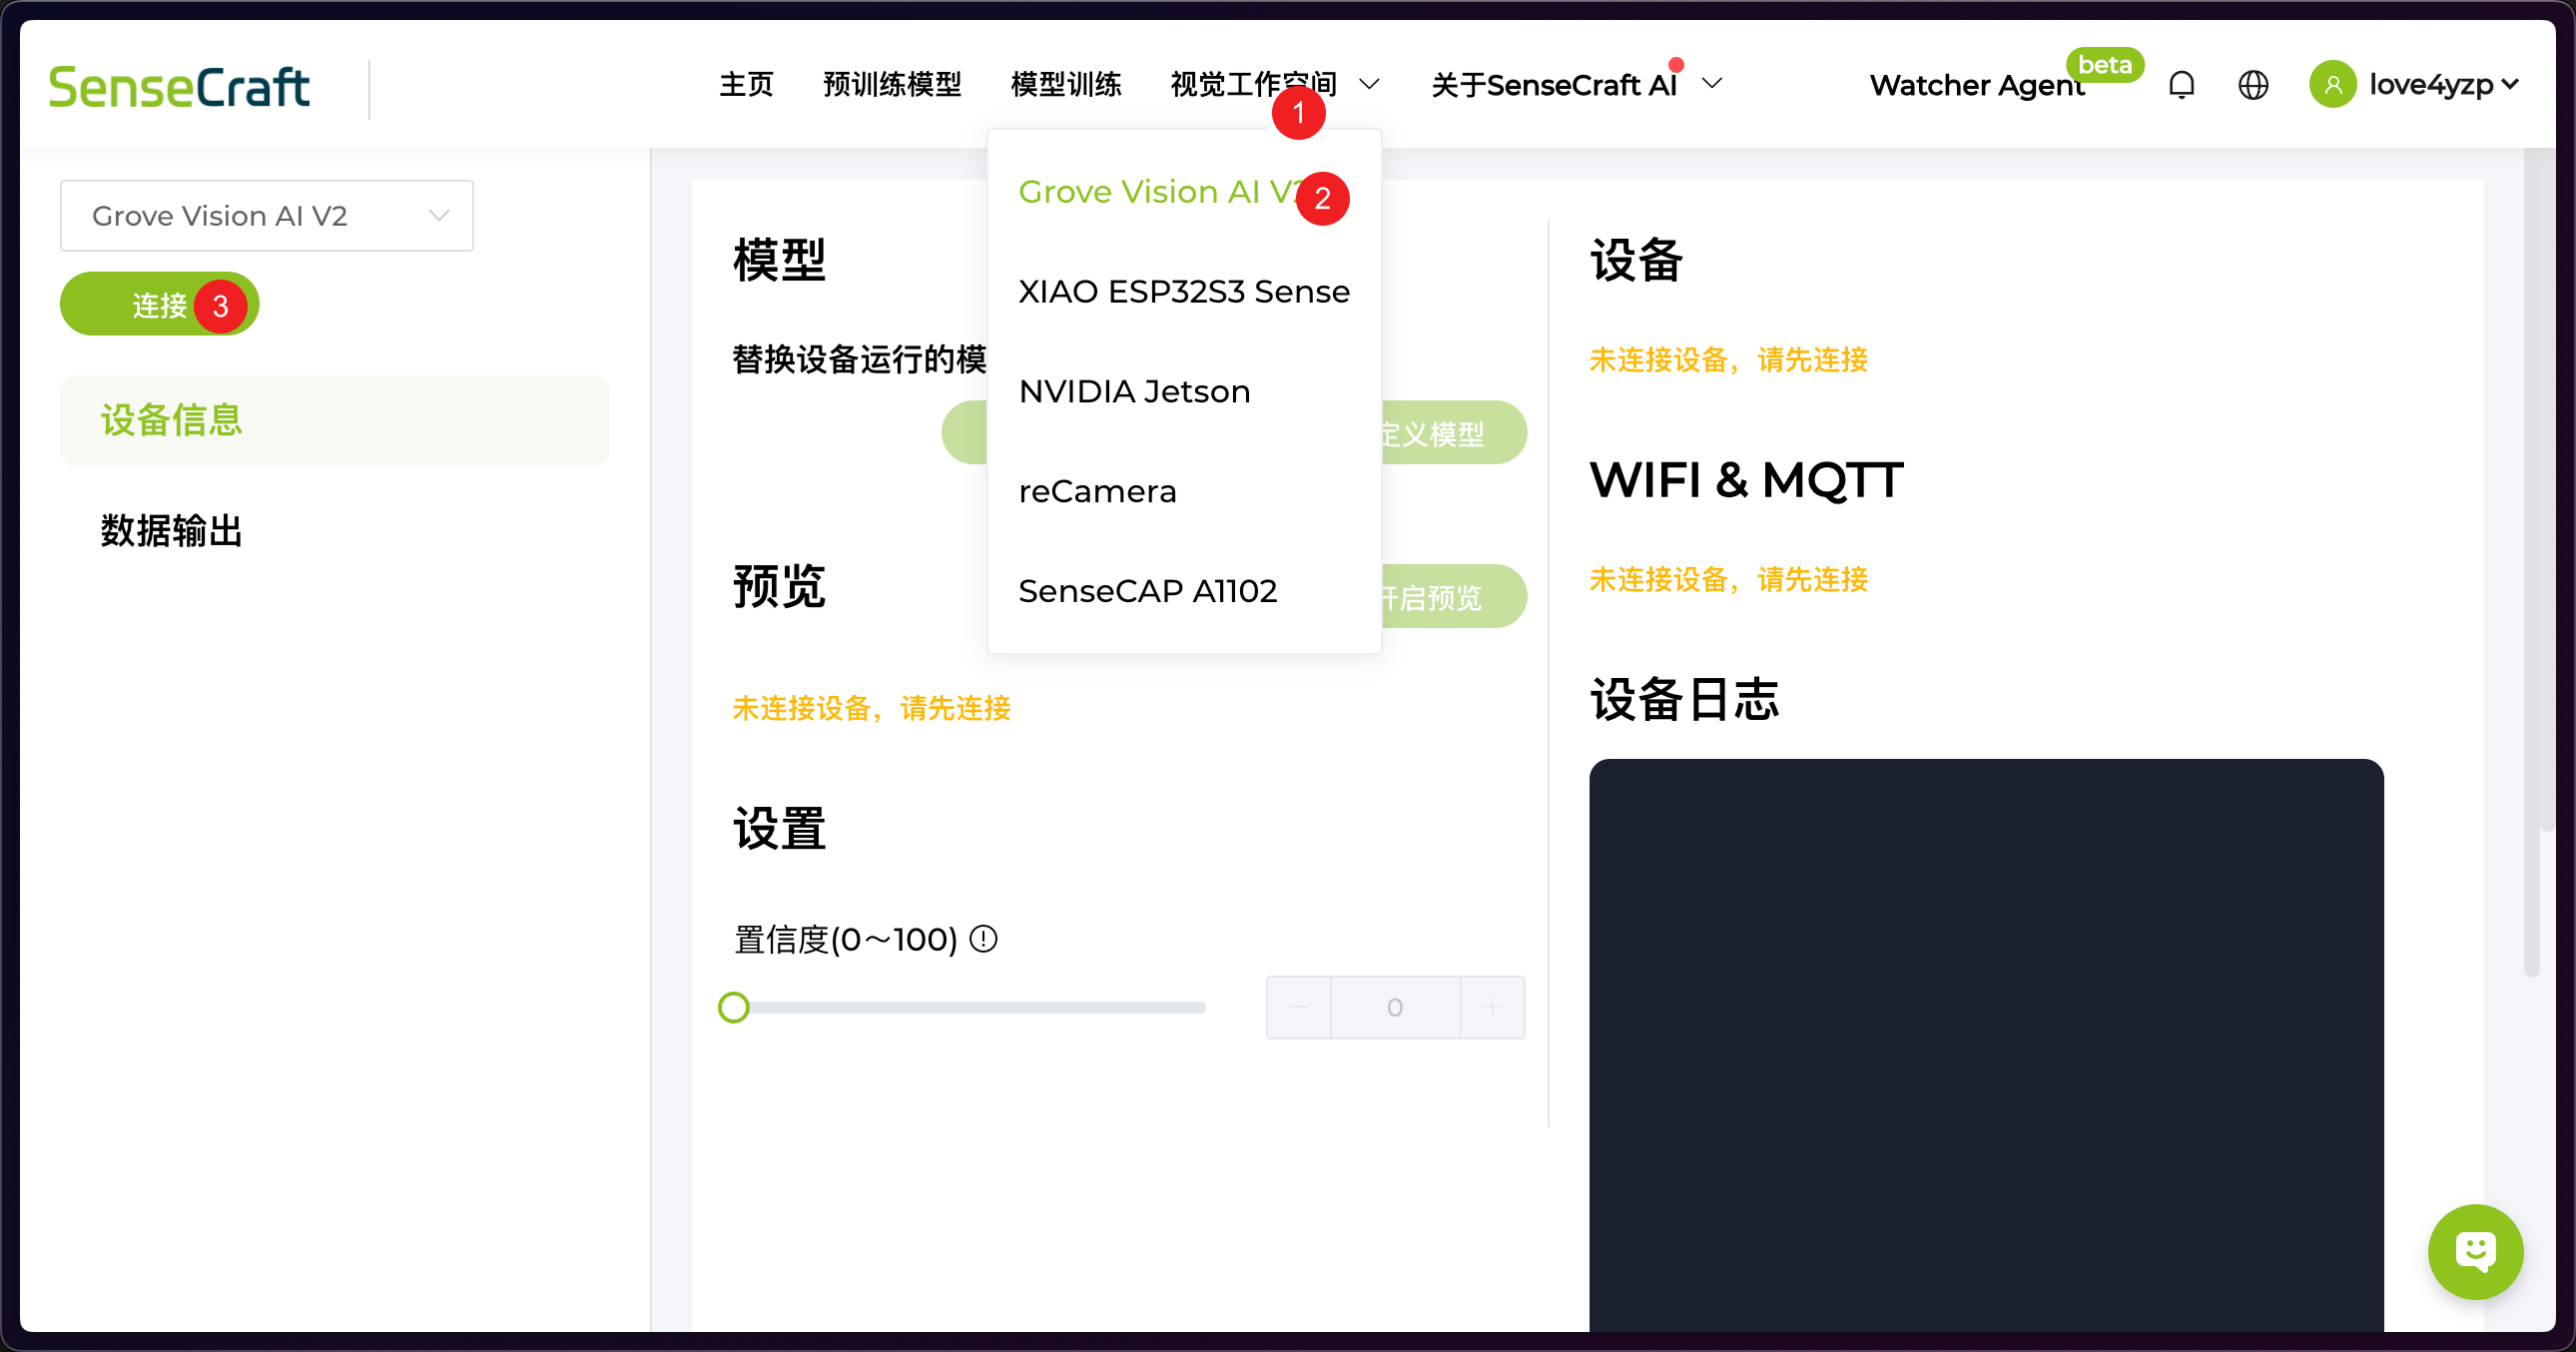
- Go to the SenseCraft AI platform, log in, and under "Vision Workspace," click on "Grove Vision AI V2" and select Connect.
- In the pop-up window, choose the Grove Vision AI V2 device you want to connect.
Flashing the Model
Select an appropriate model. If you are not doing face or person detection, you might need to flash a model that can recognize human features. For example, select Face Detection and confirm to deploy it.
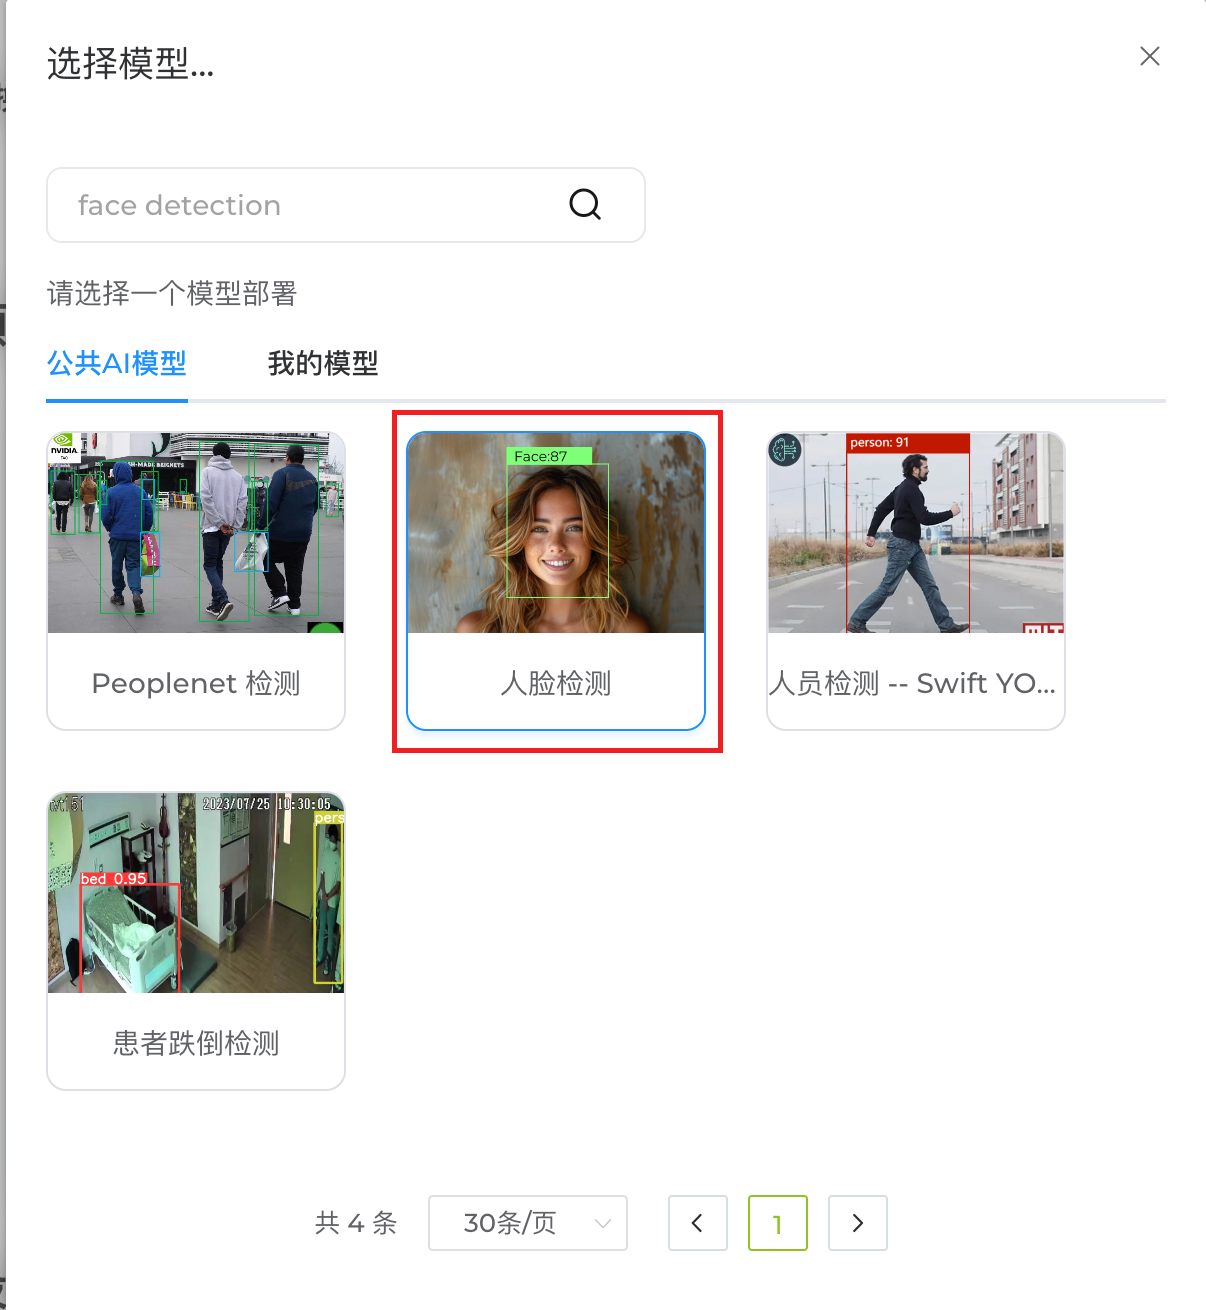
Double-click the model and confirm to flash and deploy it.
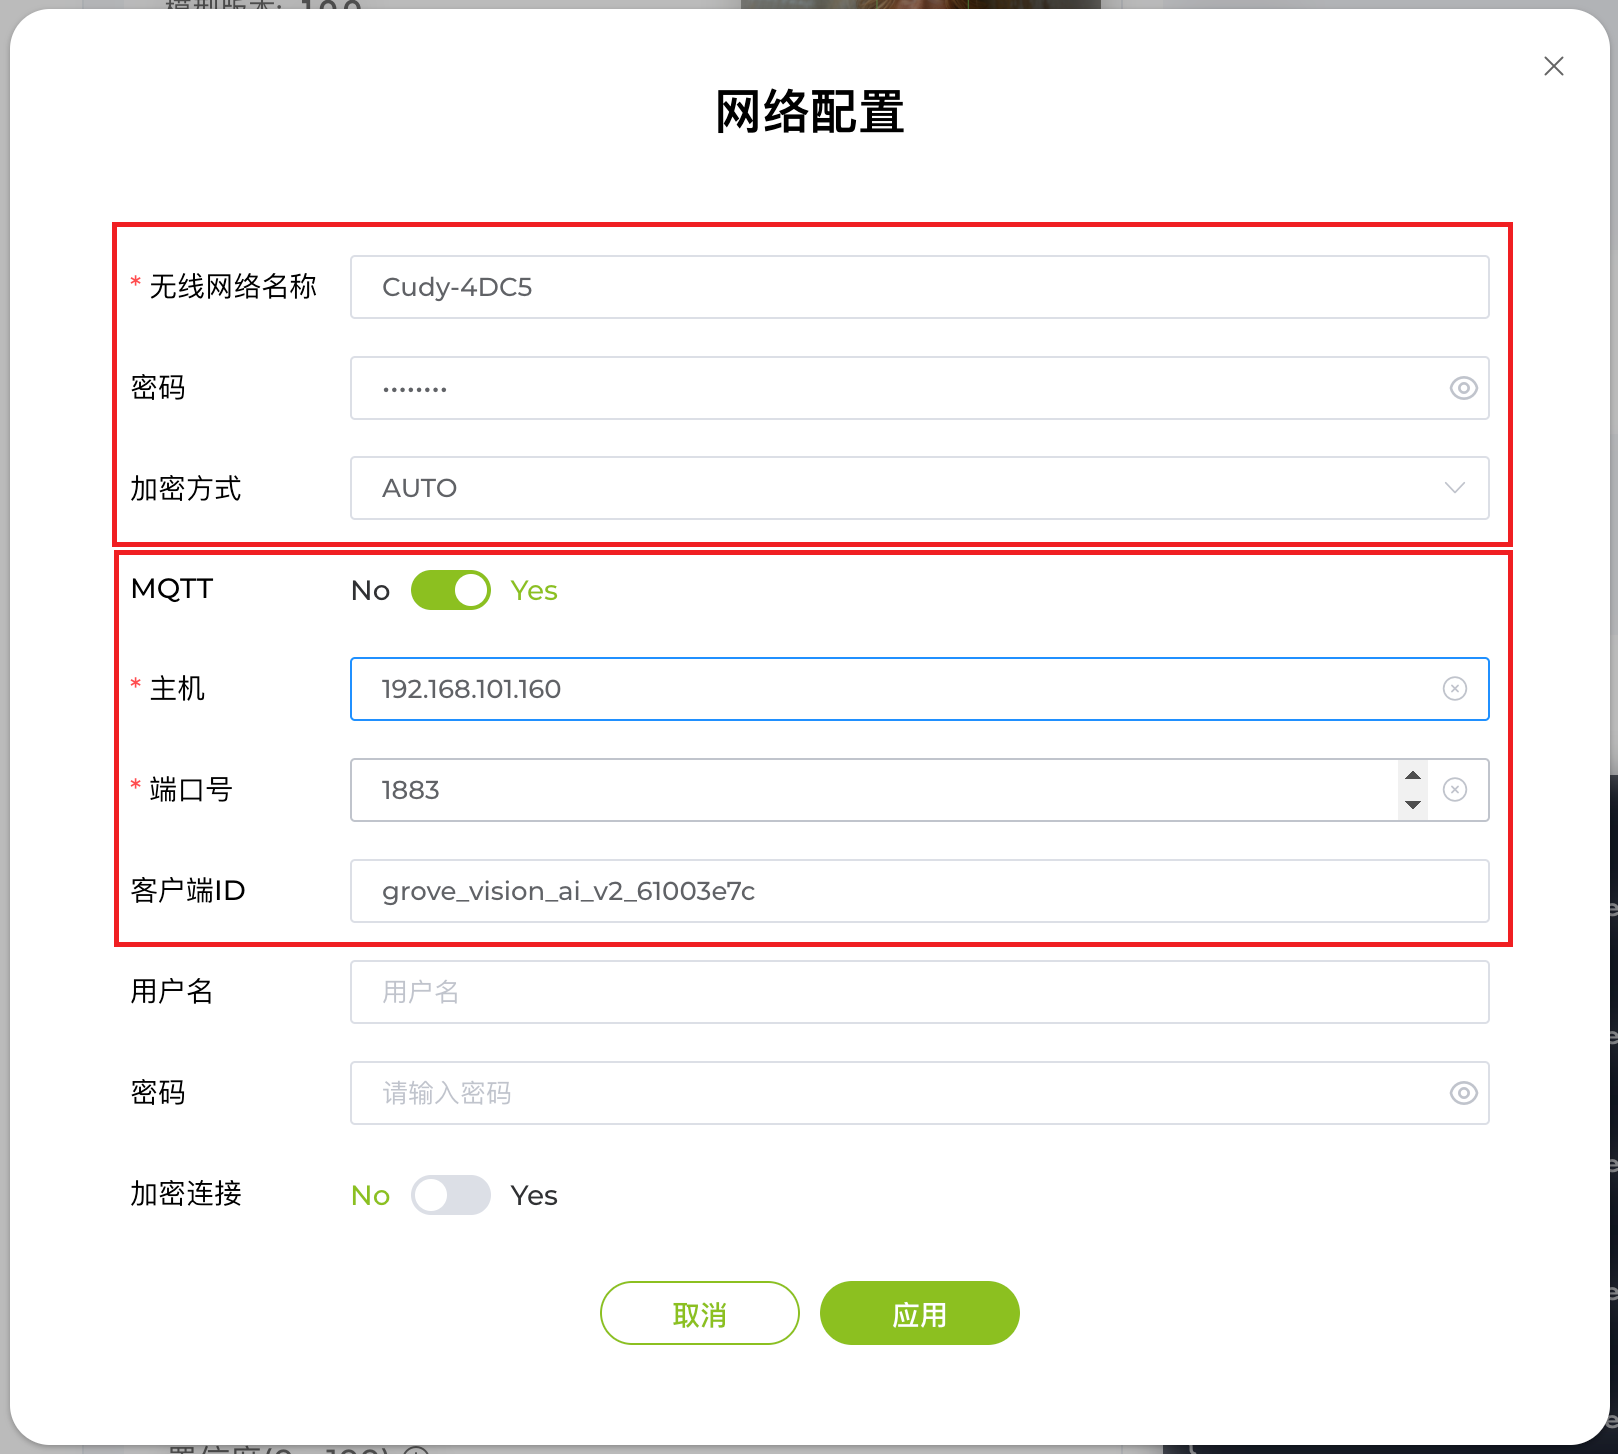
Configure Network Information
- On the main panel, click Network Configuration on the right.
- Enter your Home Assistant's Wi-Fi information and the MQTT server address (usually HA address:1883).
- Click Save.
Be sure to note down the Client ID (you can customize it) for later use.
Node-RED
Since the Grove Vision AI V2 is a non-standard device, we currently need to use Node-RED to handle device registration and data display.
First, you need to import the person-hour-statistics.json file into Node-RED, then continue with the steps below:
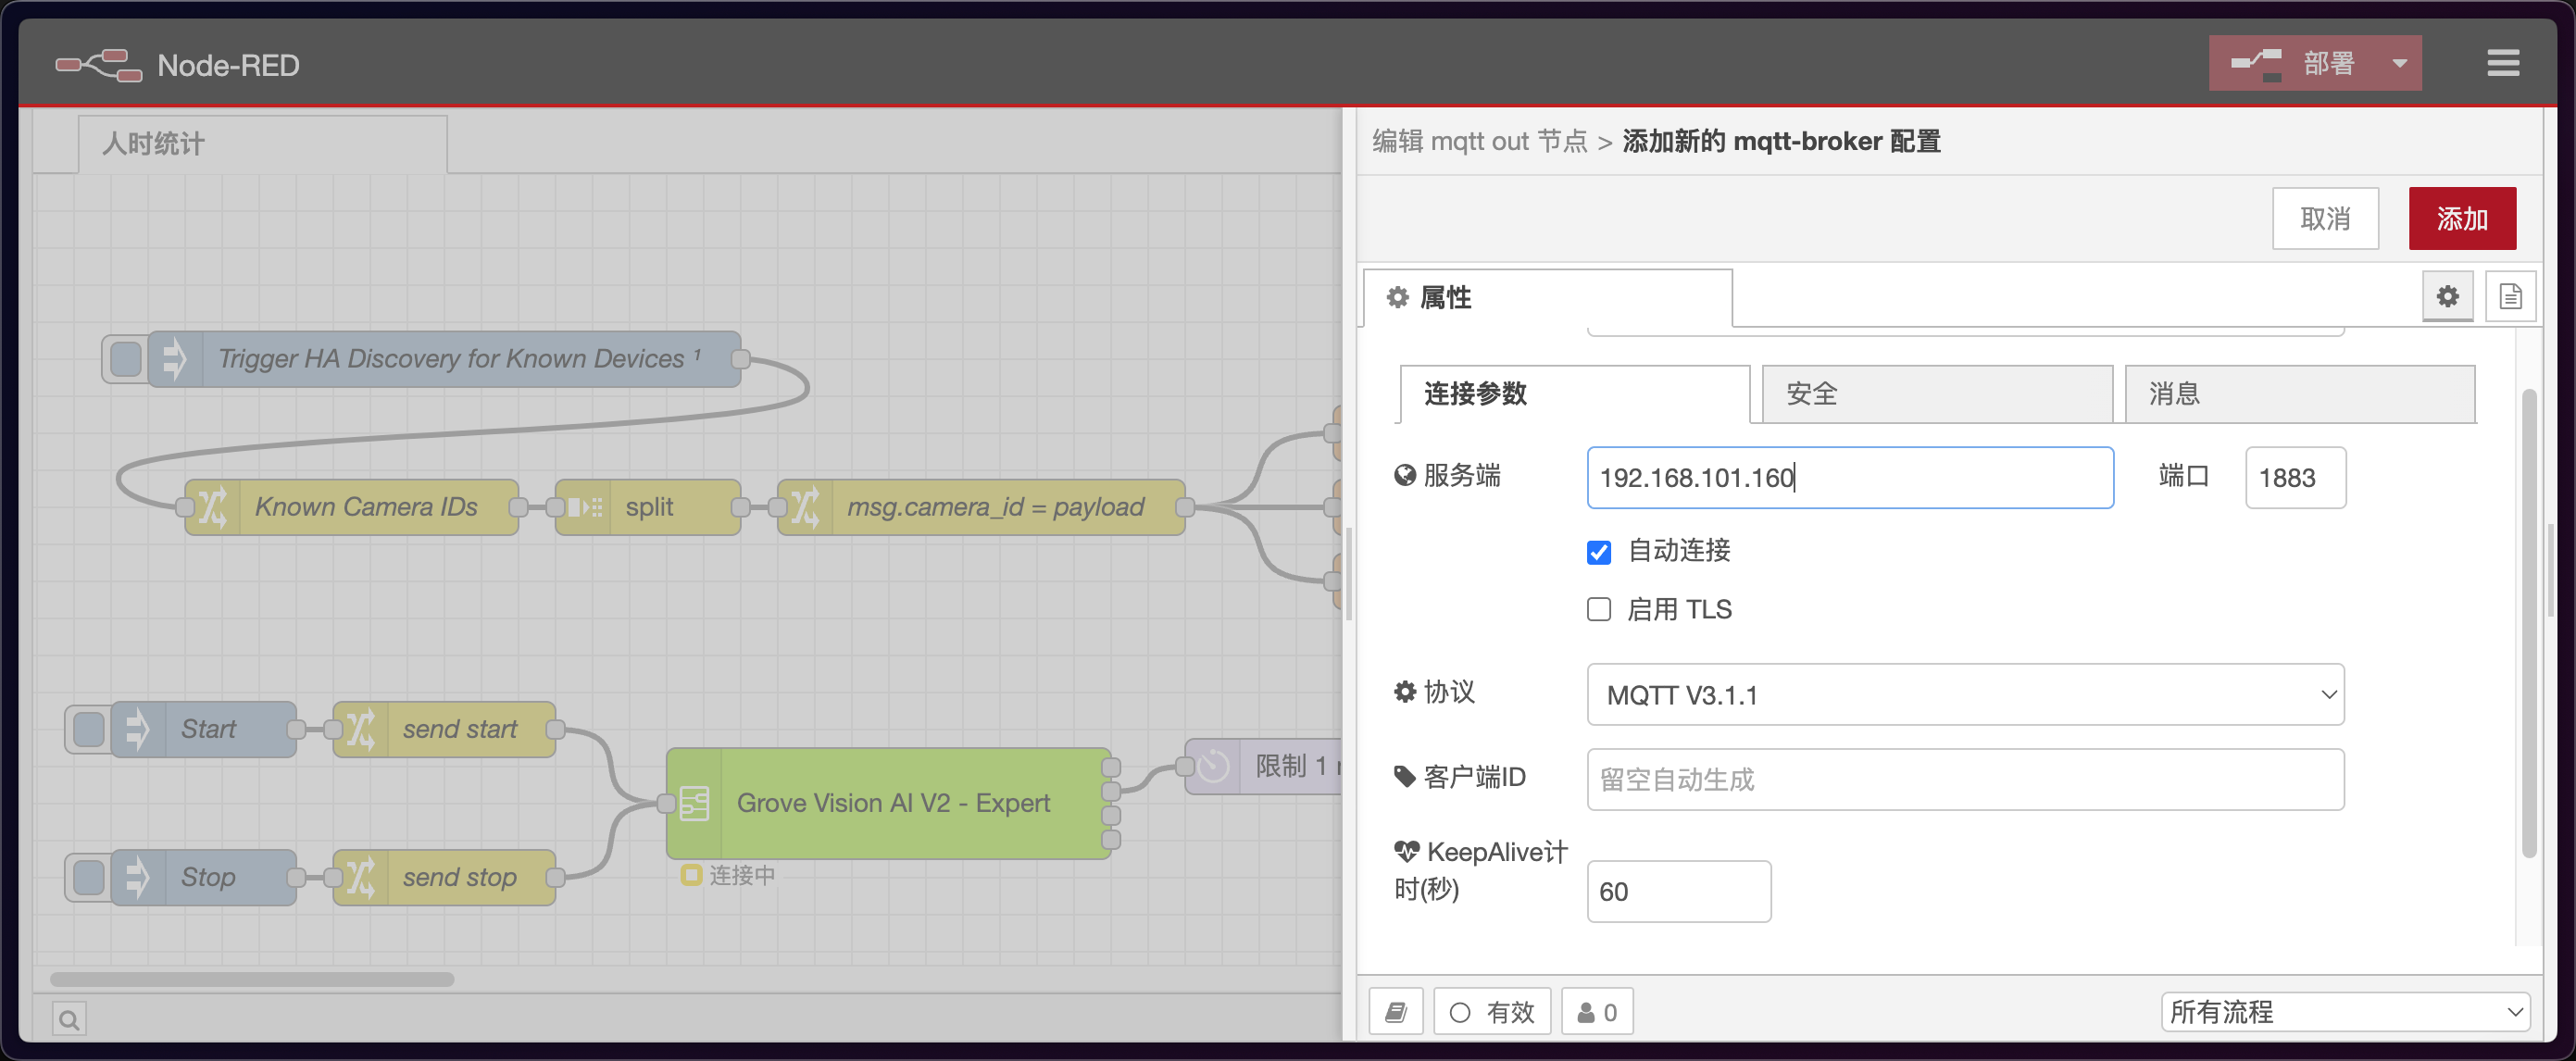
Confirm MQTT Configuration
Modify the service information in the "Publish HA Data & Discovery" node to your Home Assistant address (e.g., 192.168.101.160). If you are using the built-in Node-RED add-on in Home Assistant, connect to mqtt://localhost.
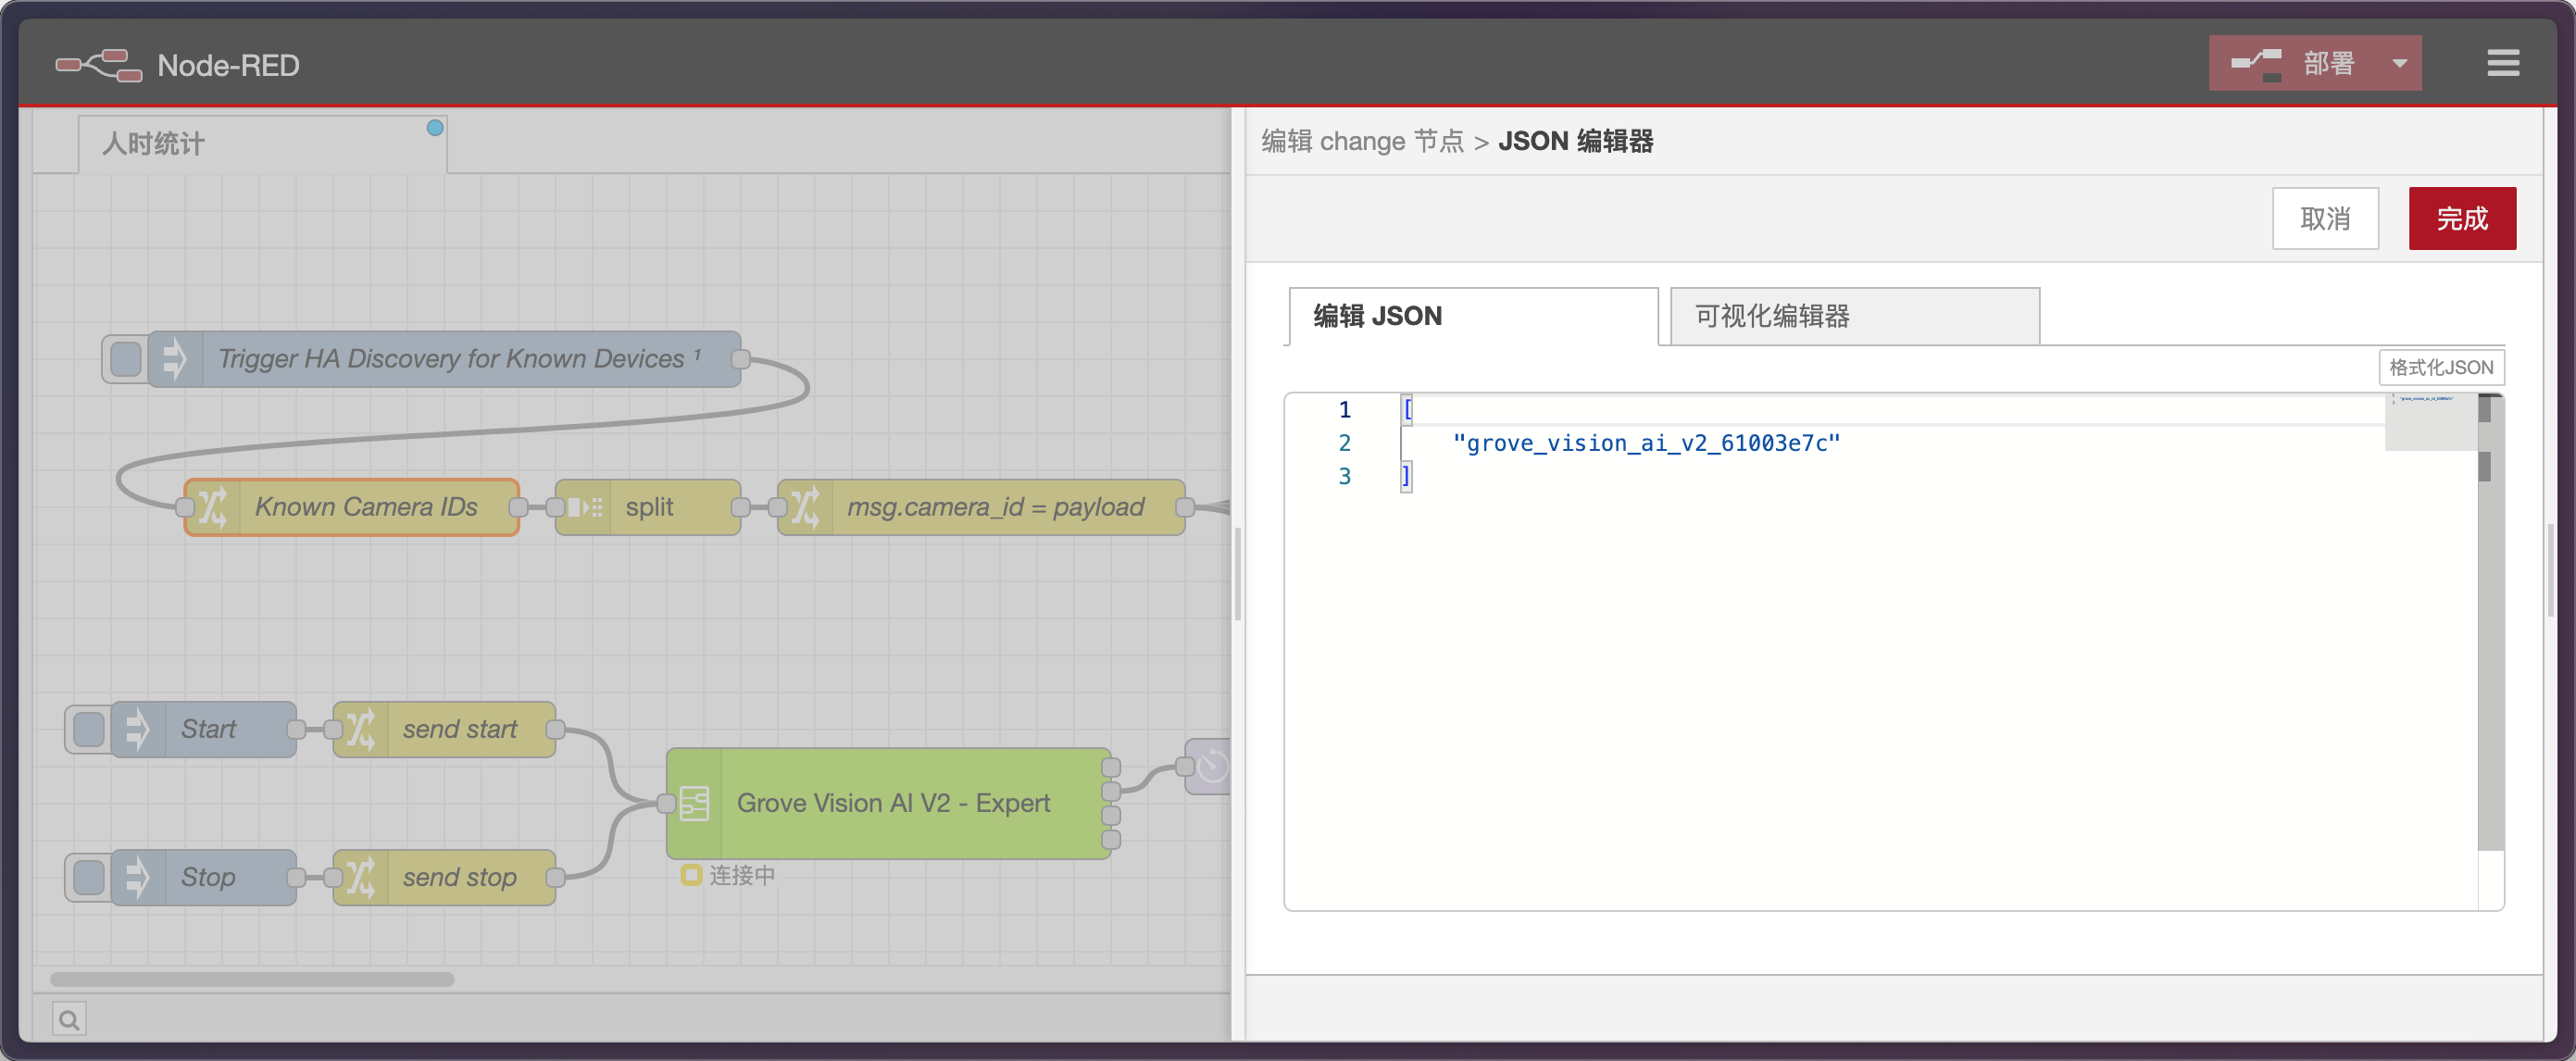
Modify Device ID
In the "Know Camera IDs" node, modify the payload JSON and add multiple client IDs if you have more than one device.
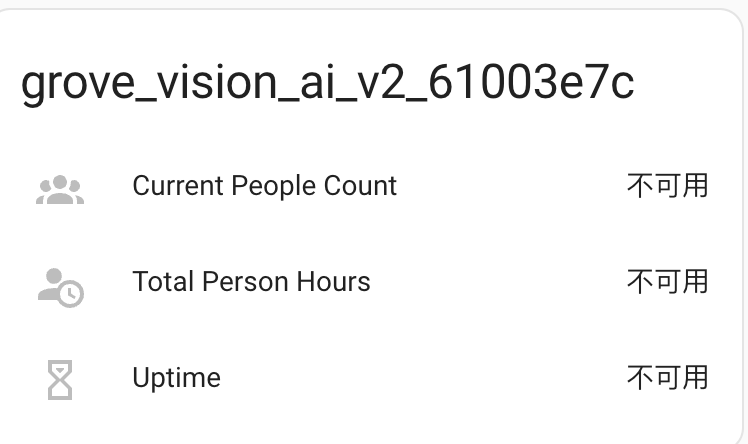
Register Device
Click "Trigger HA Discovery for Known Devices" to register the device. You should then see an unavailable device entity on the overview page.
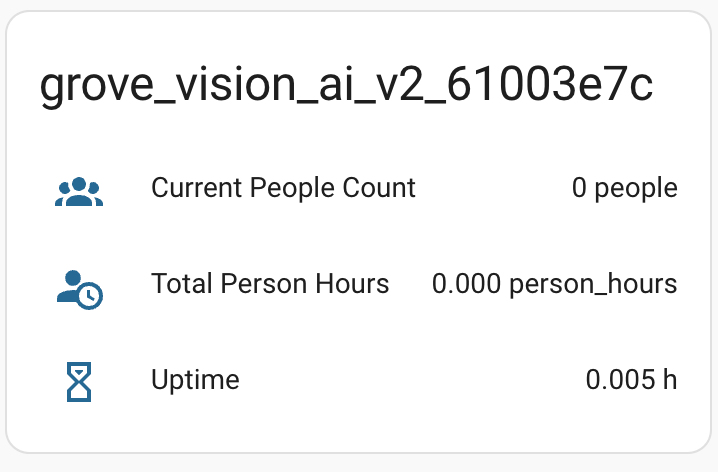
View Data
Set the msg.topic of the "Start" node to grove_vision_ai_v2_61003e7c, then click Start. Once done, you can view the data in Home Assistant.
Home Assistant
Install Plugin (HACS)
Go to your HACS page, for example, http://homeassistant.local:8123/hacs/dashboard:
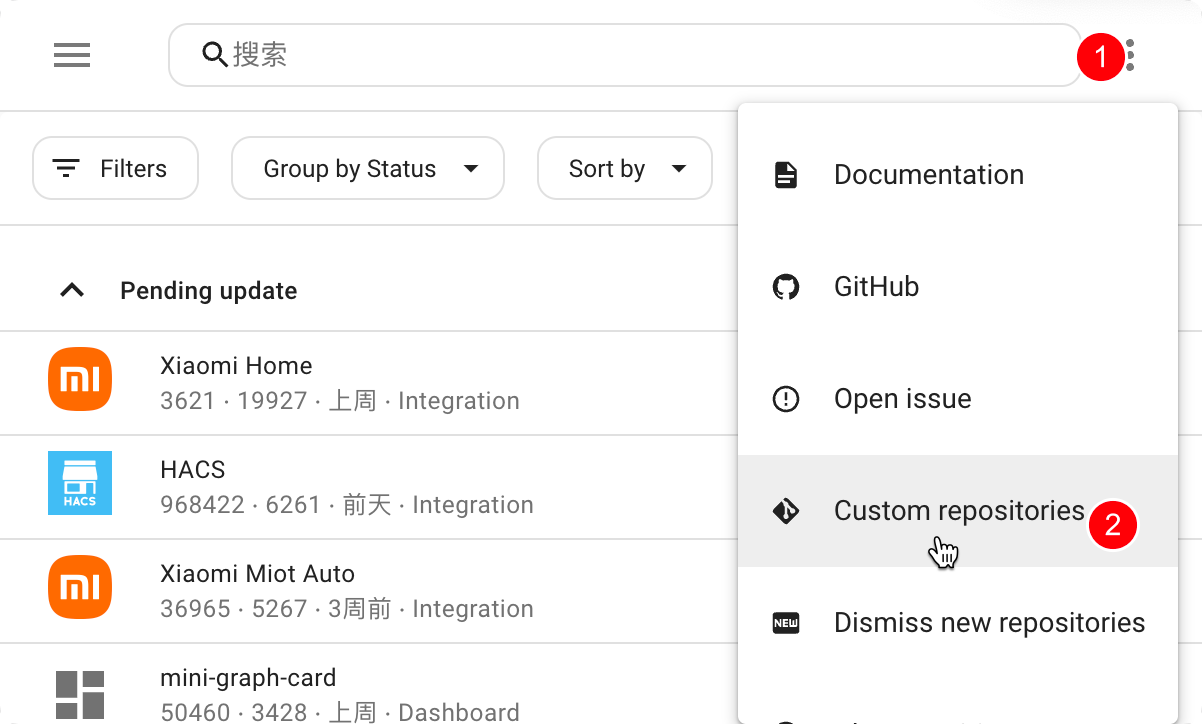
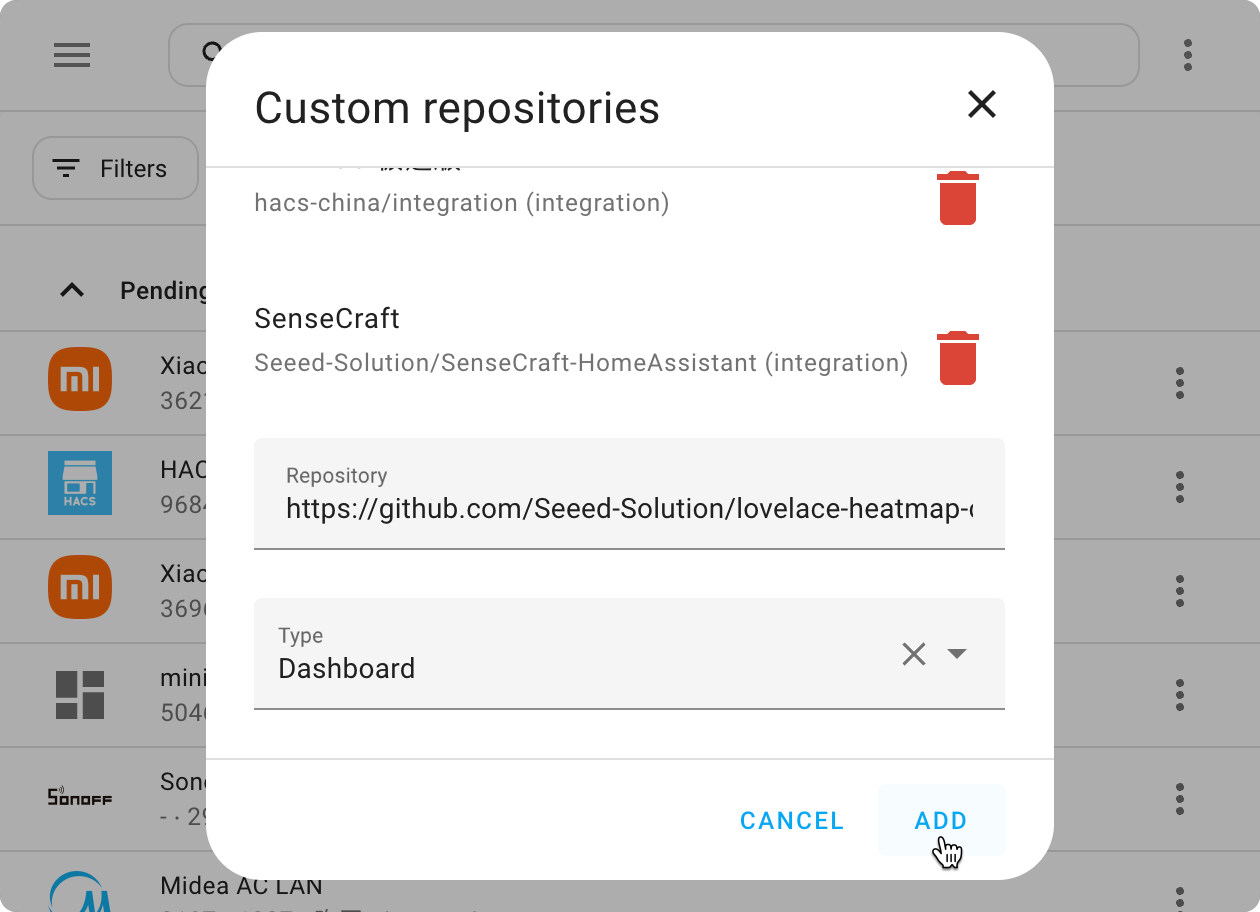
In HACS, add a Custom repository and enter the following address:
https://github.com/Seeed-Solution/lovelace-heatmap-card
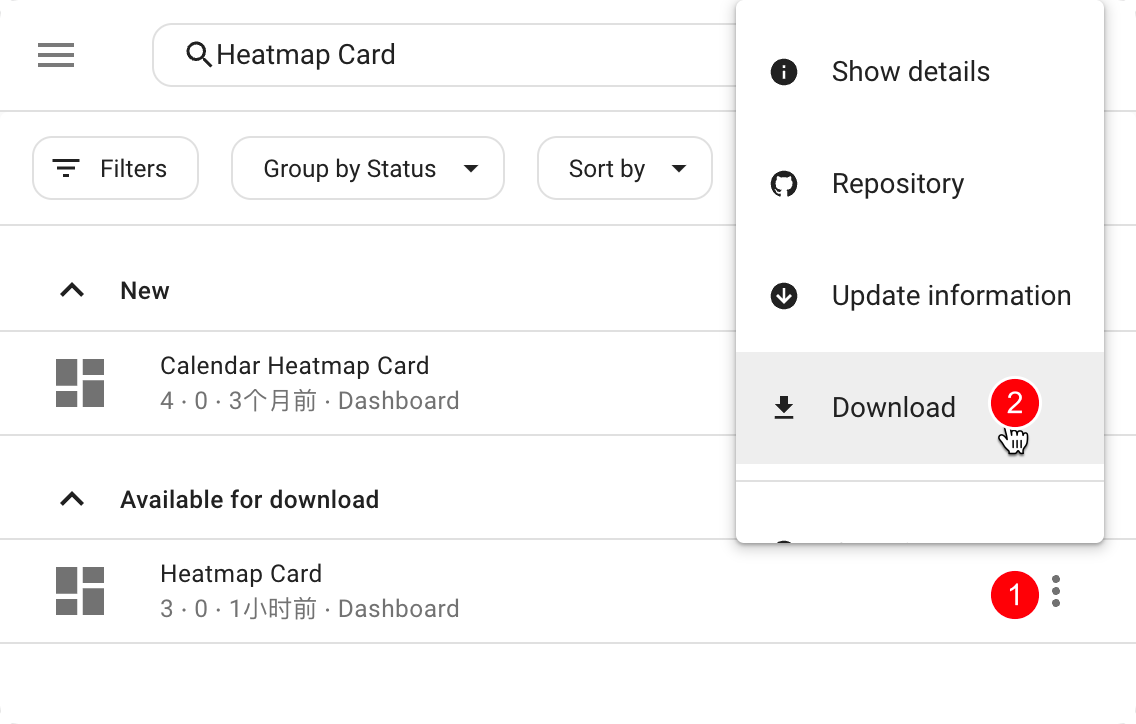
Search for "Heatmap Card" and download the plugin:
After installation, you will need to reload your browser. Click RELOAD in the prompt.
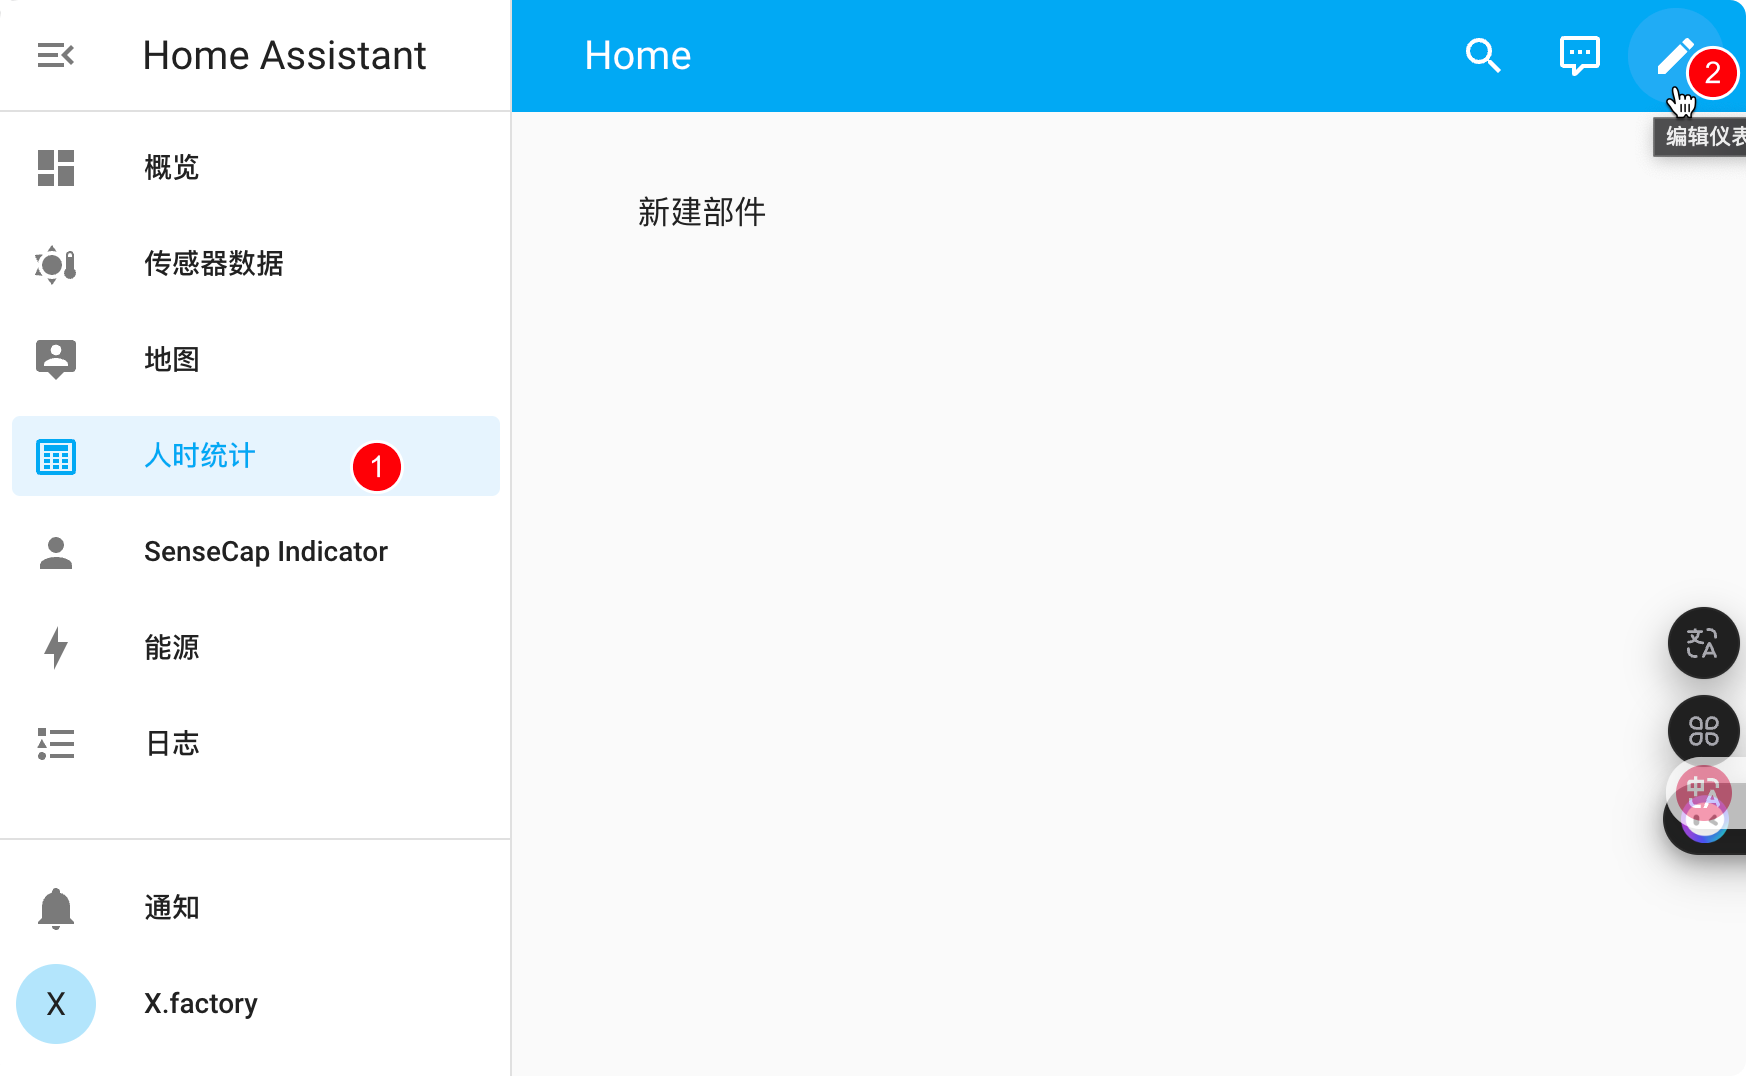
Add Card to Dashboard
In any dashboard, add your heatmap card. For example, let's edit a dashboard named Person-Hour Statistics.
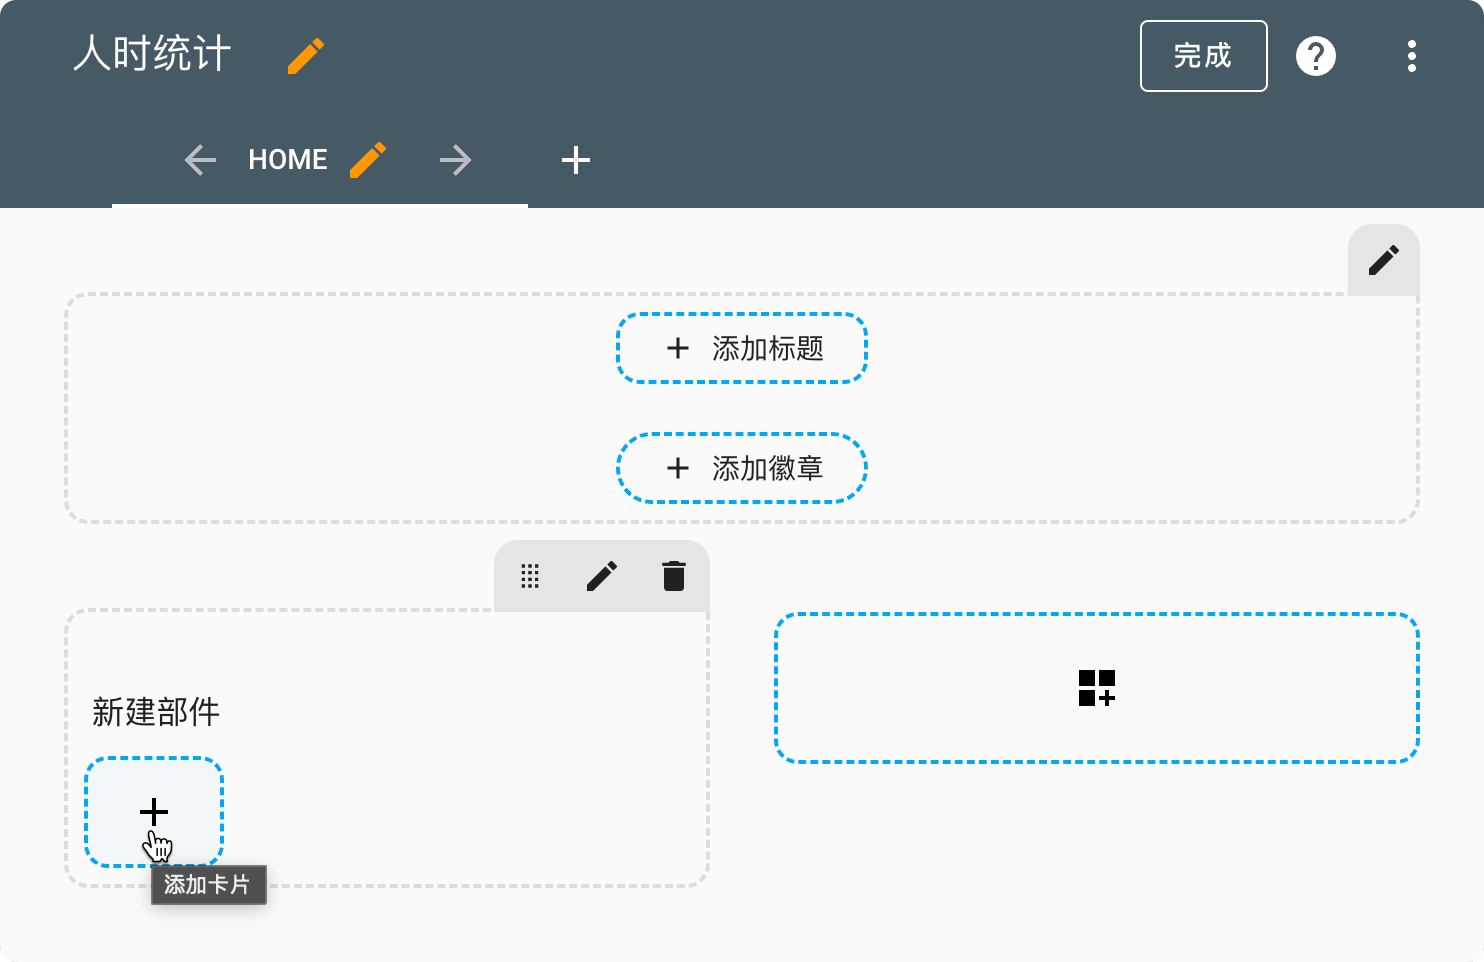
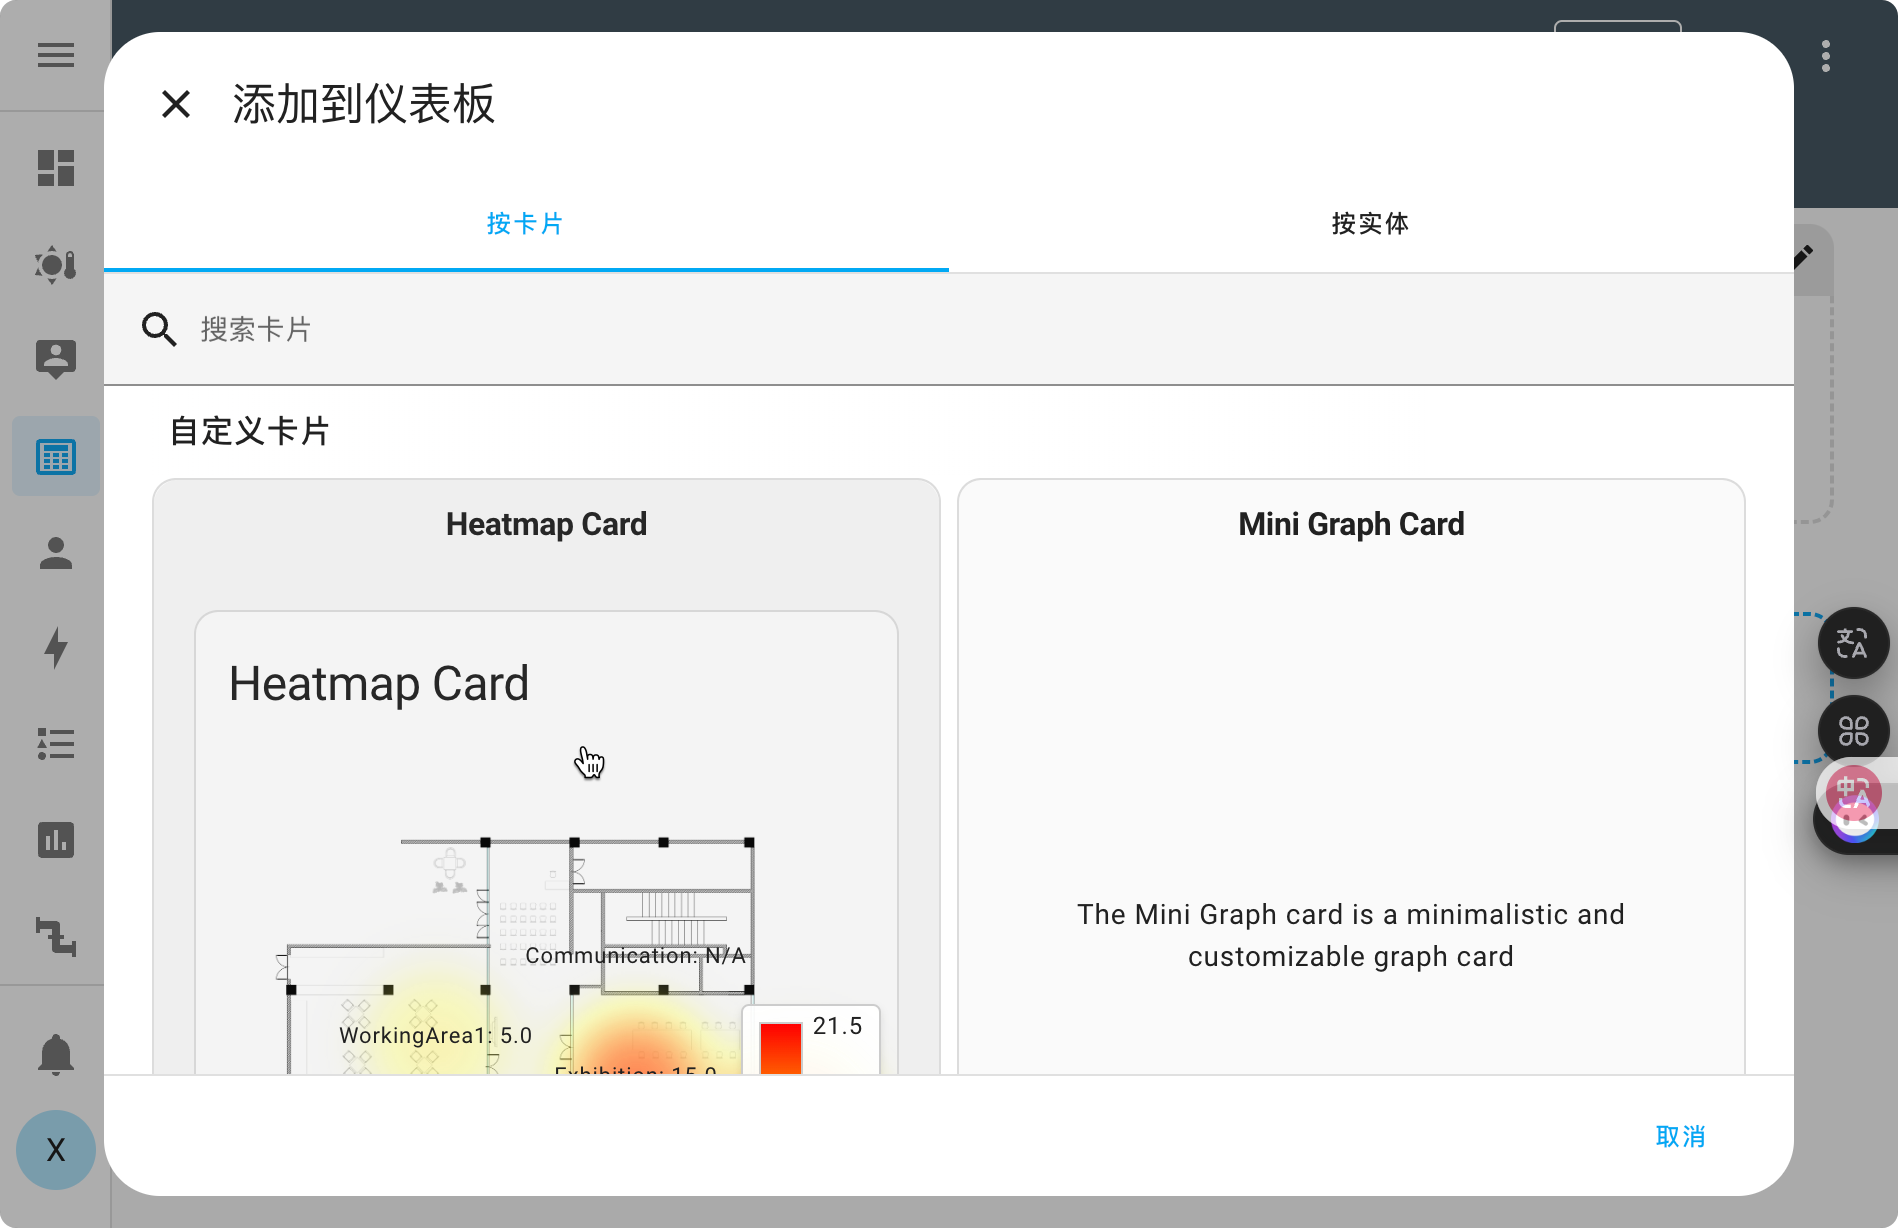
Click "Add Card," scroll down to the custom cards section, find Heatmap Card, and click to add it.
Connect Data
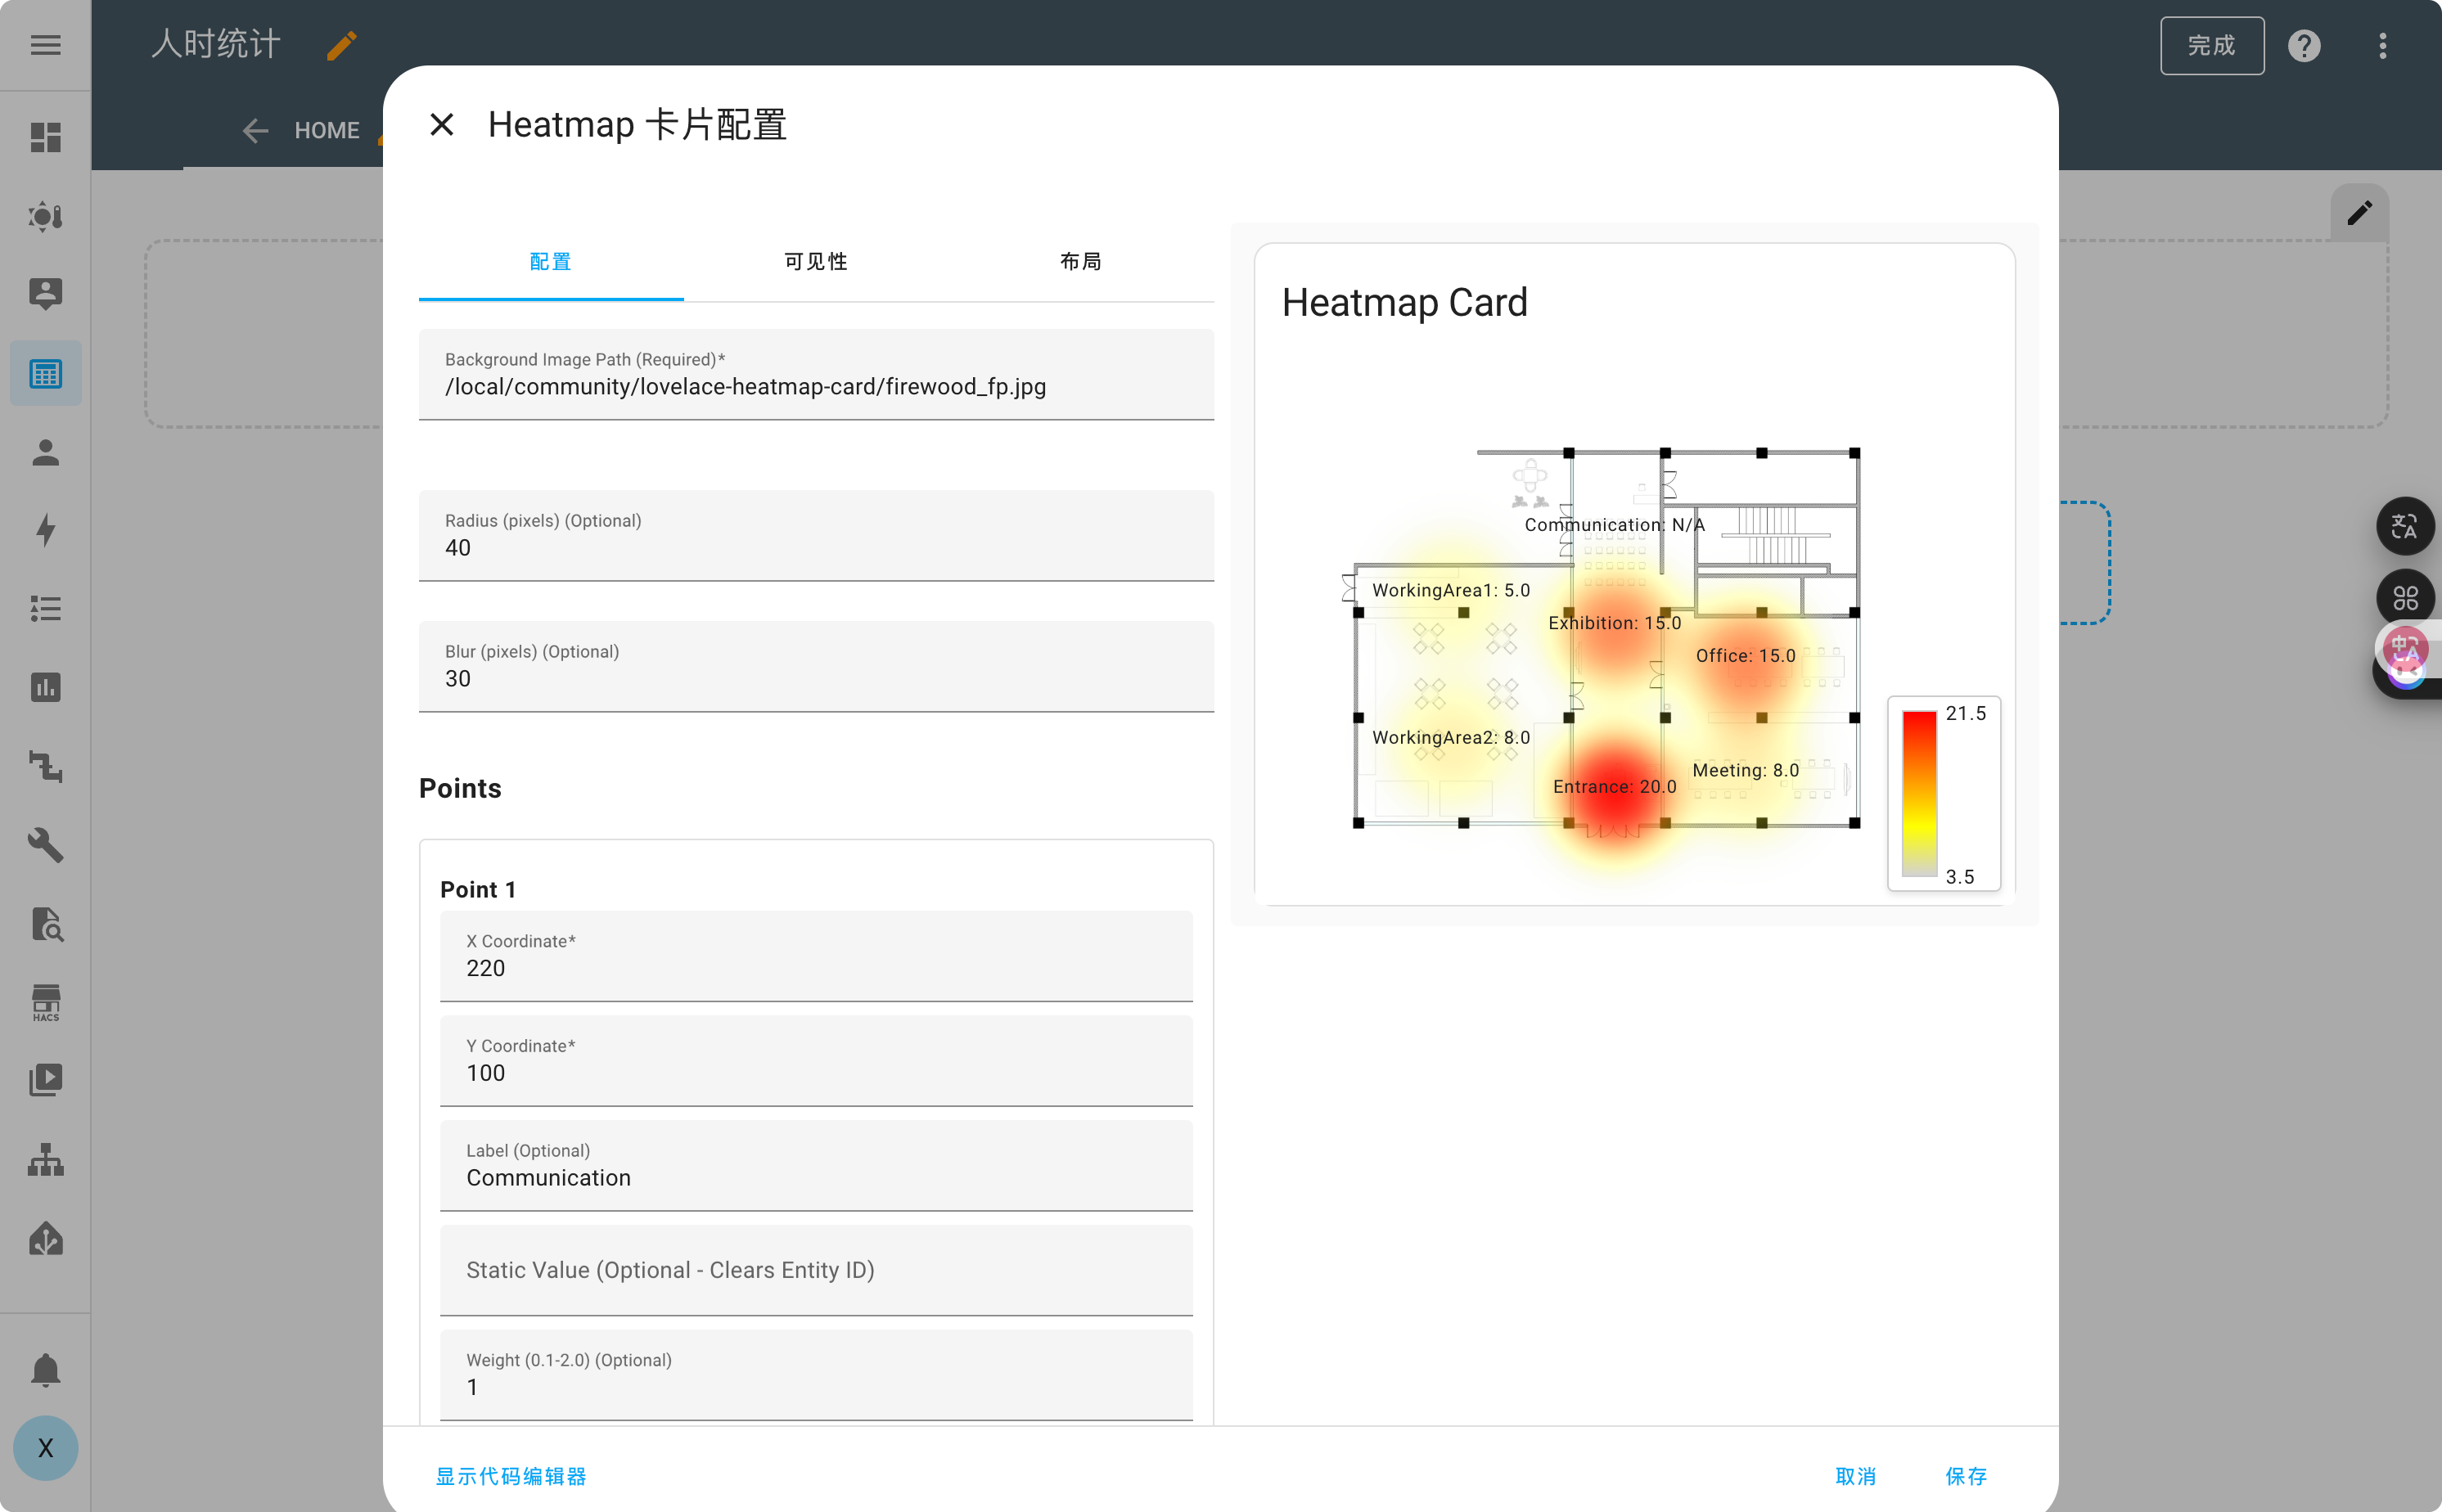
The plugin has four configuration sections:
- Color Style (Radius, Blur)
- Points - Coordinates and information for different points
- Display Options - Show data legend
- Show Point Labels - Show labels for each point
In the card configuration, set the entity_id for one of the Points to your device entity ID (e.g., sensor.grove_vision_ai_v2_61003e7c_current_people_count).
Once done, click Save.
After completing these steps, you will be able to see the heatmap data dynamically displayed in Home Assistant.