Edge Box RPi 200 with Grafana
Introduction
Grafana is an open-source visualization and analytics software that enables you to query, visualize, alert on, and explore your metrics, logs, and traces from any storage location. It offers tools to transform your time-series database (TSDB) data into insightful graphs and visualizations. As a powerful monitoring solution, Grafana helps in making informed decisions, enhancing system performance, and streamlining troubleshooting. In this wiki, we will guide you through the installation of Grafana on a Raspberry Pi-powered EdgeBox RPi 200, connect it to an existing InfluxDB database, and create an illustrative dashboard.
Hardware Preparation
| Edge Box RPi 200 |
|---|
 |
Software Preparation
It is recommended to refer to a previous tutorial on How to create the InfluxDB database. In this tutorial, we will use an existing InfluxDB connection for the setup.
Adding Grafana Repository
Ensure all currently installed packages on your Raspberry Pi are up to date:
sudo apt update
Add the Grafana APT Key:
To add the Grafana APT key to your Raspberry Pi’s keychain, run the following command:
curl https://apt.grafana.com/gpg.key | gpg --dearmor | sudo tee /usr/share/keyrings/grafana-archive-keyrings.gpg >/dev/null
Add the Grafana Repository:
Use the following command on your Raspberry Pi to add the Grafana repository to the list:
echo "deb [signed-by=/usr/share/keyrings/grafana-archive-keyrings.gpg] https://apt.grafana.com stable main" | sudo tee /etc/apt/sources.list.d/grafana.list
Update Package List:
As we have made changes to our package list, we need to run an update:
sudo apt update
Installing Grafana on EdgeBox
Install the latest version of Grafana by running the following command:
sudo apt install grafana
Configuring Grafana to Start at Boot
Enable Grafana to start at boot:
sudo systemctl enable grafana-server
Starting Grafana
Start the Grafana server software by running the command below:
sudo systemctl start grafana-server
Accessing Grafana
To access the Grafana web interface, open a web browser and navigate to:
http://<IPADDRESS>:3000
Replace <IPADDRESS> with the IP address of your EdgeBox RPi 200.
Logging In

The default username and password are:
- Username:
admin - Password:
admin
Once you have logged in, you will be prompted to change the default password.

Create Your First Dashboard
Navigate to Dashboards:
Click on Dashboards in the left-side menu.

Create a New Dashboard:
On the Dashboards page, click New and select New Dashboard.

Add a Visualization:
On the dashboard, click + Add visualization.

Select Data Source:
You will be redirected to select a data source. In the last tutorial, we created an InfluxDB database. Click on Configure a new data source.

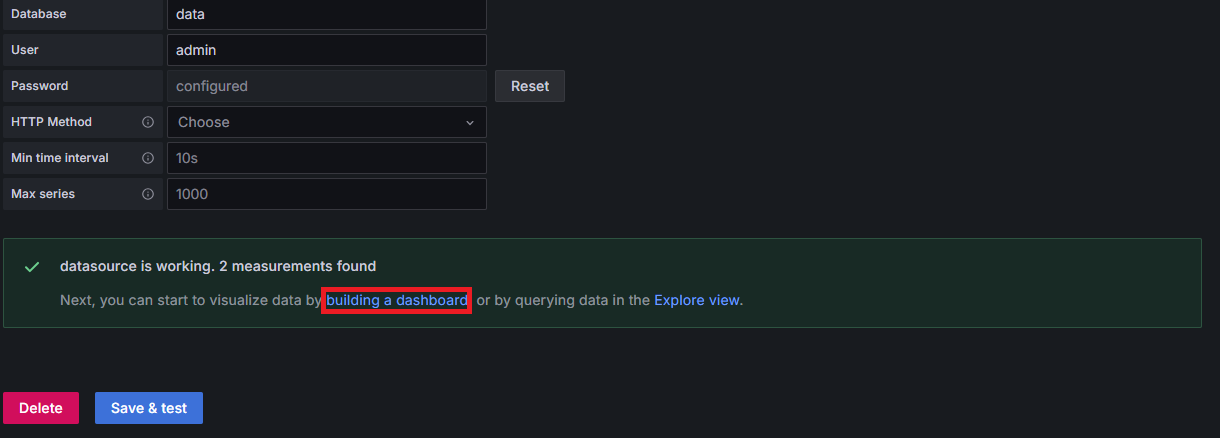
Configure InfluxDB:
- Select InfluxDB under time series databases.

- Provide the URL, database name, and user privileges.

- Click Save & Test. If there are no warnings, you are good to go.

Build Your Dashboard:
You will see a message confirming the data source configuration. Click on Building a dashboard.
Add Visualization:
You will be redirected to the new dashboard page. Click on Add visualization.
Select Data Source:
You will be redirected to select a data source. we created an InfluxDB database connection. Click on InfluxDB.

Configure Visualization
Grafana provides a user-friendly interface to select measurements, fields, and other relevant data points. We will create a time series visualization. On the left-hand side, you will see options to enter the Panel title, Legends, Axis settings, and Graph settings. Pay attention to the following visual elements to add a simple graph to your first dashboard. For more detailed settings and customization, refer to the Grafana documentation.
Tech Support & Product Discussion
Thank you for choosing our products! We are here to provide you with different support to ensure that your experience with our products is as smooth as possible. We offer several communication channels to cater to different preferences and needs.