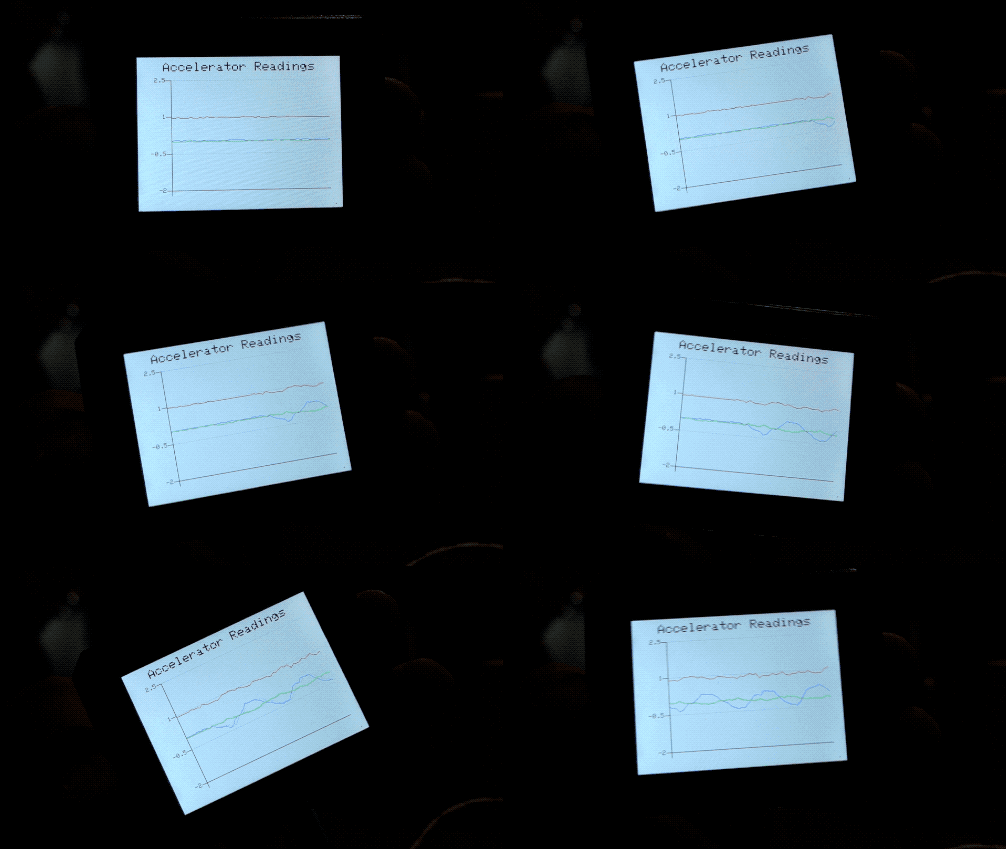
Wio Terminal Mostrando Lecturas del Acelerómetro

Descripción General
Este ejemplo demuestra cómo dibujar gráficos de líneas en Wio Terminal. En este ejemplo, las lecturas del acelerómetro de 3 ejes (3 conjuntos de datos) se trazan en un gráfico de líneas para mostrar el posicionamiento en tiempo real del Wio Terminal.
Características
-
Lecturas del acelerómetro de 3 ejes mostradas en un gráfico de líneas
-
Posicionamiento en tiempo real del Wio Terminal
Librerías de Arduino necesarias
-
Visita Seeed_Arduino_Linechart y descarga todo el repositorio a tu unidad local.
-
Instala la librería del acelerómetro integrado
Seeed_Arduino_LIS3DHTR, Por favor visita Seeed_Arduino_LIS3DHTR para más información.
Instrucciones de Arduino
-
Descarga el archivo
AcceratorReadings.inoy súbelo a tu Wio Terminal a través delArduino IDE. Asegúrate de haber instalado todas las librerías. -
Mueve el Wio Terminal en diferentes ejes y observa lo que muestra, ¡también puedes abrir el
Serial Plotterpara verificar el efecto!
Código
- Para inicializar LCD y Acelerómetro
#include"LIS3DHTR.h" //include the accelerator library
#include"seeed_line_chart.h" //include the line chart library

TFT_eSPI tft;
LIS3DHTR<TwoWire>  lis;

#define MAX_SIZE 50 //maximum size of data
doubles accelerator_readings[3];
TFT_eSprite spr = TFT_eSprite(&tft);  // Sprite

void setup() {
    tft.begin();
    tft.setRotation(3);
    spr.createSprite(TFT_HEIGHT,TFT_WIDTH);
    spr.setRotation(3);

    lis.begin(Wire1);
    lis.setOutputDataRate(LIS3DHTR_DATARATE_25HZ);
    lis.setFullScaleRange(LIS3DHTR_RANGE_2G);

    Serial.begin(115200);
}
- Lectura de datos del Acelerómetro y carga de datos
Por favor consulta Gráficos de Líneas para más información.
void loop() {
    spr.fillSprite(TFT_WHITE);
    float x_raw = lis.getAccelerationX();
    float y_raw = lis.getAccelerationY();
    float z_raw = lis.getAccelerationZ();
    ...

    if (accelerator_readings[0].size() == MAX_SIZE) {
      for (uint8_t i = 0; i<3; i++){
        accelerator_readings[i].pop(); //this is used to remove the first read variable
      }
    }

    accelerator_readings[0].push(x_raw); //store x-axis readings
    accelerator_readings[1].push(y_raw); //store y-axis readings
    accelerator_readings[2].push(z_raw); //store z-axis readings
    ...
}
- Configuraciones de título
Por favor consulta Gráficos de Líneas para más información.
auto header =  text(0, 0)
            .value("Accelerator Readings")
            .align(center)
            .valign(vcenter)
            .width(spr.width())
            .thickness(2);

header.height(header.font_height(&spr) * 2);
header.draw(&spr); // Header height is the twice the height of the font
- Configuraciones de gráfico de líneas
Para dibujar múltiples líneas en un gráfico, puedes pasar un array de doubles al gráfico de líneas como content.value({doubles[0],doubles[1],doubles[2]...}) como se muestra a continuación. También puedes establecer el color para cada línea usando .color() donde el orden del color coincidirá con el orden de los datos pasados.
auto content = line_chart(20, header.height()); //(x,ywhere the line graph begins
     content
            .height(spr.height() - header.height() * 1.5) //actual height of the line chart
            .width(spr.width() - content.x() * 2) //actual width of the line chart
            .based_on(-2.0) //Starting point of y-axis, must be a float
            .show_circle(false) //drawing a cirle at each point, default is on.
            .value({accelerator_readings[0],accelerator_readings[1], accelerator_readings[2]}) //passing through the data to line graph
            .max_size(MAX_SIZE)
            .color(TFT_BLUE, TFT_RED, TFT_GREEN)
            .backgroud(TFT_WHITE)
            .draw(&spr);
Código completo
#include"LIS3DHTR.h" //include the accelerator library
#include"seeed_line_chart.h" //include the line chart library

TFT_eSPI tft;
LIS3DHTR<TwoWire>  lis;

#define MAX_SIZE 50 //maximum size of data
doubles accelerator_readings[3];
TFT_eSprite spr = TFT_eSprite(&tft);  // Sprite

void setup() {
    tft.begin();
    tft.setRotation(3);
    spr.createSprite(TFT_HEIGHT,TFT_WIDTH);
    spr.setRotation(3);

    lis.begin(Wire1);
    lis.setOutputDataRate(LIS3DHTR_DATARATE_25HZ);
    lis.setFullScaleRange(LIS3DHTR_RANGE_2G);

    Serial.begin(115200);
}

void loop() {
    spr.fillSprite(TFT_WHITE);
    float x_raw = lis.getAccelerationX();
    float y_raw = lis.getAccelerationY();
    float z_raw = lis.getAccelerationZ();

    //This is used to print out on Serial Plotter, check Serial Plotter!
    Serial.print(x_raw);
    Serial.print(",");
    Serial.print(y_raw);
    Serial.print(",");
    Serial.println(z_raw);

    if (accelerator_readings[0].size() == MAX_SIZE) {
      for (uint8_t i = 0; i<3; i++){
        accelerator_readings[i].pop(); //this is used to remove the first read variable
      }
    }
    accelerator_readings[0].push(x_raw); //read variables and store in data
    accelerator_readings[1].push(y_raw);
    accelerator_readings[2].push(z_raw);

    //Settings for the line graph title
    auto header =  text(0, 0)
                .value("Accelerator Readings")
                .align(center)
                .valign(vcenter)
                .width(spr.width())
                .thickness(2);

    header.height(header.font_height(&spr) * 2);
    header.draw(&spr); // Header height is the twice the height of the font

  //Settings for the line graph
    auto content = line_chart(20, header.height()); //(x,y) where the line graph begins
         content
                .height(spr.height() - header.height() * 1.5) //actual height of the line chart
                .width(spr.width() - content.x() * 2) //actual width of the line chart
                .based_on(-2.0) //Starting point of y-axis, must be a float
                .show_circle(false) //drawing a cirle at each point, default is on.
                .value({accelerator_readings[0],accelerator_readings[1], accelerator_readings[2]}) //passing through the data to line graph
                .max_size(MAX_SIZE)
                .color(TFT_BLUE, TFT_RED, TFT_GREEN)
                .backgroud(TFT_WHITE)
                .draw(&spr);

    spr.pushSprite(0, 0);
    delay(50);
}