Gráficos de Líneas
Este repositorio describe cómo dibujar gráficos de líneas en Wio Terminal. Puedes usar esto para mostrar valores de sensores en bruto para visualizar lecturas en pantalla, ¡como el trazador serie! La biblioteca es muy flexible y se puede adaptar a tus propias necesidades.
Instalación de Bibliotecas
Instalando la Biblioteca Seeed_Arduino_Linechart Para Gráficos 2D Para Wio Terminal
-
Visita Seeed_Arduino_Linechart y descarga todo el repositorio a tu unidad local.
-
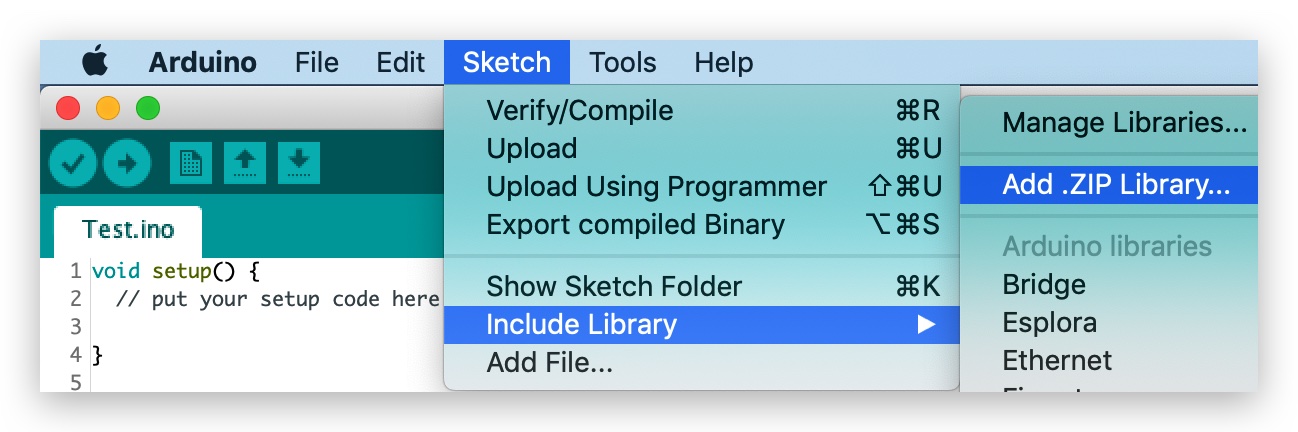
Ahora, la biblioteca Wio Terminal_graphics se puede instalar en el IDE de Arduino. Abre el IDE de Arduino, y haz clic en
sketch->Include Library->Add .ZIP Library, y elige el archivoSeeed_Arduino_Linechartque acabas de descargar.
Comenzando
Para inicializar el dibujo de gráficos de líneas
Primero, define el número máximo de variables a almacenar, y un tipo doubles para almacenar datos, así como crear un buffer usando la función TFT Sprite.
#define max_size 50 //maximum size of data
doubles data; //Initilising a doubles type to store data
TFT_eSprite spr = TFT_eSprite(&tft);  // Sprite
Para inicializar la pantalla LCD
void setup() {
    tft.begin();
    tft.setRotation(3);
    spr.createSprite(TFT_HEIGHT,TFT_WIDTH);
}
Cargando variables a datos
Usa data.push(variable) para almacenar variables (es decir, lecturas de sensores) en datos, y si alcanza el número máximo predefinido, elimina la primera variable (continúa así).
    spr.fillSprite(TFT_WHITE);
    if (data.size() == max_size) {
        data.pop(); //this is used to remove the first read variable
    }
    data.push(0.01 * random(1, 10)); //read variables and store in data
Para inicializar configuraciones para el Título del Gráfico de Líneas
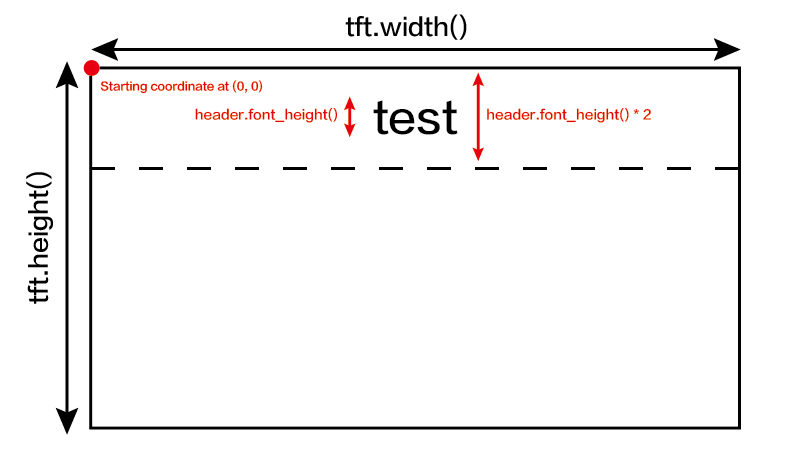
Algunas configuraciones para configurar la visualización deseada del título para el gráfico de líneas. Inicializa una estructura text(x, y), donde (x, y) son las coordenadas de inicio del título. Y configura las configuraciones como se muestra a continuación. En este ejemplo, header es el nombre de esta estructura y puede cambiar configuraciones y configurar como header.value("test") y etc.
    //Settings for the line graph title
    auto header =   text(0, 0)           //starting coordinates of title
                .value("test")      //actual title of the line graph
                .align(center)      //horizontal alignment of title
                .valign(vcenter)    //vertical alignment of title
                .width(tft.width()) //width of the title
                .thickness(3);      //thickness of the font

    header.height(header.font_height() * 2); //the height of title is the twice the height of the font
    header.draw();
Para ayudar a entender este código de ejemplo, por favor consulta las configuraciones del título en la imagen de abajo:
Para inicializar configuraciones para el Gráfico de Líneas y Dibujar en la Pantalla LCD
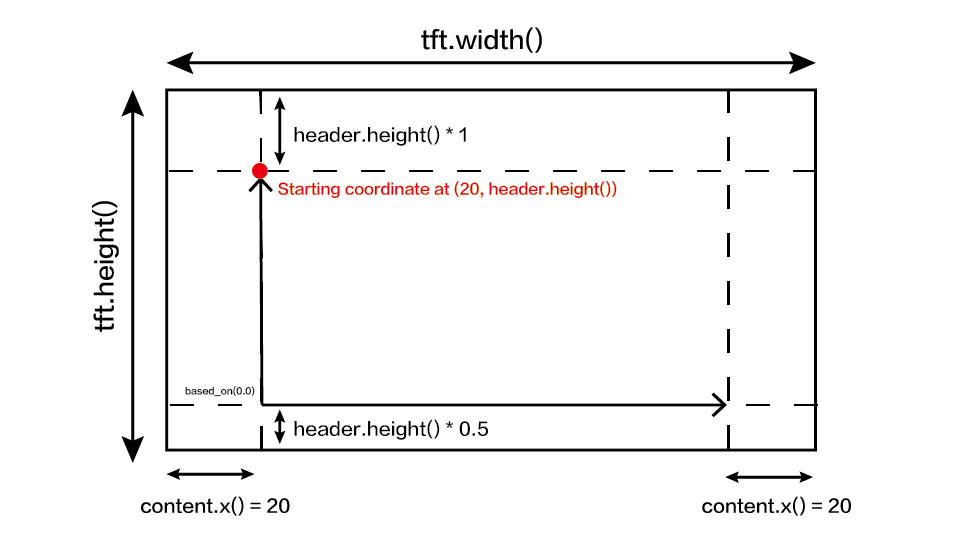
Algunas configuraciones para configurar la visualización deseada del gráfico de líneas. Inicializa una estructura line_chart(x, y), donde (x, y) es la coordenada inicial del gráfico de líneas. Y configura las configuraciones como se muestra a continuación. En este ejemplo, content es el nombre de esta estructura y puede cambiar configuraciones y configurar como content.based_on(0.0) y etc. ¡Altera estas configuraciones para la visualización preferida!
  //Settings for the line graph
    auto content = line_chart(20, header.height()); //(x,y) where the line graph begins
         content
                .height(tft.height() - header.height() * 1.5) //actual height of the line chart
                .width(tft.width() - content.x() * 2) //actual width of the line chart
                .based_on(0.0) //Starting point of y-axis, must be a float
                .show_circle(false) //drawing a cirle at each point, default is on.
                .value(data) //passing through the data to line graph
                .color(TFT_PURPLE) //Setting the color for the line
                .draw();

    spr.pushSprite(0, 0);
    delay(50);
Para ayudar a entender este código de ejemplo, por favor consulta las configuraciones del gráfico de líneas en la imagen de abajo:
Código completo
#include"seeed_line_chart.h" //include the library
TFT_eSPI tft;

#define max_size 50 //maximum size of data
doubles data; //Initilising a doubles type to store data
TFT_eSprite spr = TFT_eSprite(&tft);  // Sprite

void setup() {
    tft.begin();
    tft.setRotation(3);
    spr.createSprite(TFT_HEIGHT,TFT_WIDTH);
}

void loop() {
    spr.fillSprite(TFT_WHITE);
    if (data.size() == max_size) {
        data.pop();//this is used to remove the first read variable
    }
    data.push(0.01 * random(1, 10)); //read variables and store in data

    //Settings for the line graph title
    auto header =  text(0, 0)
                .value("test")
                .align(center)
                .valign(vcenter)
                .width(tft.width())
                .thickness(3);

    header.height(header.font_height() * 2);
    header.draw(); //Header height is the twice the height of the font

  //Settings for the line graph
    auto content = line_chart(20, header.height()); //(x,y) where the line graph begins
         content
                .height(tft.height() - header.height() * 1.5) //actual height of the line chart
                .width(tft.width() - content.x() * 2) //actual width of the line chart
                .based_on(0.0) //Starting point of y-axis, must be a float
                .show_circle(false) //drawing a cirle at each point, default is on.
                .value(data) //passing through the data to line graph
                .color(TFT_PURPLE) //Setting the color for the line
                .draw();

    spr.pushSprite(0, 0);
    delay(50);
}
Soporte Técnico y Discusión de Productos
¡Gracias por elegir nuestros productos! Estamos aquí para brindarte diferentes tipos de soporte para asegurar que tu experiencia con nuestros productos sea lo más fluida posible. Ofrecemos varios canales de comunicación para satisfacer diferentes preferencias y necesidades.