Getting Started with XIAO Debug Mate
Introduction
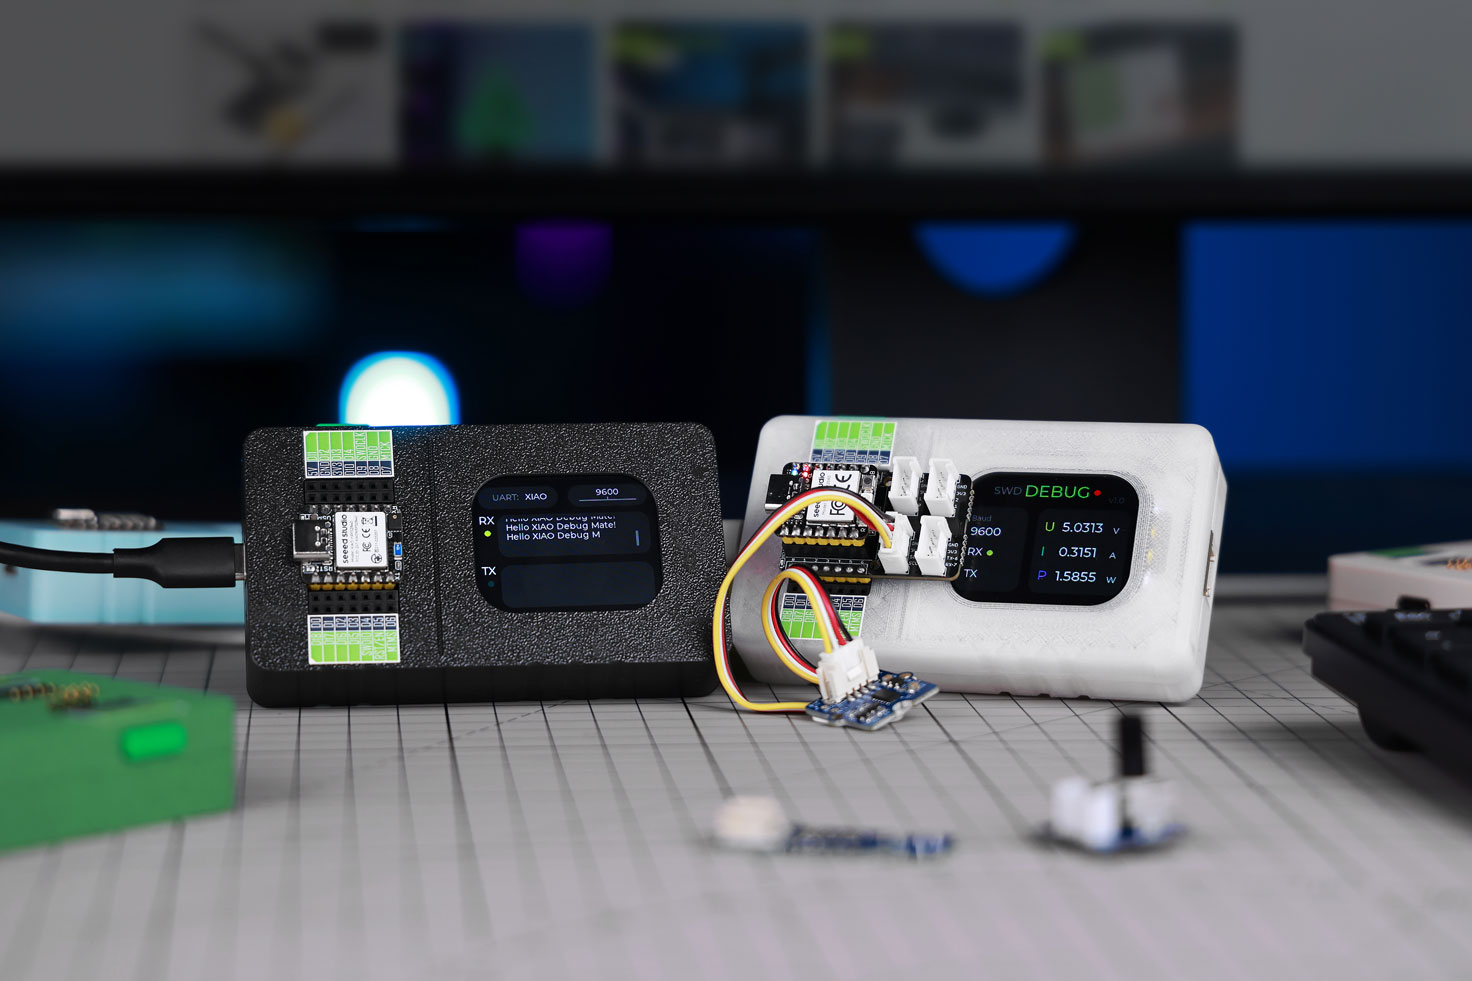
Seeed Studio XIAO Debug Mate is an open-source ESP32-S3 multi-tool that simplifies embedded system debugging with visual feedback. This all-in-one device features a standalone 2.01 inch TFT LCD display, LED status matrix, and native Seeed Studio XIAO support, delivering essential debugging functions: DAPLink chip-level debugging, built-in serial monitoring with UART passthrough, and accurate power consumption measurement. Plug-and-play design eliminates complex wiring for streamlined development.
Specification
| Parameter | Description |
|---|---|
| Processor | Espressif ESP32-S3 |
| Power Input | USB-C 5V/1A |
| Display | 2.01 inch TFT LCD with 240 x 296 resolution |
| LED | 36-LED Matrix for Status Indication (Default: Serial Baud Rate) |
| User Input | 1 x User Button/Boot Button 1 x Scroll Wheel 1 x Recessed Reset Button |
| I/O Interface | 14 x XIAO Standard Pins 8 x Expansion Pins 4 x SWD Debugging Pins 1 x UART Grove Connector |
| Product Size | 100x20x56 mm |
| Software | Supports DAPLink for debugging |
| Supported OpenOCD Target Chipset | SAMD21, nRF52840 (Sense), RP2040, RP2350, RA4M1, MG24 (Sense) |
| Enclosure | 3D-Printed in Black PLA |
Feature
-
DAPLink-Compatible SWD Interface for Professional Chip-Level Debugging
-
Intelligent Serial Monitor & UART Passthrough
-
Precision Power Profiling
-
Standalone Visual Feedback System
-
Open-Source Platform Designed for XIAO with Universal Compatibility
Hardware Overview
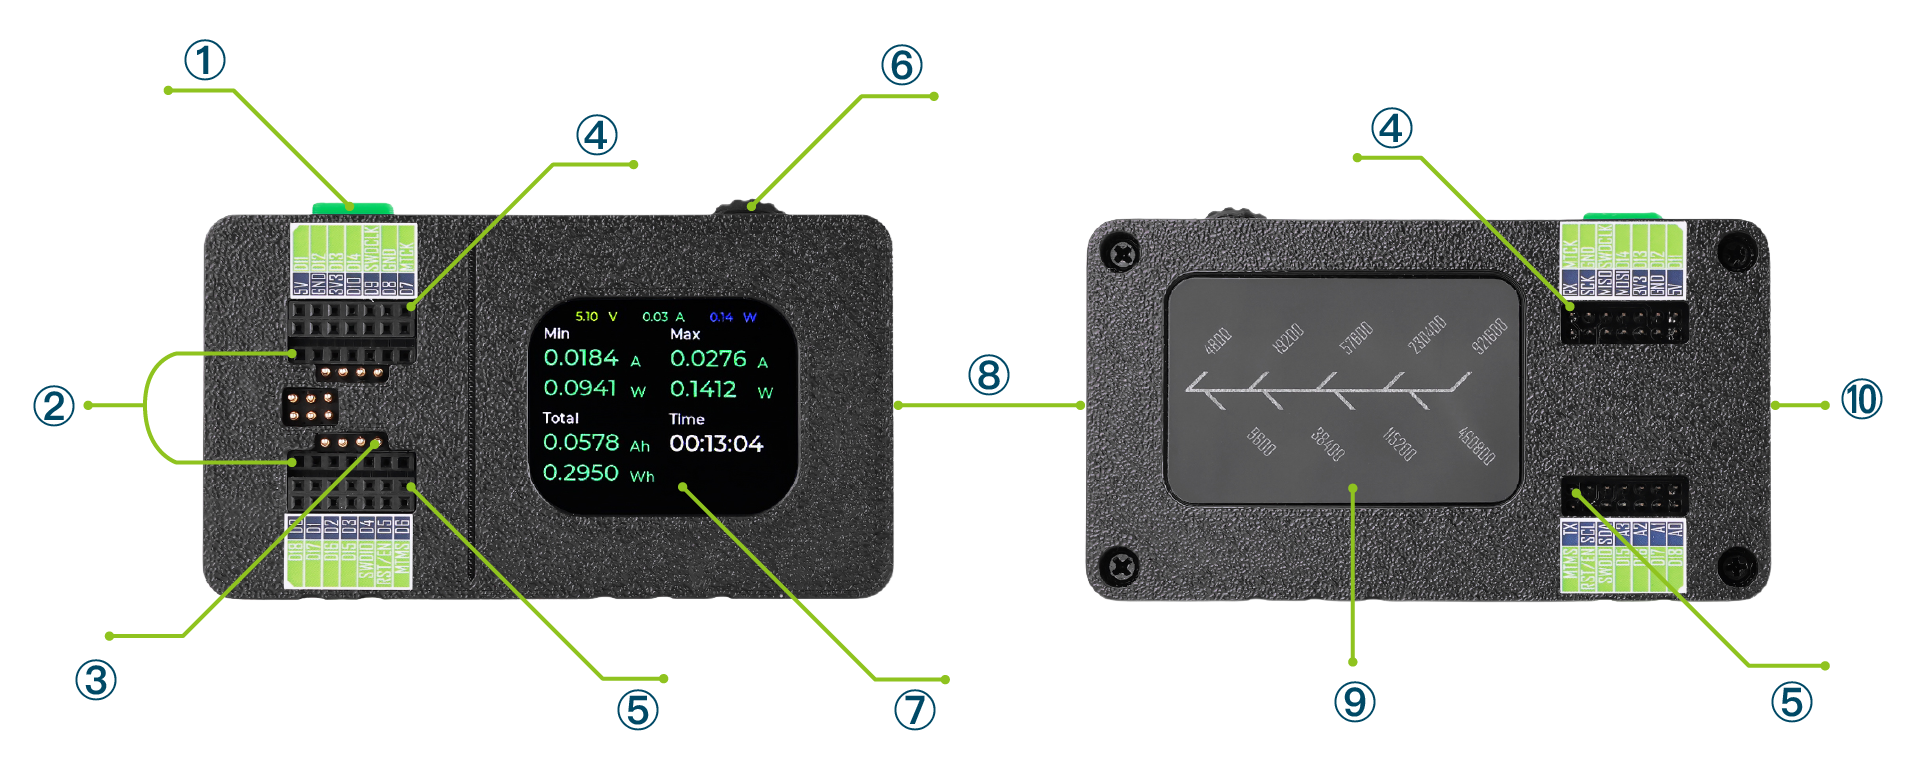
The XIAO Debug Mate is a compact, all-in-one tool designed to streamline your embedded development workflow. Below is a detailed look at its hardware layout and components.
The device is equipped with the following key hardware components:
-
① User Button: A push-button located on the top edge, used for user input like making selections or confirming actions.
-
② XIAO Socket: A dedicated socket composed of female headers, designed for a direct, plug-and-play connection with a Seeed Studio XIAO series board.
-
③ Pogo pins: A set of spring-loaded probes located within the XIAO Socket (②). Their specific function is to make reliable electrical contact with the pads on the back side of the installed XIAO mainboard.
-
④ Outer Inner Expansion Header: This header is specifically designed to break out the signals from the XIAO mainboard's back pins, which are connected via the Pogo Pins (③). It features a dual-interface design with female headers on the top (for Dupont wires) and male pins on the bottom. This versatile design allows the entire device to be used as a daughterboard on another system.
-
⑤ Inner Expansion Header: This header breaks out the pins from the left and right sides of the XIAO mainboard. Just like header ④, it features female headers on the top and male pins on the bottom, providing convenient access to the XIAO's rear-facing I/O.
-
⑥ Rotary Encoder: A rotary encoder wheel (roller) on the top edge, used for navigating menus, scrolling through options, and adjusting values on the display.
-
⑦ Display: 2.01-inch TFT LCD with a 240x296 resolution for clear data visualization and interaction.
-
⑧ Grove Port: For connecting external UART-based Grove modules.
-
⑨ Baud Rate Indicator: A visual indicator on the back of the device that clearly displays the currently selected UART baud rate.
-
⑩ USB-C Port: A USB-C port located on the side for providing power to the device and facilitating data communication, such as programming the XIAO board or UART passthrough.
Getting Started
Install Pin Stickers for the XIAO Debug Mate
Inside the package, you will find four pinout stickers. These are designed to be applied next to the expansion headers on the Debug Mate, giving you a quick and convenient reference for each pin's function.
To apply them correctly, notice the small white triangle on one corner of each sticker. This triangle is an alignment marker. It should be oriented to match the corresponding corner of the Debug Mate's PCB. The front and back stickers also have different text orientations to ensure they are readable from the correct side. Please refer to the image below for correct placement.
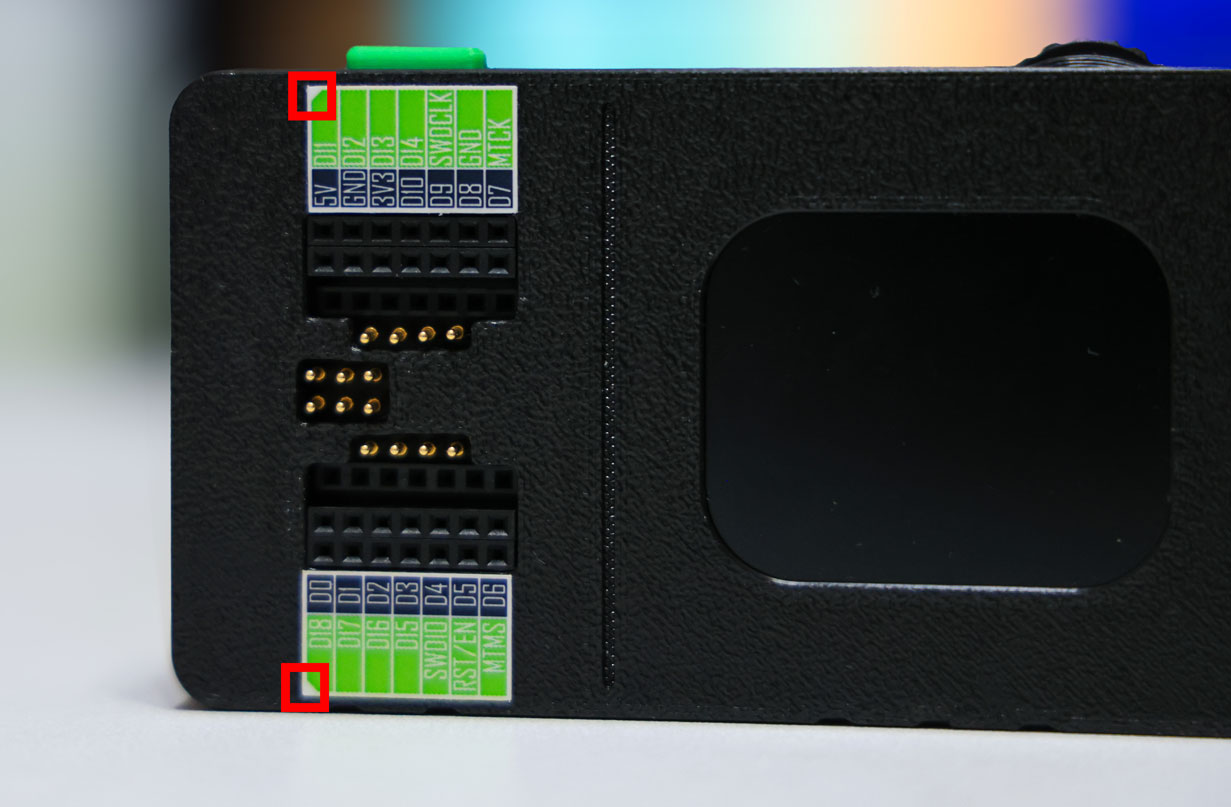
Stickers use different colors to distinguish the functions of the two rows of pins. Dark blue pin labels correspond to the inner row, while light green pin labels correspond to the outer row.
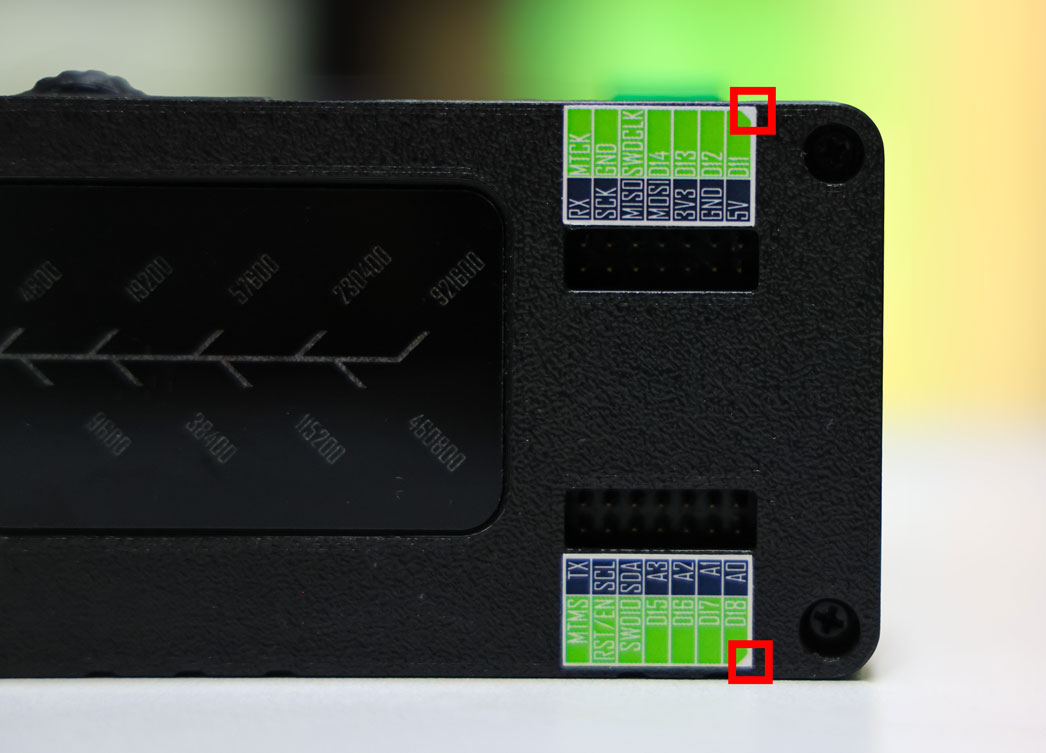
The markings on the front and back sides are also different. For example, on the front side, the XIAO pins are labeled with their pin numbers: D6, D7, D8, and so on. On the back side, these pins are marked with their protocols or functions: TX, RX, SCK, and so on.
First Power-On
The XIAO Debug Mate requires a constant 5V/1A power supply via its USB-C port. Upon connecting the power, the device will boot up, display a startup animation, and then land on the main interface, ready for operation.
Generally speaking, all functions of XIAO on Debug Mate do not require additional power supply to XIAO, unless otherwise specified.
Operational Logic
The device's interface is controlled by a simple and intuitive two-part system:
- Rotary Encoder (Roller): Scroll the roller to navigate through menus and highlight selectable options.
- Button:
- Single-Click: Confirms a selection or enters a highlighted menu.
- Long-Press (hold for >2s and release): Acts as a "Back" button, returning you to the previous screen or menu.
Introduction to the Operation Menu
The XIAO Debug Mate's firmware is organized into three main functional pages, which you can navigate using the roller and button.
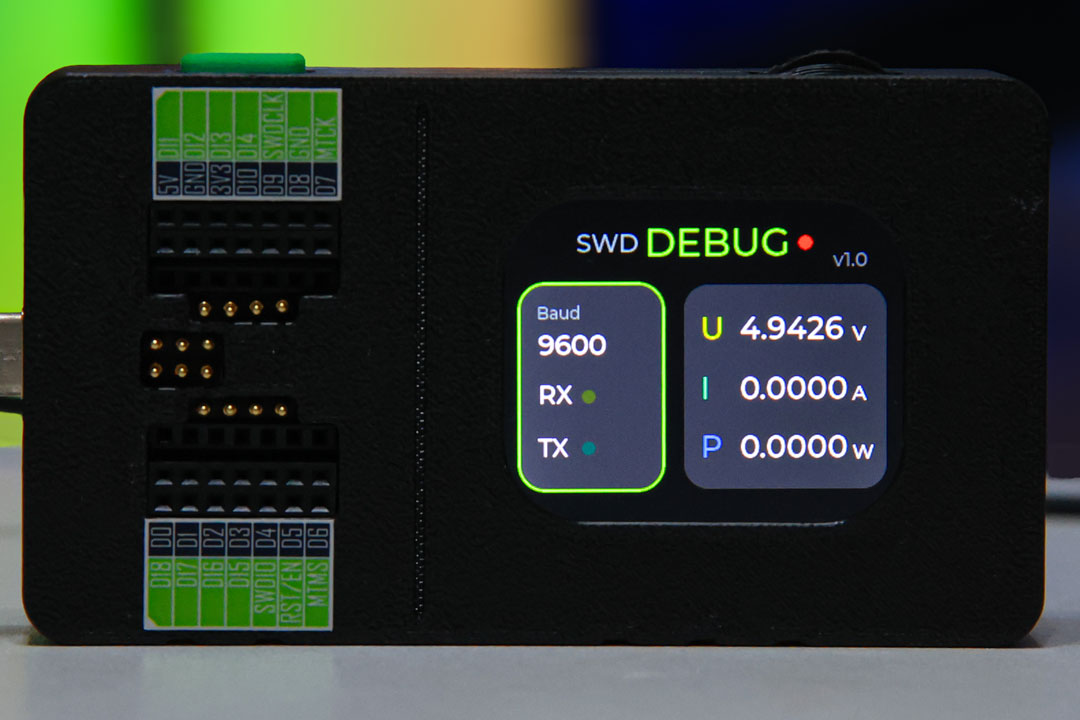
1. Main Page (Dashboard)

This is the default screen and serves as a central dashboard. It provides a real-time overview of all key functions:
- Debug Status: Indicates if the SWD
DEBUGfunction is active. - UART Status: Shows the current baud rate and activity on the RX/TX lines.
- Power Metrics: Displays the instantaneous Voltage (
U), Current (I), and Power (P) being drawn by the connected XIAO.
From this page, you can access the other two main functions. Simply scroll the roller to highlight either the UART module (bottom left) or the Power module (bottom right), and then single-click the button to enter its dedicated page.
| UART module | Power module |
|---|---|
 |  |
- The Debug function is only effective under the main page menu.
- The main page cannot retrieve serial port messages. Serial port pass-through and monitoring functions require accessing the serial port settings page.
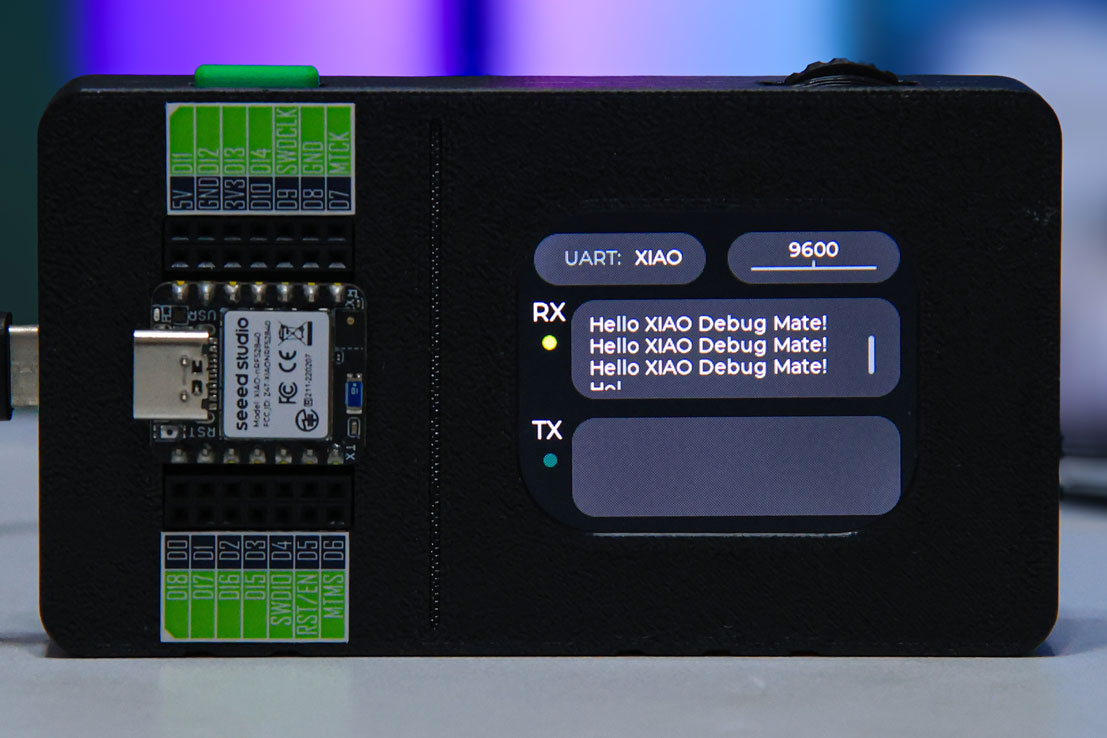
2. UART Page
This page is dedicated to serial communication and offers two distinct modes:
- UART Monitor: This mode captures and displays serial data directly on the Debug Mate's 2.01-inch LCD screen. It's perfect for quick, on-the-go debugging without a PC.
- UART Passthrough: In this mode, the Debug Mate acts as a USB-to-serial bridge. It forwards all serial data from the target device to your PC. The data is not displayed on the device's screen but can be viewed using any serial monitor software on your computer (e.g., Arduino IDE Serial Monitor, PuTTY, CoolTerm).
Within the UART page, you can configure the following by highlighting the option with the roller and clicking the button:
- Source: Choose between monitoring the onboard
XIAOor an external device connected to theGroveport.
| Choose XIAO | Choose Grove |
|---|---|
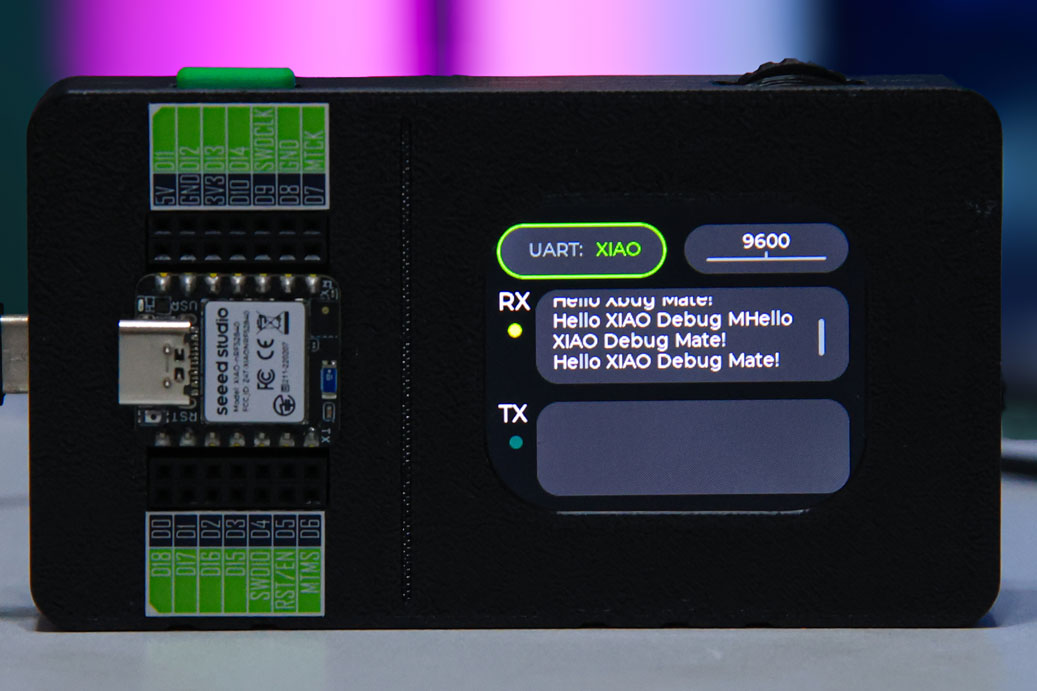 | 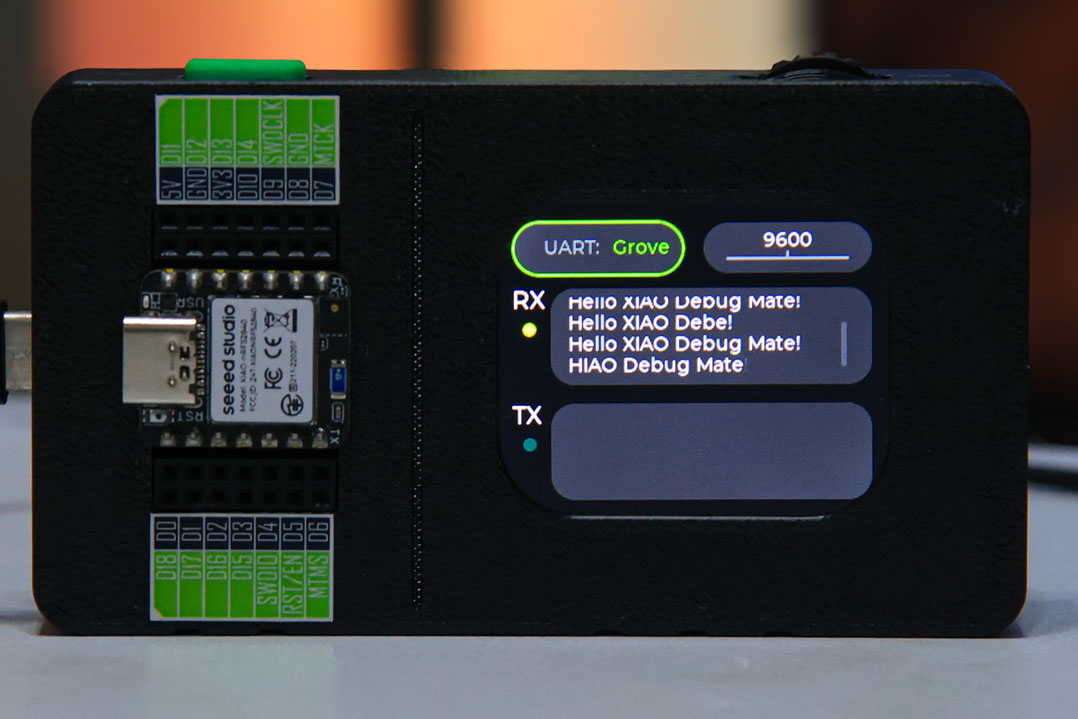 |
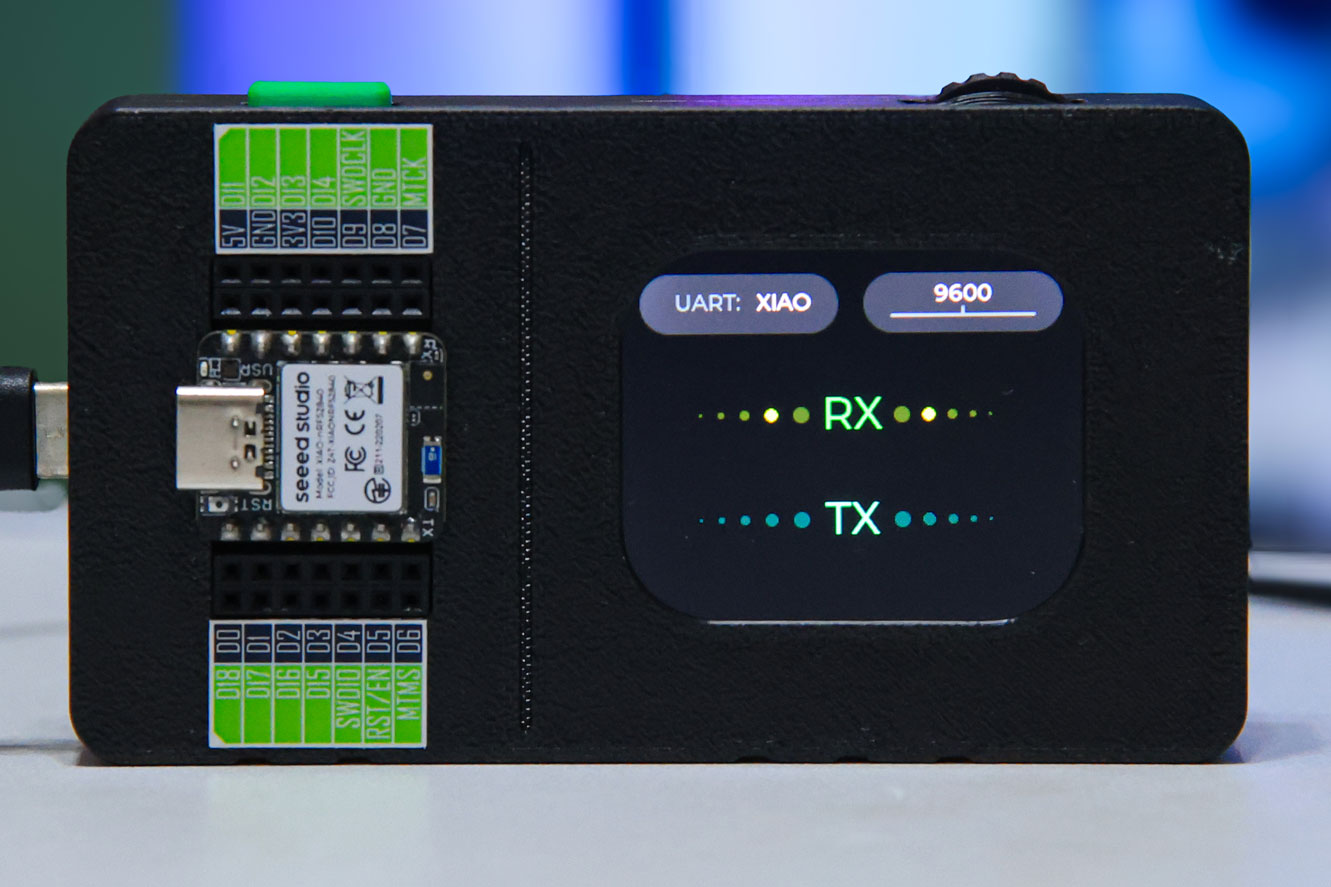
- Baud Rate: Select from 9 preset baud rates, ranging from 4800 bps to 921600 bps. The LED matrix on the back will visually update to reflect your selection.
| Front | Back |
|---|---|
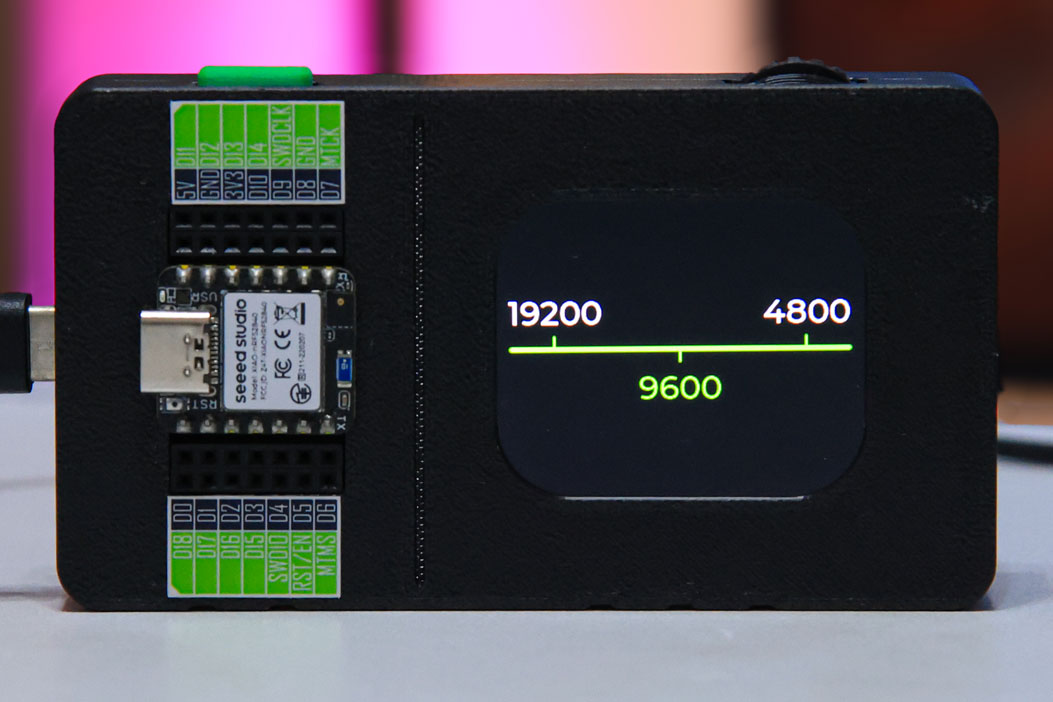 | 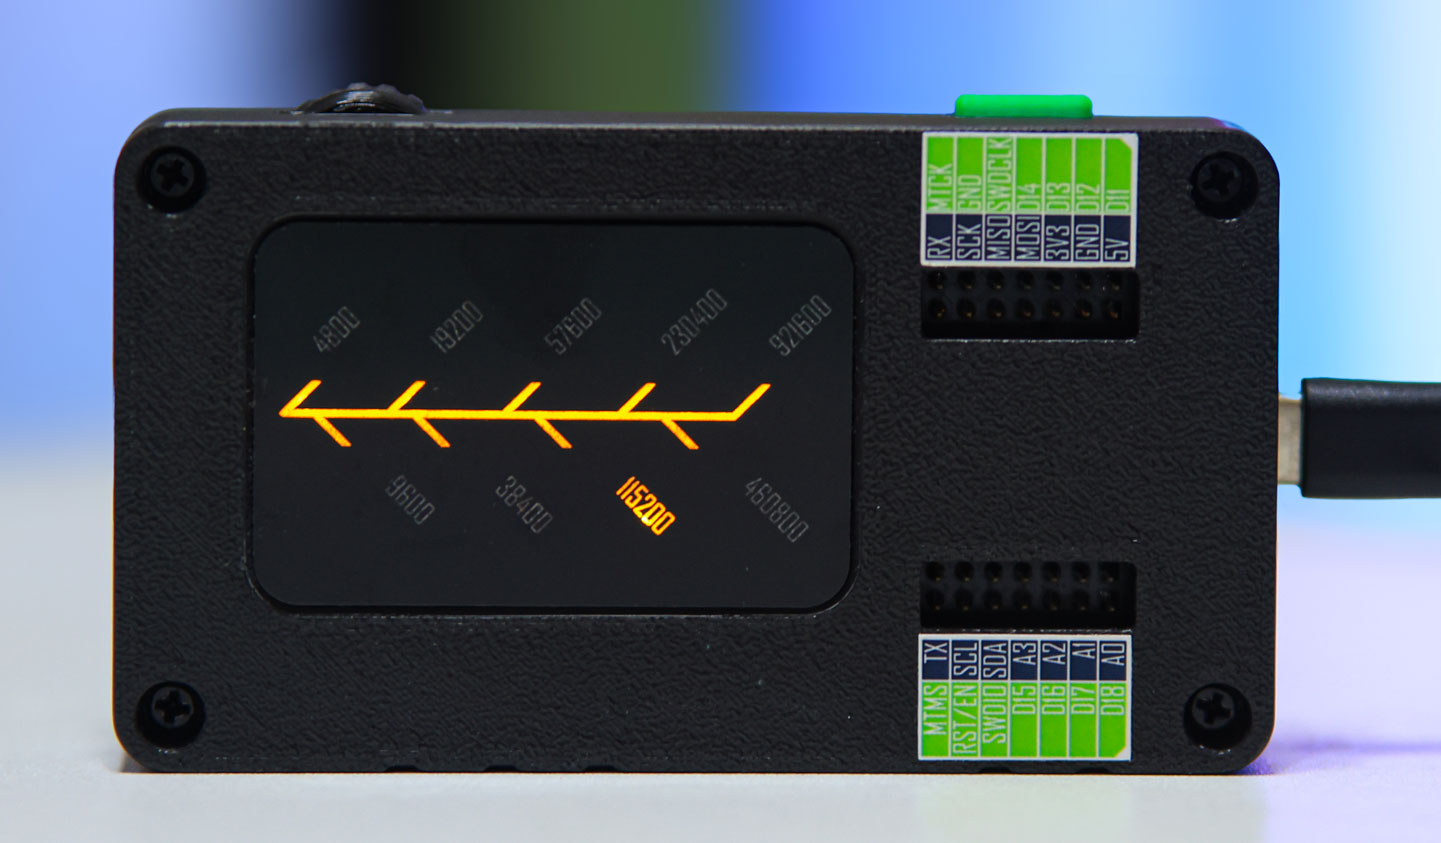 |
3. Power Analyzer Page
This page provides a high-precision power analysis tool with three different UI views, which you can cycle through by scrolling the roller.
- View 1: Simple Digital Meter This view presents a clean, large-font display of instantaneous Voltage (V), Current (A), and Power (W), measured with a precision of up to four decimal places.

- View 2: Low-Power Detail View
Optimized for low-power applications, this view focuses on current and power. It displays the values in multiple units simultaneously (e.g.,
18.234 mAand18234 uA), saving you the effort of manual unit conversions when tracking microamp-level consumption.

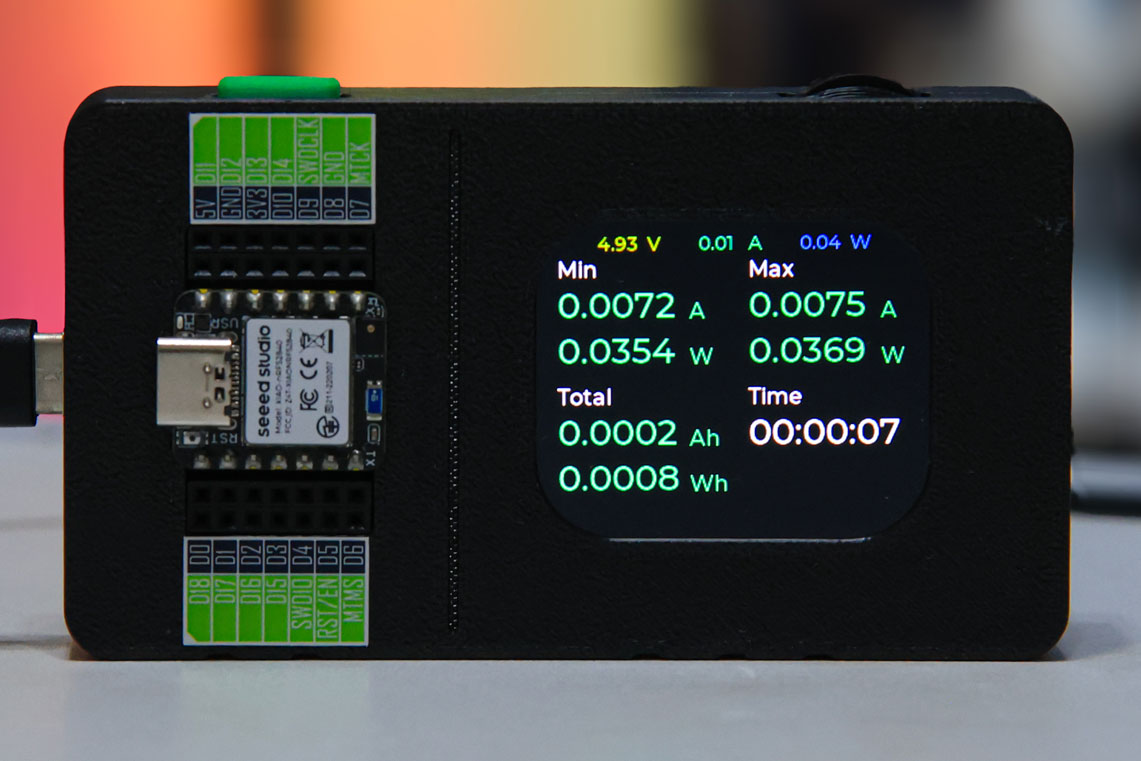
- View 3: Statistical Analysis
This view is ideal for project validation and battery life estimation. It tracks and displays:
- Min/Max: The minimum and maximum current and power values recorded during the session.
- Total: The cumulative energy (
Wh) and charge (Ah) consumed over time. - Time: The duration of the measurement session.
The first time you enter the View 3, the power consumption timer will start. When you press and hold the confirmation button to exit the Power Analyzer Page, the timer will reset to zero.
The power analysis function measures the power supplied to the XIAO via its 5V pin. This measurement includes the power consumed by the XIAO's onboard Power Management IC (PMIC) and other 5V-rail components. If you plan to power your final project with a LiPo battery connected directly to the XIAO's 3.3V/BAT pads, the actual power consumption will be lower than what is reported by the Debug Mate. Please use this data as a valuable reference, keeping this difference in mind for final battery calculations.
XIAO Debug Mate: Features and Usage
For detailed guides on how to use the DAPLink debugger, UART monitor, and power analyzer with specific IDEs and projects, please refer to our dedicated feature guides.
Reset
If you need to restart the XIAO Debug Mate, you have two options:
- Unplug and re-plug the USB-C power cable.
- Use the hidden Reset button. It is located in a small hole directly beneath the USB-C port. You can gently press it using a SIM card ejector tool or a paperclip.
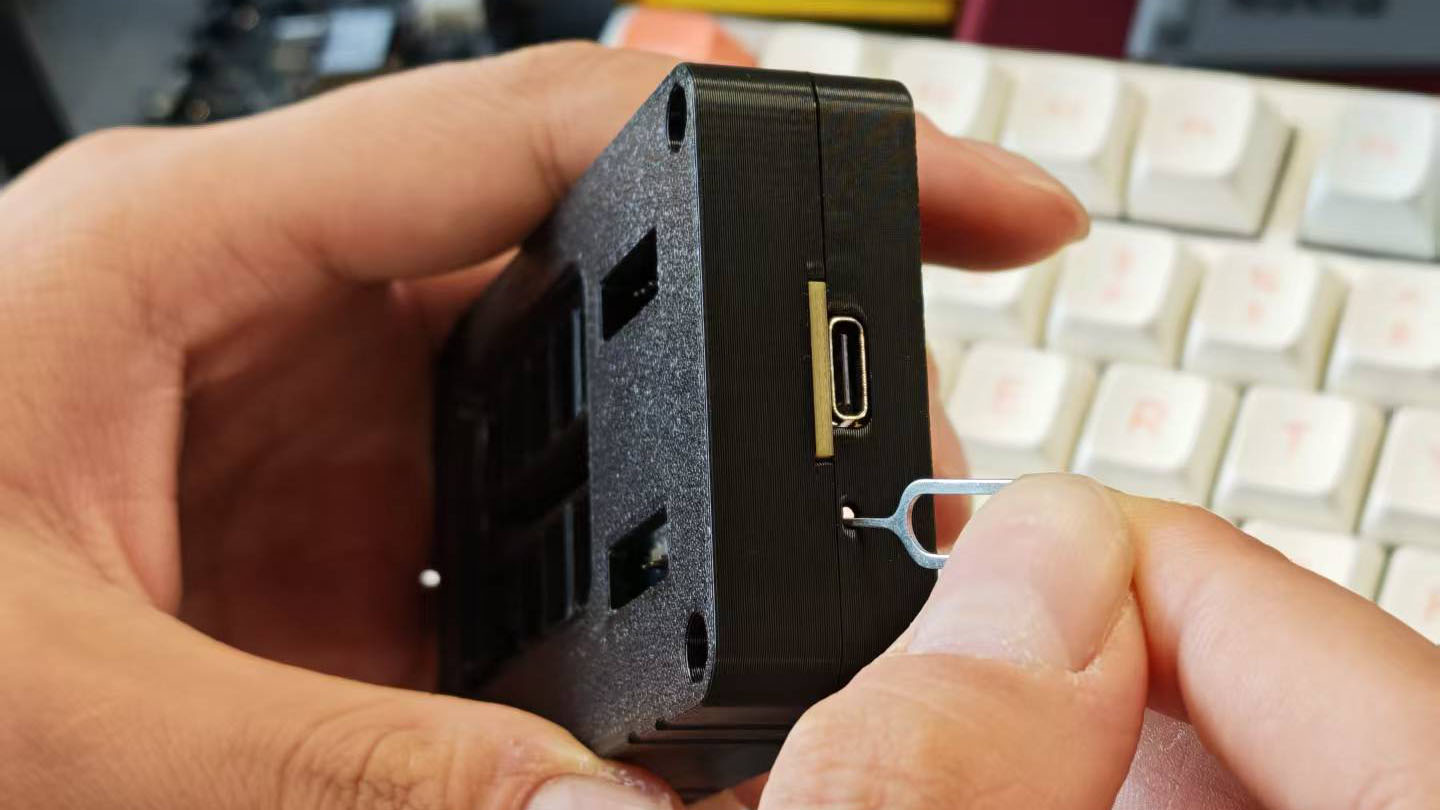
Do not apply excessive force when using the reset button, as this could damage the internal switch.
Boot
The main button on the device serves a dual purpose. During normal operation, it functions as the Confirm/Back button. However, it also acts as the BOOT button for entering the ESP32-S3's flash mode.
To enter Flash Mode:
- Ensure the device is powered off (unplugged).
- Press and hold the main button.
- While still holding the button, connect the USB-C cable to power the device.
- The device will now be in Flash Mode, ready to receive new firmware.
Factory firmware
Should you need to restore the original factory firmware, you can do so using one of the methods below. First, put the device into Boot Mode as described in the section above.
Method 1: Using Flash Scripts
We have prepared a package with easy-to-use flashing scripts for all major operating systems.
- Download the firmware package.
- Extract the contents of the zip file.
- Put your XIAO Debug Mate into Boot Mode.
- Run the appropriate script for your OS.
- Windows
- MacOS
- Linux
Double-click the flash.bat file.
Open a terminal, navigate to the extracted folder, and run the command: sh flash.sh
Open a terminal, navigate to the extracted folder, and run the command: sh flash.sh
Method 2: Using esptool
If you have esptool installed as part of the ESP-IDF or as a Python package, you can flash the firmware manually.
- Download the factory firmware
.binfile.
- Put your XIAO Debug Mate into Boot Mode.
- Open a terminal or command prompt and run the appropriate command below.
- Windows
- MacOS
- Linux
esptool.exe --chip esp32s3 write_flash 0x0 firmware-v1.0.bin
esptool.py --chip esp32s3 write_flash 0x0 firmware-v1.0.bin
esptool.py --chip esp32s3 write_flash 0x0 firmware-v1.0.bin
Method 3: Using PlatformIO with Open-Source Firmware
The firmware for XIAO Debug Mate is completely open-source and available on GitHub. If you want to customize the firmware or build it from source, you can use PlatformIO.
- Clone the repository:
git clone https://github.com/Seeed-Studio/OSHW-XIAO-Debug-Mate.git
-
Navigate to the firmware directory
-
Open the project in PlatformIO:
- If using PlatformIO IDE (VS Code extension), open the folder containing
platformio.ini - Or use PlatformIO Core CLI
- If using PlatformIO IDE (VS Code extension), open the folder containing
-
Put your XIAO Debug Mate into Boot Mode as described in the Boot section above.
-
Build and upload the firmware:
- PlatformIO IDE
- PlatformIO CLI
- Click the "Upload" button in the PlatformIO toolbar
- Or use the command palette:
PlatformIO: Upload
pio run --target upload
This method allows you to:
- Modify the firmware to add custom features
- Build the latest development version
- Contribute to the open-source project
- Learn from the source code implementation
Make sure you have PlatformIO installed. You can install it as a VS Code extension or as a standalone CLI tool via pip: pip install platformio
Troubleshooting
Q1: XIAO Debug Mate Pin Compatibility Guide
Problem: I'm having trouble with the debug function; it seems like there's a bad connection.

Solution: This can happen due to two main reasons:
-
Compatibility with Older XIAO Boards: Some of the earlier XIAO boards, such as the XIAO SAMD21, XIAO RP2040, and XIAO nRF52840, were designed before a unified standard for the back-side pads was established. While the Debug Mate's pogo pins are positioned to be as compatible as possible, slight variations in these older boards may lead to imperfect contact.
If you experience an unstable debug connection, try slightly adjusting the position of the XIAO board within the socket. You may not need to push it all the way down. A small shift can often ensure the pogo pins make solid contact with the SWD pads on the back of the XIAO.
-
Wear and Tear on Headers: The female headers, like any mechanical connector, have a finite lifespan. To maximize their durability and ensure a reliable connection, please follow this best practice:
- When inserting or removing a XIAO board, apply force straight up or down.
- Avoid wiggling or rocking the XIAO board back and forth, as this can bend the pins, widen the contacts in the female header, and lead to poor connections over time.
Special Thanks
Special thanks to 啊猫啊狗晒太阳 (Ah Mao Ah Gou Shai Tai Yang) for the design inspiration for the LED matrix. The design of the Debug Mate's onboard LED indicator is a reference to their excellent open-source project. The original design is very creative and practical.
If you would like to see the original design, you can check out the demonstration video and the author's homepage through the links below.
Resources
- [ZIP] Seeed Studio XIAO Debug Mate 3D Printed Case
- [PDF] Seeed Studio XIAO Debug Mate SCH PDF
- [ZIP] Seeed Studio XIAO Debug Mate SCH&PCB KiCAD Files
- [GITHUB] Seeed Studio XIAO Debug Mate Firmware Repository