Gráficos de Linha
Este repositório descreve como desenhar gráficos de linha no Wio Terminal. Você pode usá‑lo para exibir valores brutos de sensores e visualizar as leituras na tela exatamente como no serial plotter! A biblioteca é muito flexível e pode ser alterada conforme a sua necessidade.
Instalação de Bibliotecas
Instalando a Biblioteca Seeed_Arduino_Linechart Para Gráficos 2D no Wio Terminal
-
Acesse Seeed_Arduino_Linechart e baixe todo o repositório para o seu disco local.
-
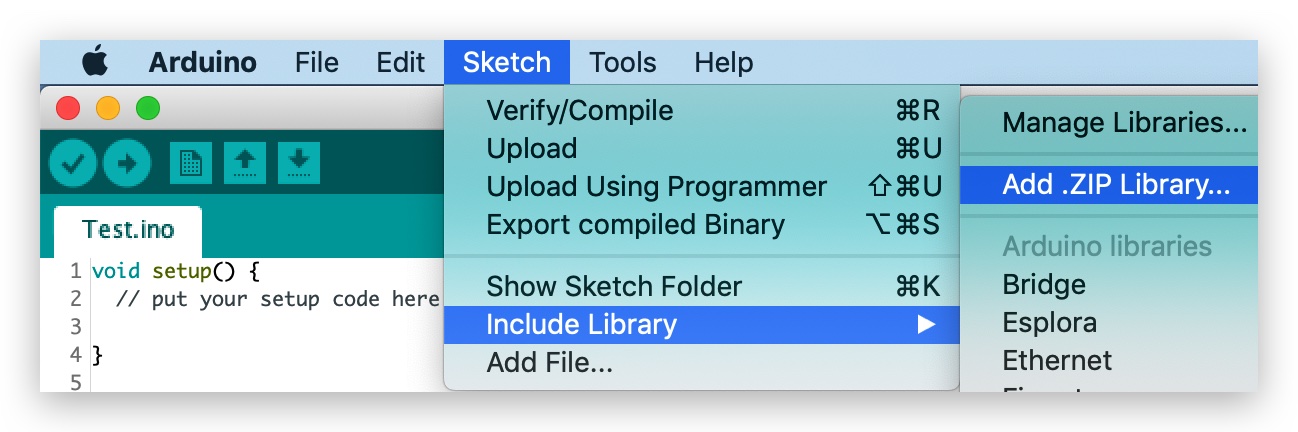
Agora, a biblioteca Wio Terminal_graphics pode ser instalada na IDE Arduino. Abra a IDE Arduino e clique em
sketch->Include Library->Add .ZIP Library, e escolha o arquivoSeeed_Arduino_Linechartque você acabou de baixar.
Primeiros Passos
Inicializar para desenhar o gráfico de linha
Primeiro, defina o número máximo de variáveis a serem armazenadas e um tipo double para armazenar os dados, além de criar um buffer usando a função TFT Sprite.
#define max_size 50 //maximum size of data
doubles data; //Initilising a doubles type to store data
TFT_eSprite spr = TFT_eSprite(&tft);  // Sprite
Inicializar a Tela LCD
void setup() {
    tft.begin();
    tft.setRotation(3);
    spr.createSprite(TFT_HEIGHT,TFT_WIDTH);
}
Carregar variáveis em data
Use data.push(variable) para armazenar variáveis (por exemplo, leituras de sensores) em data e, se atingir o número máximo predefinido, ele remove a primeira variável (mantendo a execução contínua).
    spr.fillSprite(TFT_WHITE);
    if (data.size() == max_size) {
        data.pop(); //this is used to remove the first read variable
    }
    data.push(0.01 * random(1, 10)); //read variables and store in data
Inicializar configurações para o Título do Gráfico de Linha
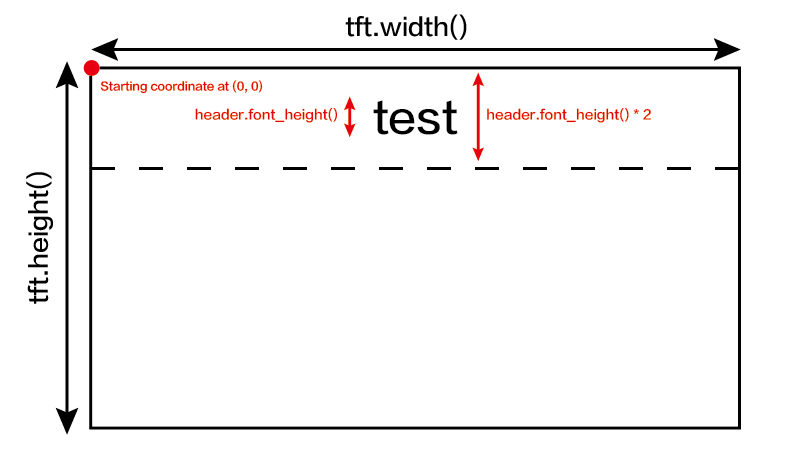
Algumas configurações para ajustar a exibição desejada do título para o gráfico de linha. Inicialize uma struct text(x, y), onde (x, y) são as coordenadas iniciais do título. E configure as definições como abaixo. Neste exemplo, header é o nome dessa struct e pode alterar as configurações e definir como header.value("test") etc.
    //Settings for the line graph title
    auto header =   text(0, 0)           //starting coordinates of title
                .value("test")      //actual title of the line graph
                .align(center)      //horizontal alignment of title
                .valign(vcenter)    //vertical alignment of title
                .width(tft.width()) //width of the title
                .thickness(3);      //thickness of the font

    header.height(header.font_height() * 2); //the height of title is the twice the height of the font
    header.draw();
Para ajudar a entender este código de exemplo, consulte as configurações de título na imagem abaixo:
Inicializar configurações para o Gráfico de Linha e Desenhar na Tela LCD
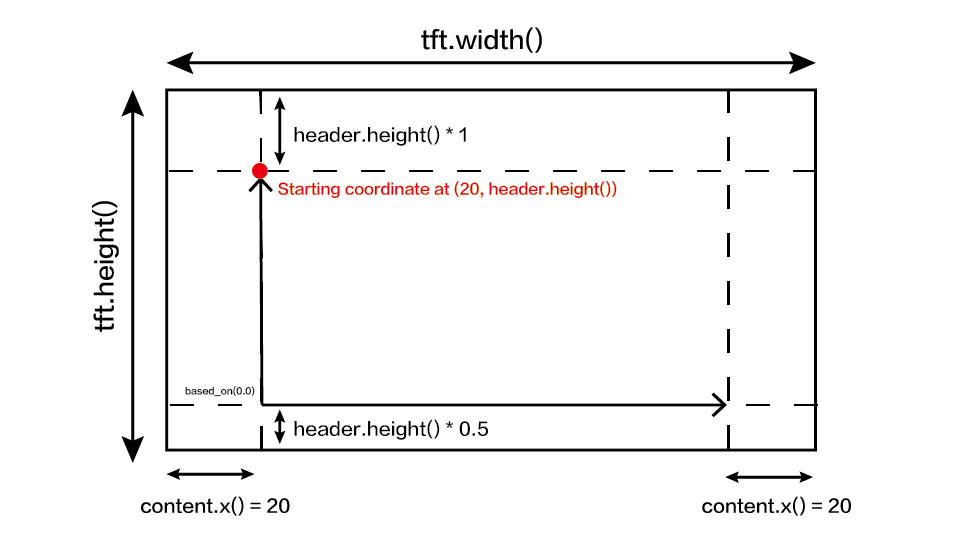
Algumas configurações para ajustar a exibição desejada do gráfico de linha. Inicialize uma struct line_chart(x, y), onde (x, y) é a coordenada inicial do gráfico de linha. E configure as definições como abaixo. Neste exemplo, content é o nome dessa struct e pode alterar as configurações e definir como content.based_on(0.0) etc. Altere essas configurações para a exibição que preferir!
  //Settings for the line graph
    auto content = line_chart(20, header.height()); //(x,y) where the line graph begins
         content
                .height(tft.height() - header.height() * 1.5) //actual height of the line chart
                .width(tft.width() - content.x() * 2) //actual width of the line chart
                .based_on(0.0) //Starting point of y-axis, must be a float
                .show_circle(false) //drawing a cirle at each point, default is on.
                .value(data) //passing through the data to line graph
                .color(TFT_PURPLE) //Setting the color for the line
                .draw();

    spr.pushSprite(0, 0);
    delay(50);
Para ajudar a entender este código de exemplo, consulte as configurações do gráfico de linha na imagem abaixo:
Código completo
#include"seeed_line_chart.h" //include the library
TFT_eSPI tft;

#define max_size 50 //maximum size of data
doubles data; //Initilising a doubles type to store data
TFT_eSprite spr = TFT_eSprite(&tft);  // Sprite

void setup() {
    tft.begin();
    tft.setRotation(3);
    spr.createSprite(TFT_HEIGHT,TFT_WIDTH);
}

void loop() {
    spr.fillSprite(TFT_WHITE);
    if (data.size() == max_size) {
        data.pop();//this is used to remove the first read variable
    }
    data.push(0.01 * random(1, 10)); //read variables and store in data

    //Settings for the line graph title
    auto header =  text(0, 0)
                .value("test")
                .align(center)
                .valign(vcenter)
                .width(tft.width())
                .thickness(3);

    header.height(header.font_height() * 2);
    header.draw(); //Header height is the twice the height of the font

  //Settings for the line graph
    auto content = line_chart(20, header.height()); //(x,y) where the line graph begins
         content
                .height(tft.height() - header.height() * 1.5) //actual height of the line chart
                .width(tft.width() - content.x() * 2) //actual width of the line chart
                .based_on(0.0) //Starting point of y-axis, must be a float
                .show_circle(false) //drawing a cirle at each point, default is on.
                .value(data) //passing through the data to line graph
                .color(TFT_PURPLE) //Setting the color for the line
                .draw();

    spr.pushSprite(0, 0);
    delay(50);
}
Suporte Técnico & Discussão de Produto
Obrigado por escolher nossos produtos! Estamos aqui para oferecer diferentes tipos de suporte para garantir que sua experiência com nossos produtos seja a mais tranquila possível. Oferecemos vários canais de comunicação para atender a diferentes preferências e necessidades.