reComputer R1000 with fuxa to achieve SCADA
Introduction
FUXA is a web-based Process Visualization (SCADA/HMI/Dashboard) software. With FUXA you can create modern process visualizations with individual designs for your machines and real-time data display.It supports Modbus RTU/TCP, Siemens S7 Protocol, OPC-UA, BACnet IP, MQTT, and other protocols.
This article mainly introduces how to use fuxa to achieve SCADA. In the article, fuxa receives data from node-red and OPC UA Simulator, and displays it using chart and Circular Gauge; at the same time, it draws a series of patterns to simulate industrial processes.
Getting Start
Before you start this project, you may need to prepare your hardware and software in advance as described here.
Hardware Preparation
| reComputer R1000 |
|---|
 |
Software Preparation
-
Python 3.11 may be incompatible with fuxa. If your Python version is 3.11, please consider changing to a different Python version.
-
Using fuxa on reComputer R1000.You can refer to the following steps to install fuxa on reComputer R1000
  ## You need to have installed Node Version 14 || 16 || 18.
  wget https://nodejs.org/dist/v18.20.3/node-v18.20.3-linux-arm64.tar.xz
  tar -xf node-v18.20.3-linux-arm64.tar.xz
  cd node-v18.20.3-linux-arm64
  sudo cp -R * /usr/local/
  node -v
  npm -v
  ## Next install FUXA from npm
  sudo npm install -g --unsafe-perm @frangoteam/fuxa
sudo fuxa -
Regarding how to use fuxa to implement OPC-UA data interaction, you can refer to this wiki.
-
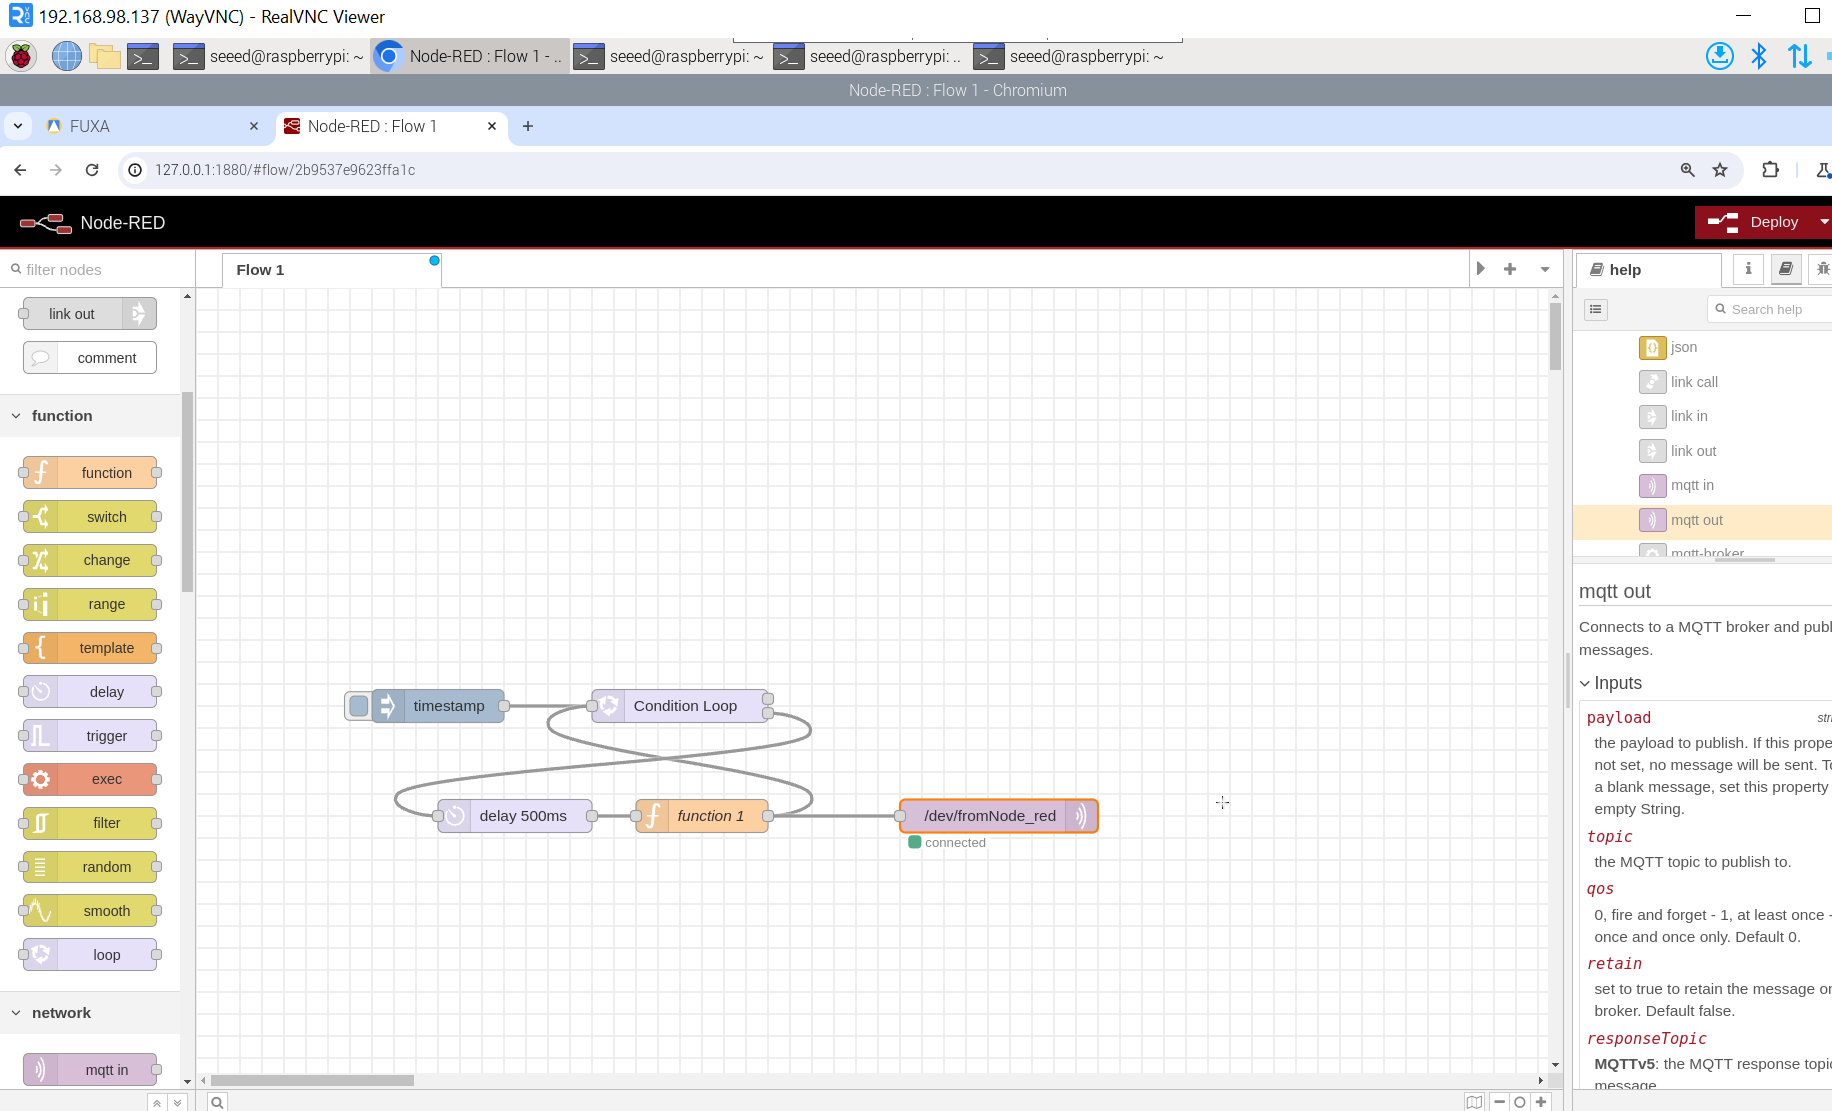
Regarding how to use fuxa to implement data interaction with mqtt client, you can refer to this wiki.Unlike this wiki, the data we publish in
node-redis processed by thefunctionmodule, and theloopmodule is used for continuous publishing.The code of thefunctionmodule is as follows:## On Start
global.set('firstTank', '10000');
global.set('secondTank', '0');
global.set('thirdTank', '0');## On Message
var firstTank = global.get('firstTank');
var secondTank = global.get('secondTank');
var thirdTank = global.get('thirdTank');
if (firstTank <= 0) {
global.set('firstTank', 10000);
global.set('secondTank', 0);
global.set('thirdTank', 0);
firstTank=10000;
secondTank=0;
thirdTank=0;
}
firstTank = firstTank - 3;
secondTank++;
thirdTank++;
thirdTank++;
global.set('firstTank',firstTank);
global.set('secondTank',secondTank);
global.set('thirdTank',thirdTank);
var data = {
"firstTank":firstTank,
"scondTank":secondTank,
"thirdTank":thirdTank,
};
msg.payload = data;
return msg;The main thing is to encapsulate firstTank, secondTank, and thirdTank into json format, and then let the mqtt-out module publish it.
-
Click the
+button in the lower right corner of fuxa, enterName,Type, selectInternal, and finally clickOKto get a new module. This module does not have the function of communicating with external devices, but it allows us to Add custom tags. These tags support three data types such asboolean,number, andstring, which can facilitate our subsequent work.
Hardware Configuration
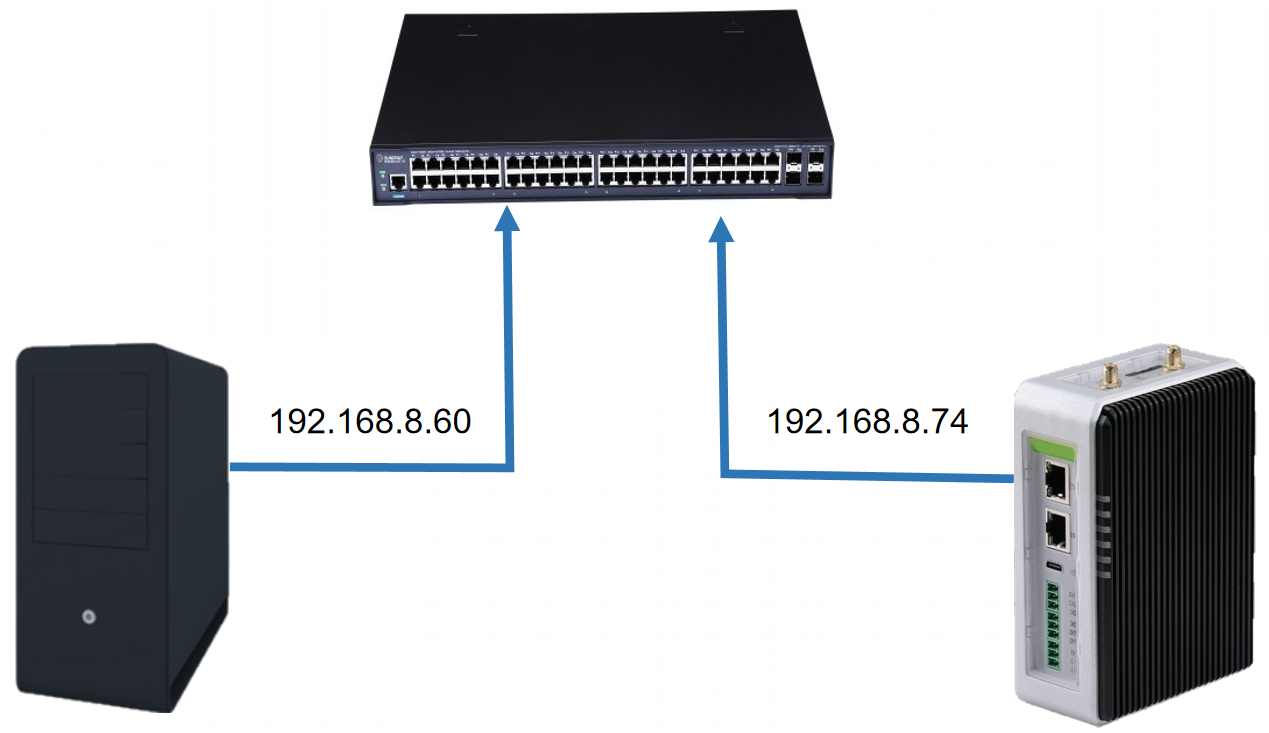
We use Ethernet cables to connect the W10 PC and reComputer R1000 to a switch to ensure that they are on the same network segment.
Introduction to visual display and main controls
Chart
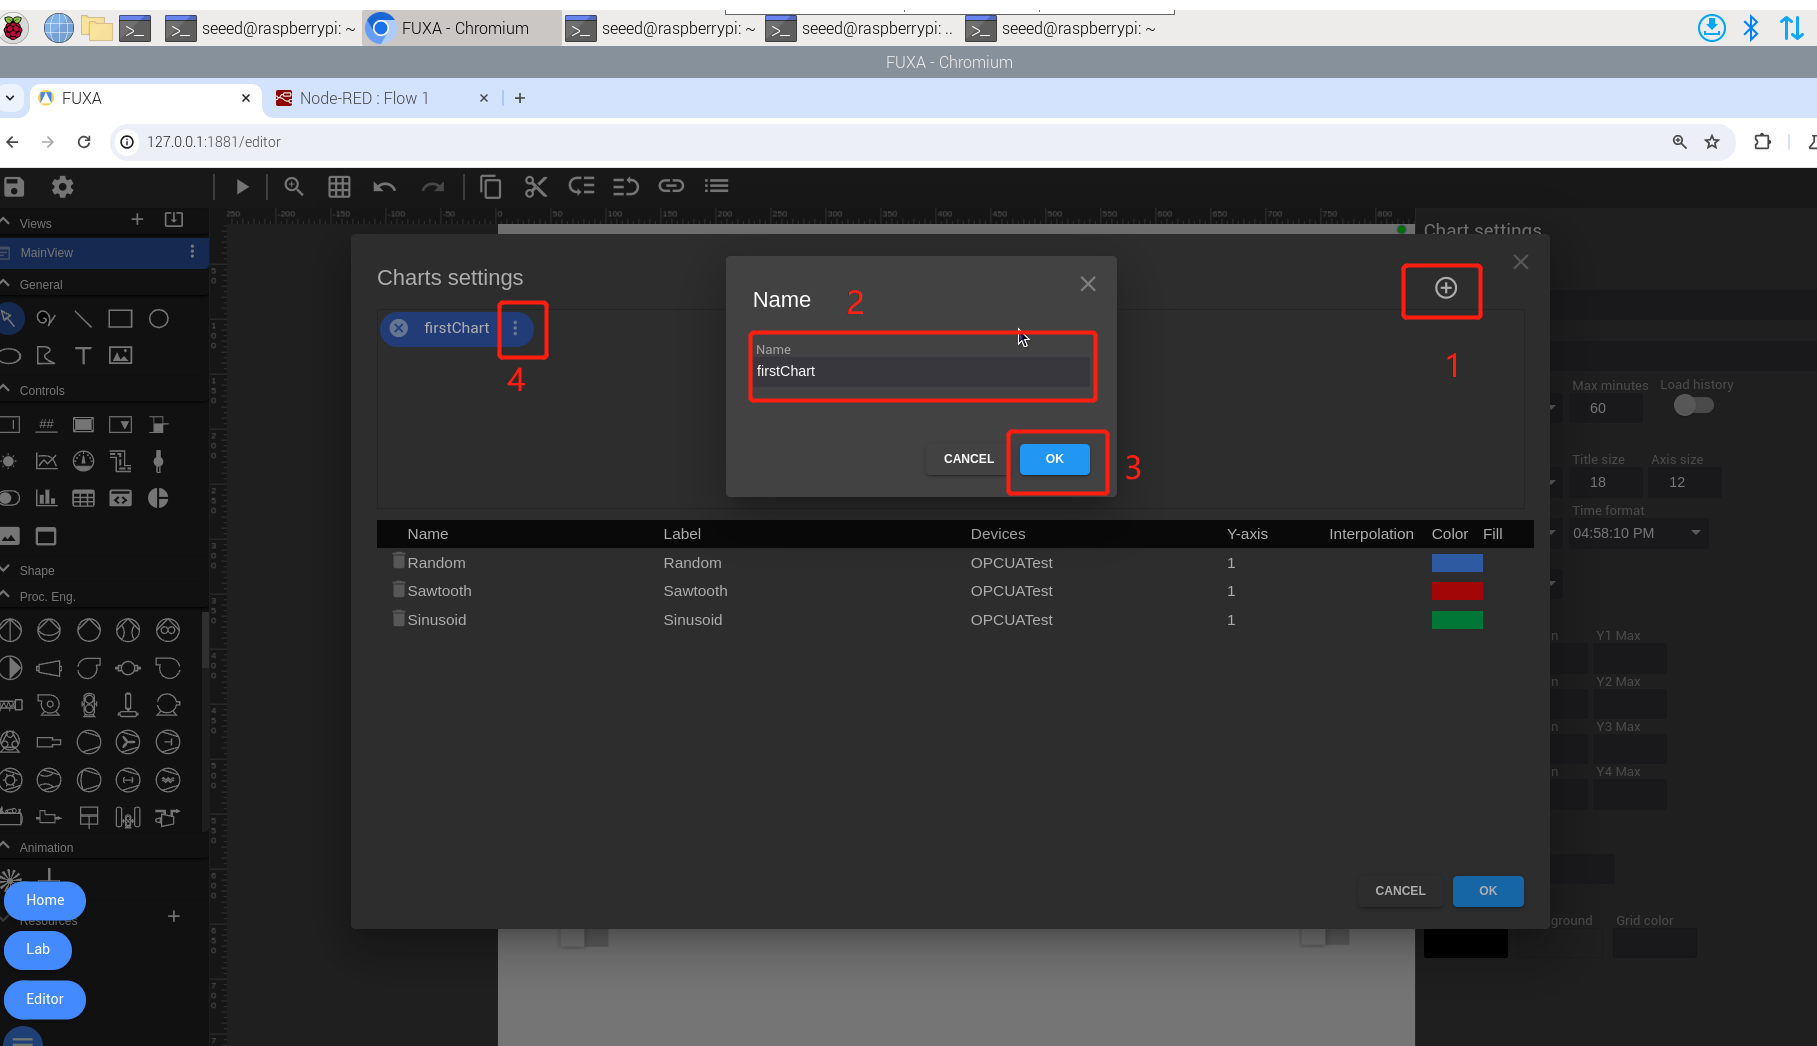
There are curve charts and histograms available in fuxa. Take the curve chart as an example. The properties of Chart are as shown in the figure. You can set the Name、font size、data format、time format、X axis and Y axis styles of Chart and other properties. The most important thing is Chart to show, which determines the data source we want to display and the format of lines.
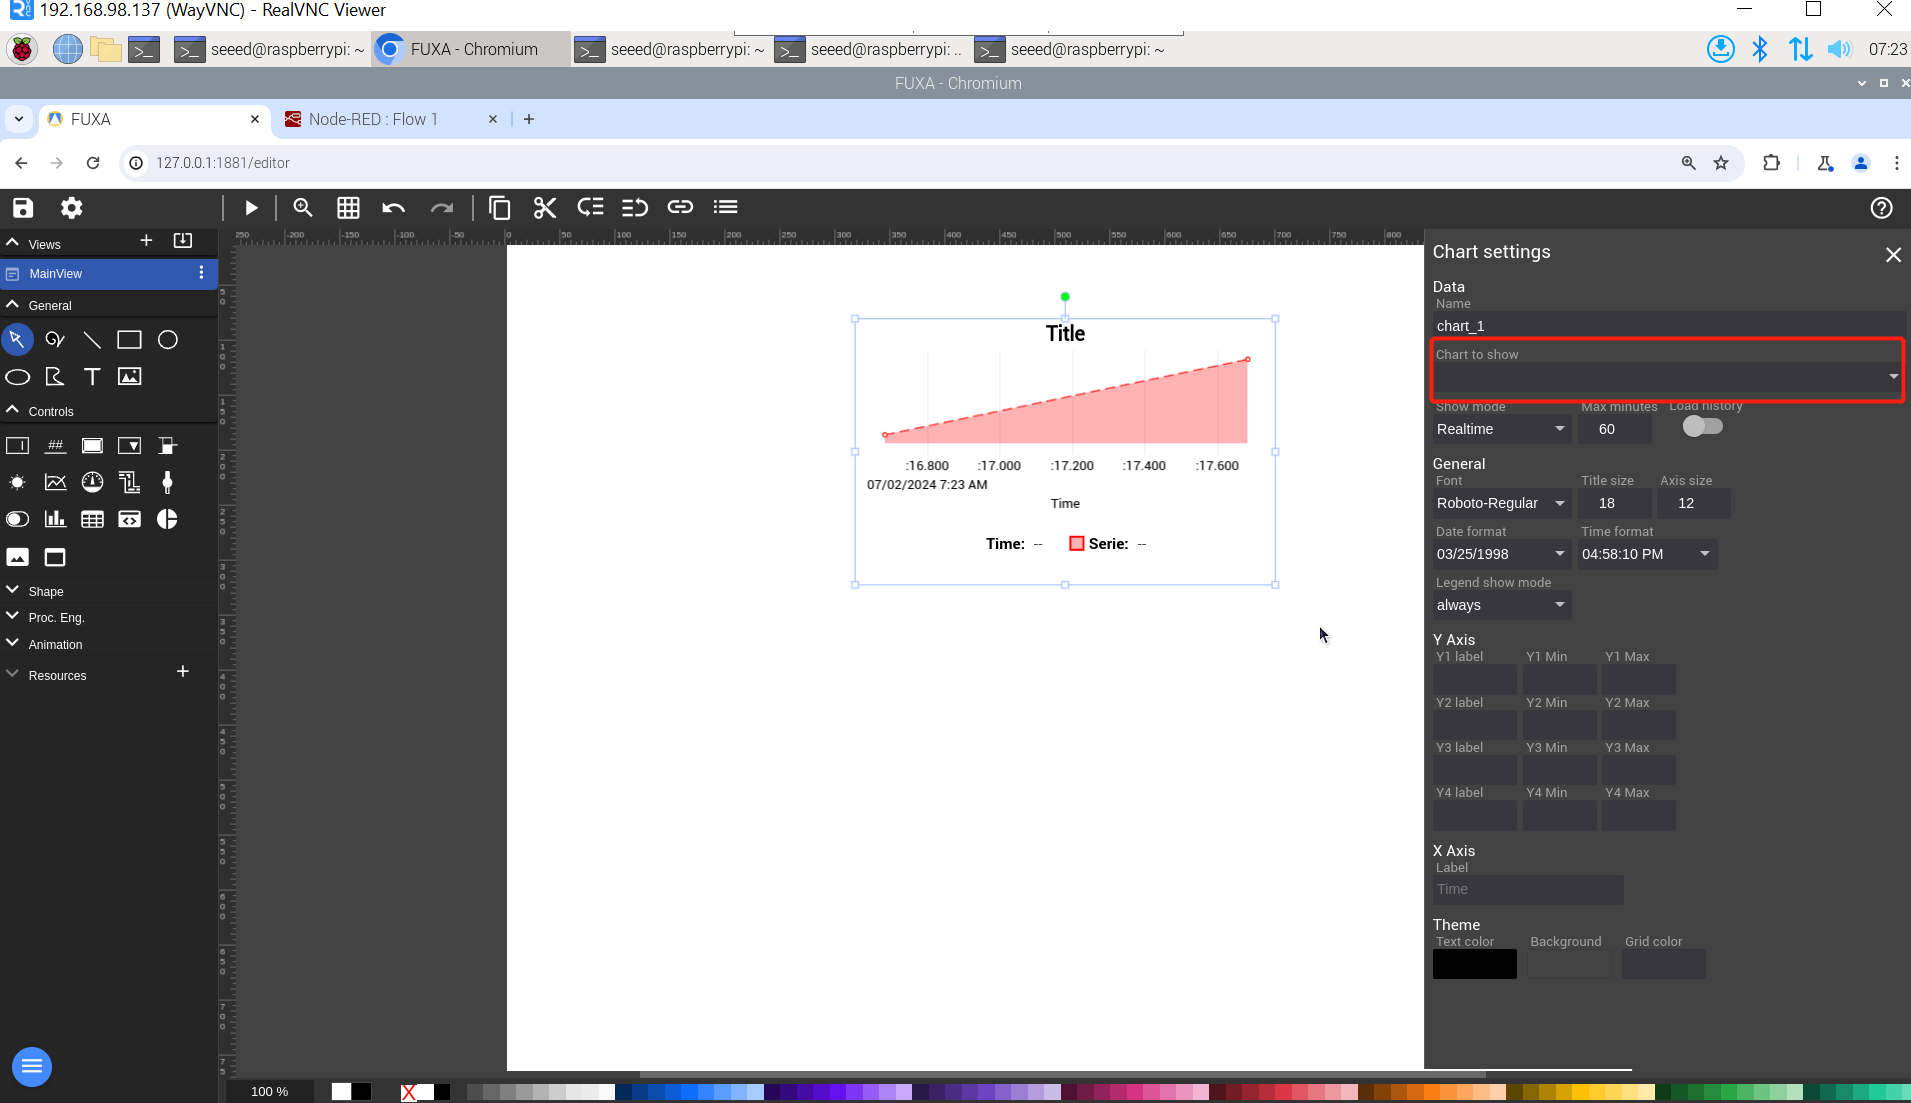
We click Chart to show, then select New Chart, a new pop-up window will appear, click the + button in the upper right corner of the new pop-up window, enter Name, and then click OK, you can successfully create a new line configuration.Then click on the newly created line configuration, then click Add Line, select the data you want to display, and finally click OK, a new curve will appear. Multiple curves can be added through this process. Finally click OK to complete the configuration.
We use Chart here to display data from Prosys OPC UA Simulation Server.You can see that the data is successfully displayed in the form of a graph.

Swich
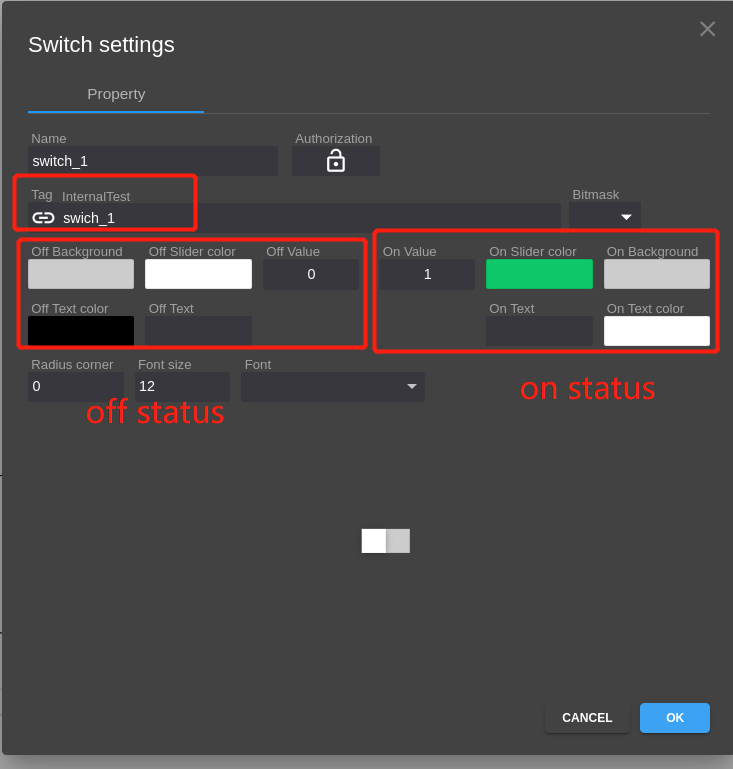
The attributes of the switch are as shown in the figure. We select a boolean data named swich_1 as the swich state. You can configure the display state of the swich when it is on or off, including color configuration, text display, etc.

Shape
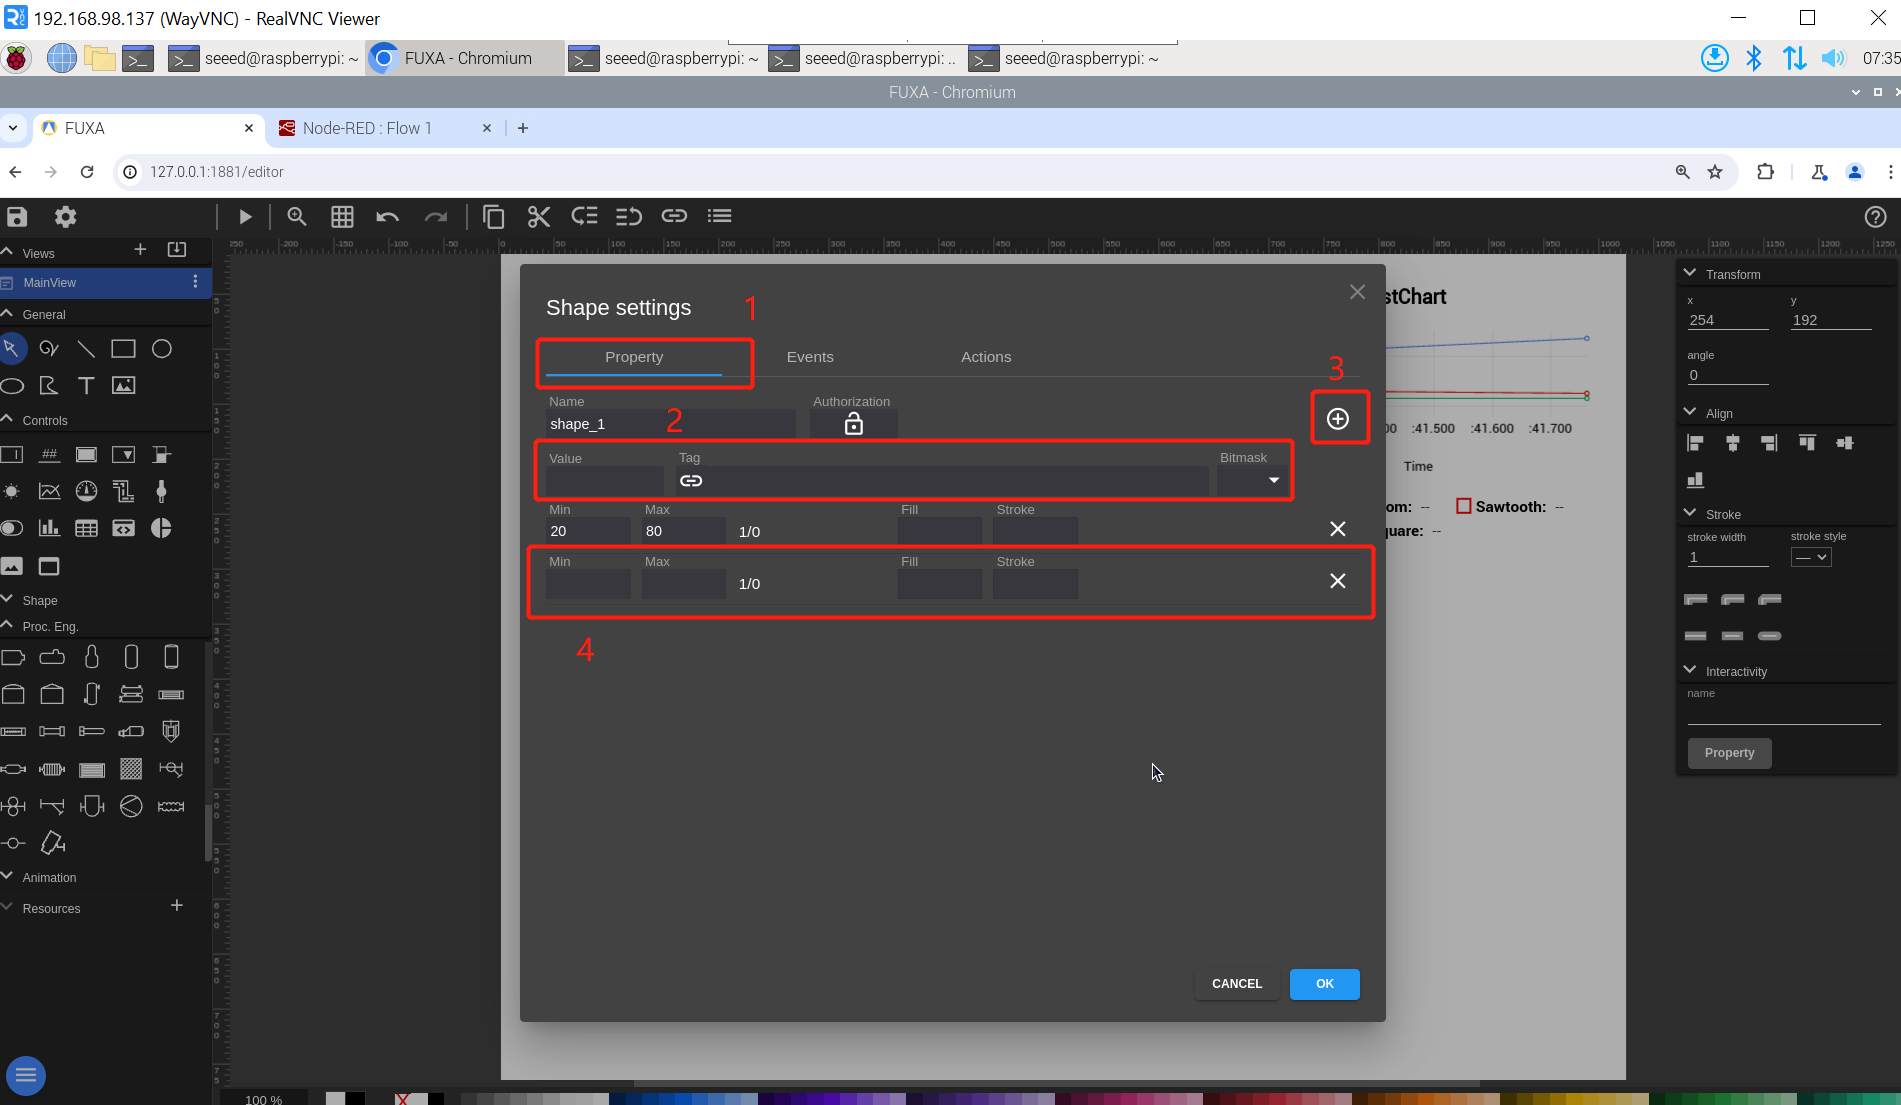
Fuxa provides a variety of shape for users to draw industrial visualization interfaces. Each shape has three attributes, namely Property, Events, and Actions.
Among them, Property is mainly used to configure the color of shape. By binding a Tag, shape displays different colors according to the change of the Tag value. You can click the + in the upper right corner to set different colors.
Here we take a warehouse pattern as an example, filling its color with Property.
Events mainly has two contents, Type represents the event type, and Action represents the action after the event is triggered.
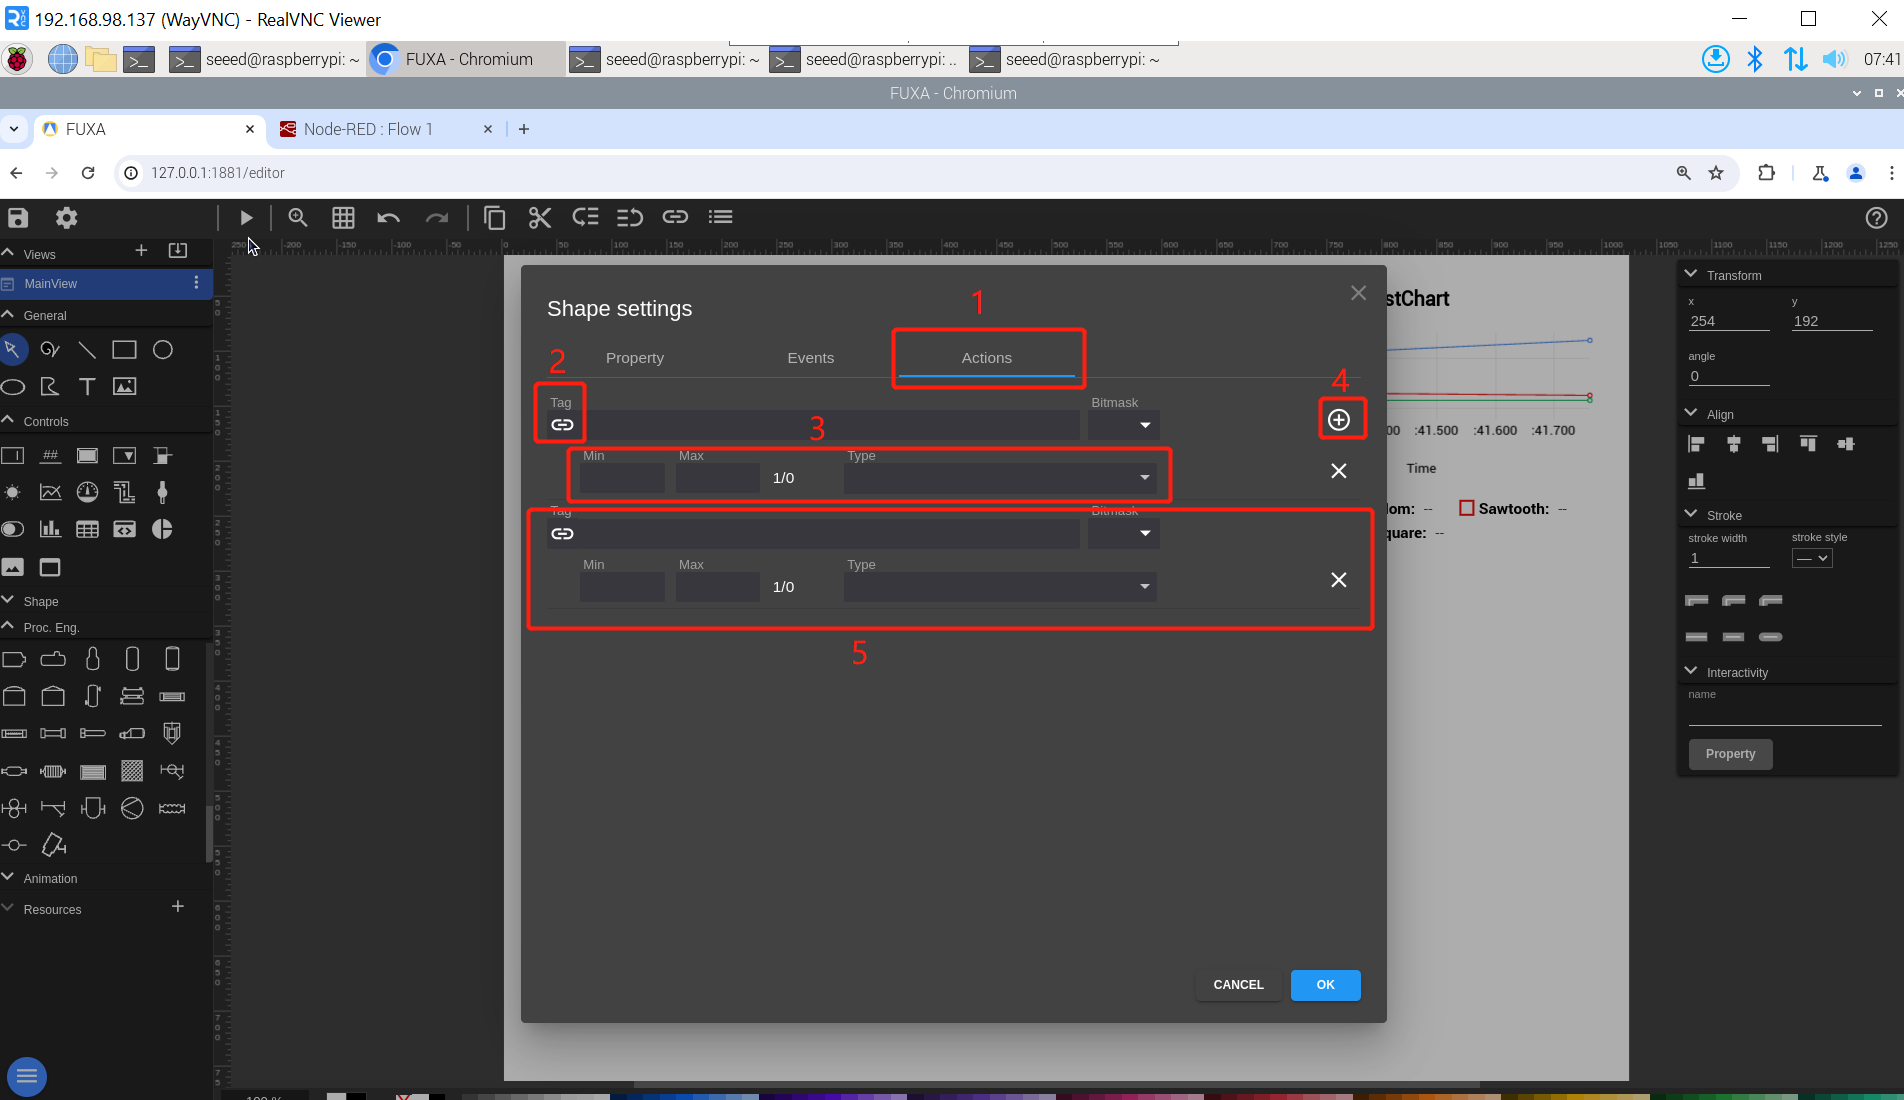
Actions needs to be bound to a Tag, and different Tag values can trigger different actions. Set the values of Min and Max, and then select the desired action in the Type option. When the Tag data reaches the interval between Min and Max, the corresponding action will be triggered.
Here we take a warehouse pattern as an example, controlling its rotation and stopping through Actions.
Pipe
When displaying industrial processes, you can use pipe to represent the flow direction of industrial materials. The properties of the pipe are as shown in the figure.
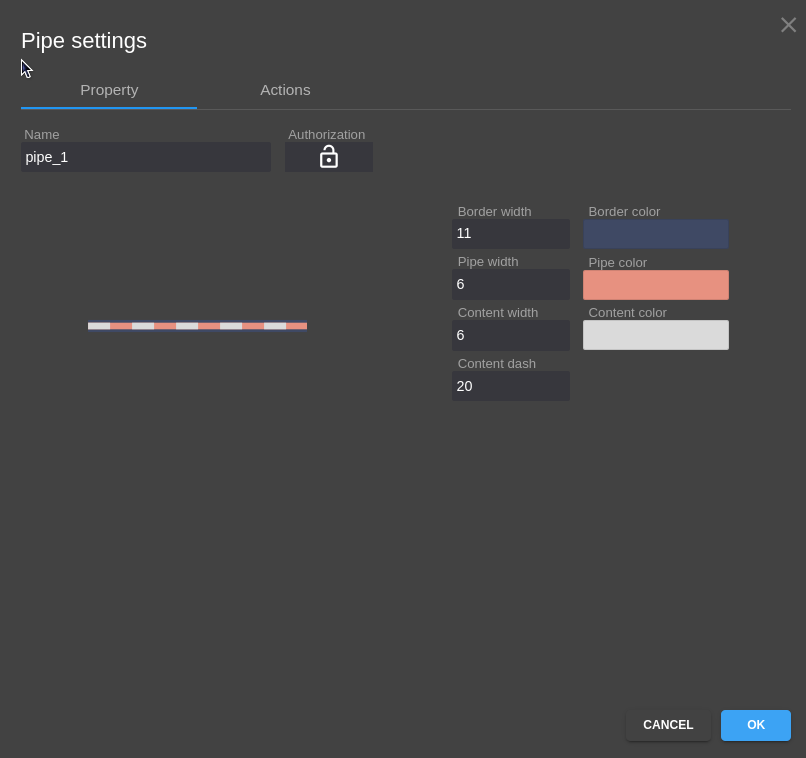
The Property part can set the width, color and other properties of the pipe. Actions also needs to be bound to a Tag. Different tag values allow the pipeline to have different actions. There are four main actions: Stop, Turn clockwise, Turn anticlockwise, and Hide conten. This article shows two actions: Stop and Turn clockwise.

To simulate the industrial process, we added patterns such as two tanks and some pipes.
Circular Gauge
In addition to charts, Circular Gauge can also display data in real time. There are three Circular Gauge available.
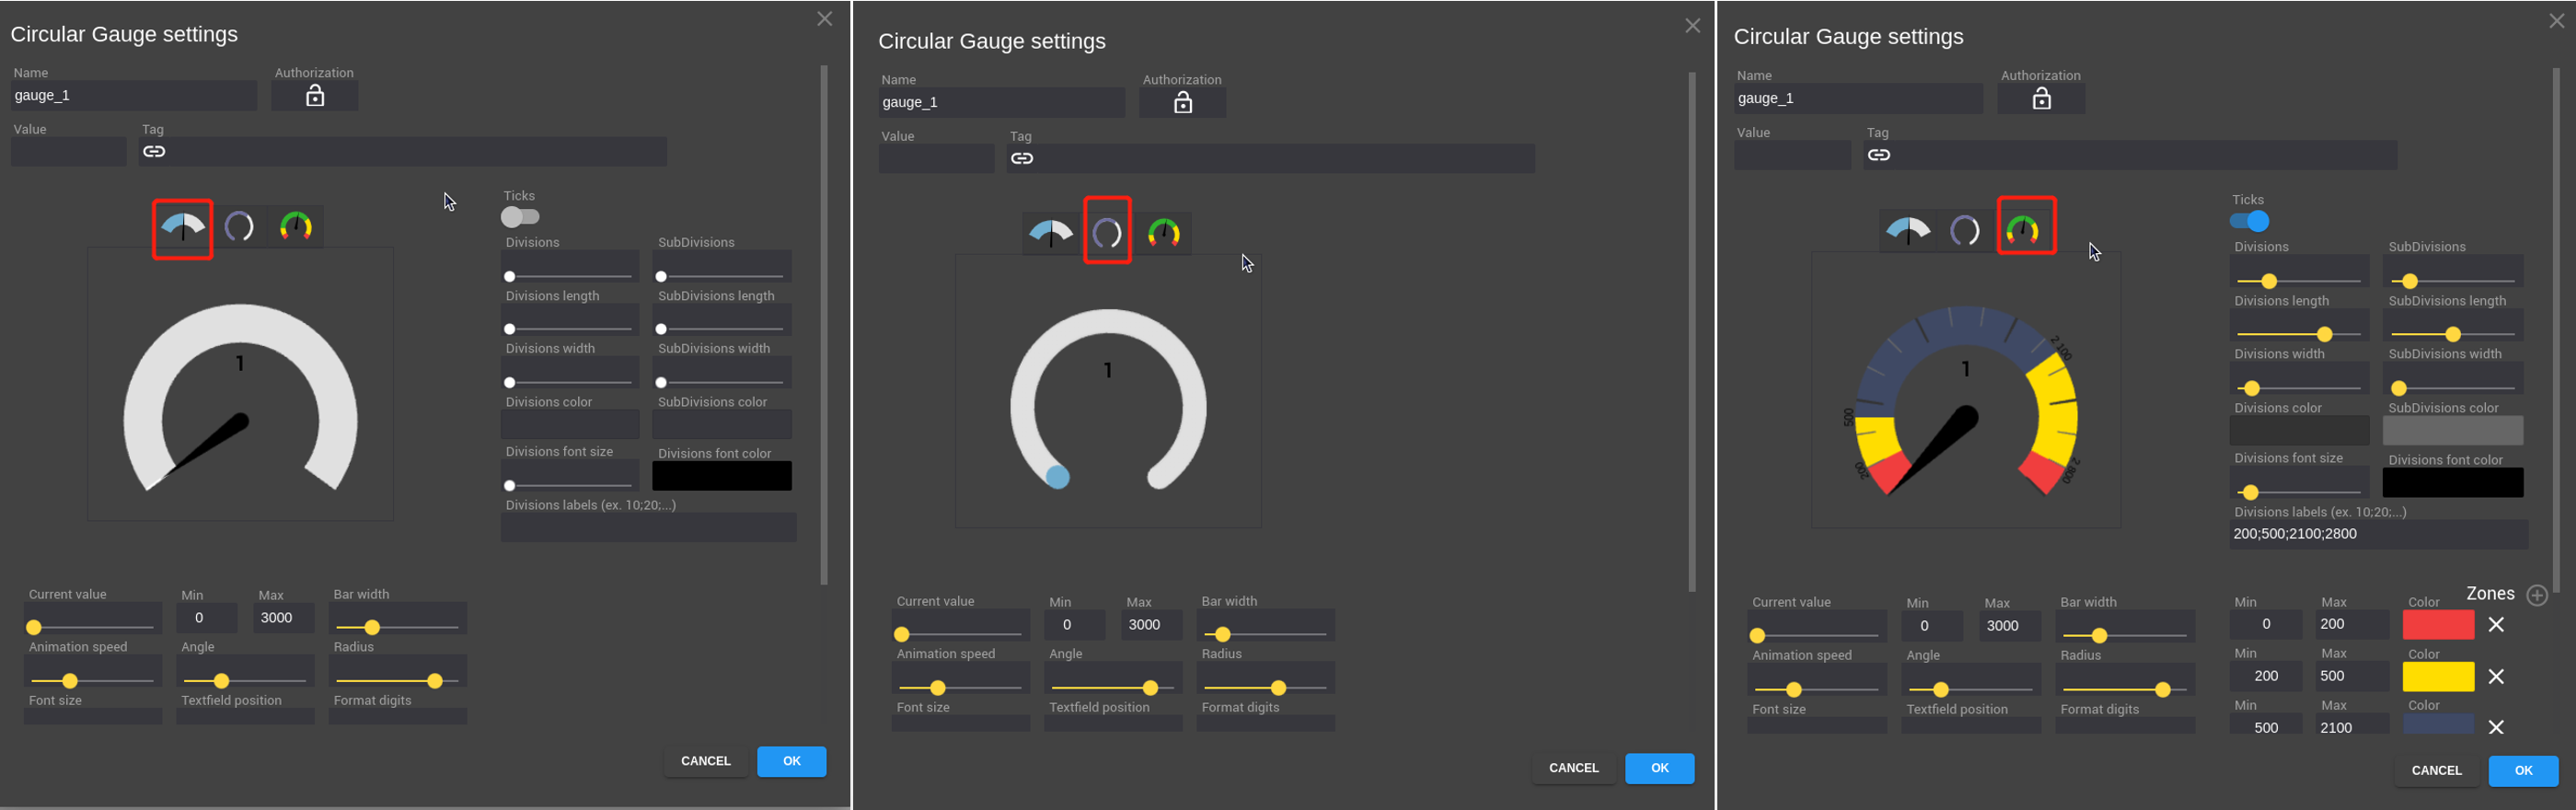
When using it, you need to specify the data to be displayed by binding a Tag. At the same time, you need to specify the maximum range of data that the instrument can display. You can also set attributes such as lines on the instrument panel.Here we select the data of Tank1 in the /dev/fromfuxa topic for display.
After that, the data of Tank2 and Tank3 are also displayed through the Circular Gauge to indicate the current capacity of each tank.

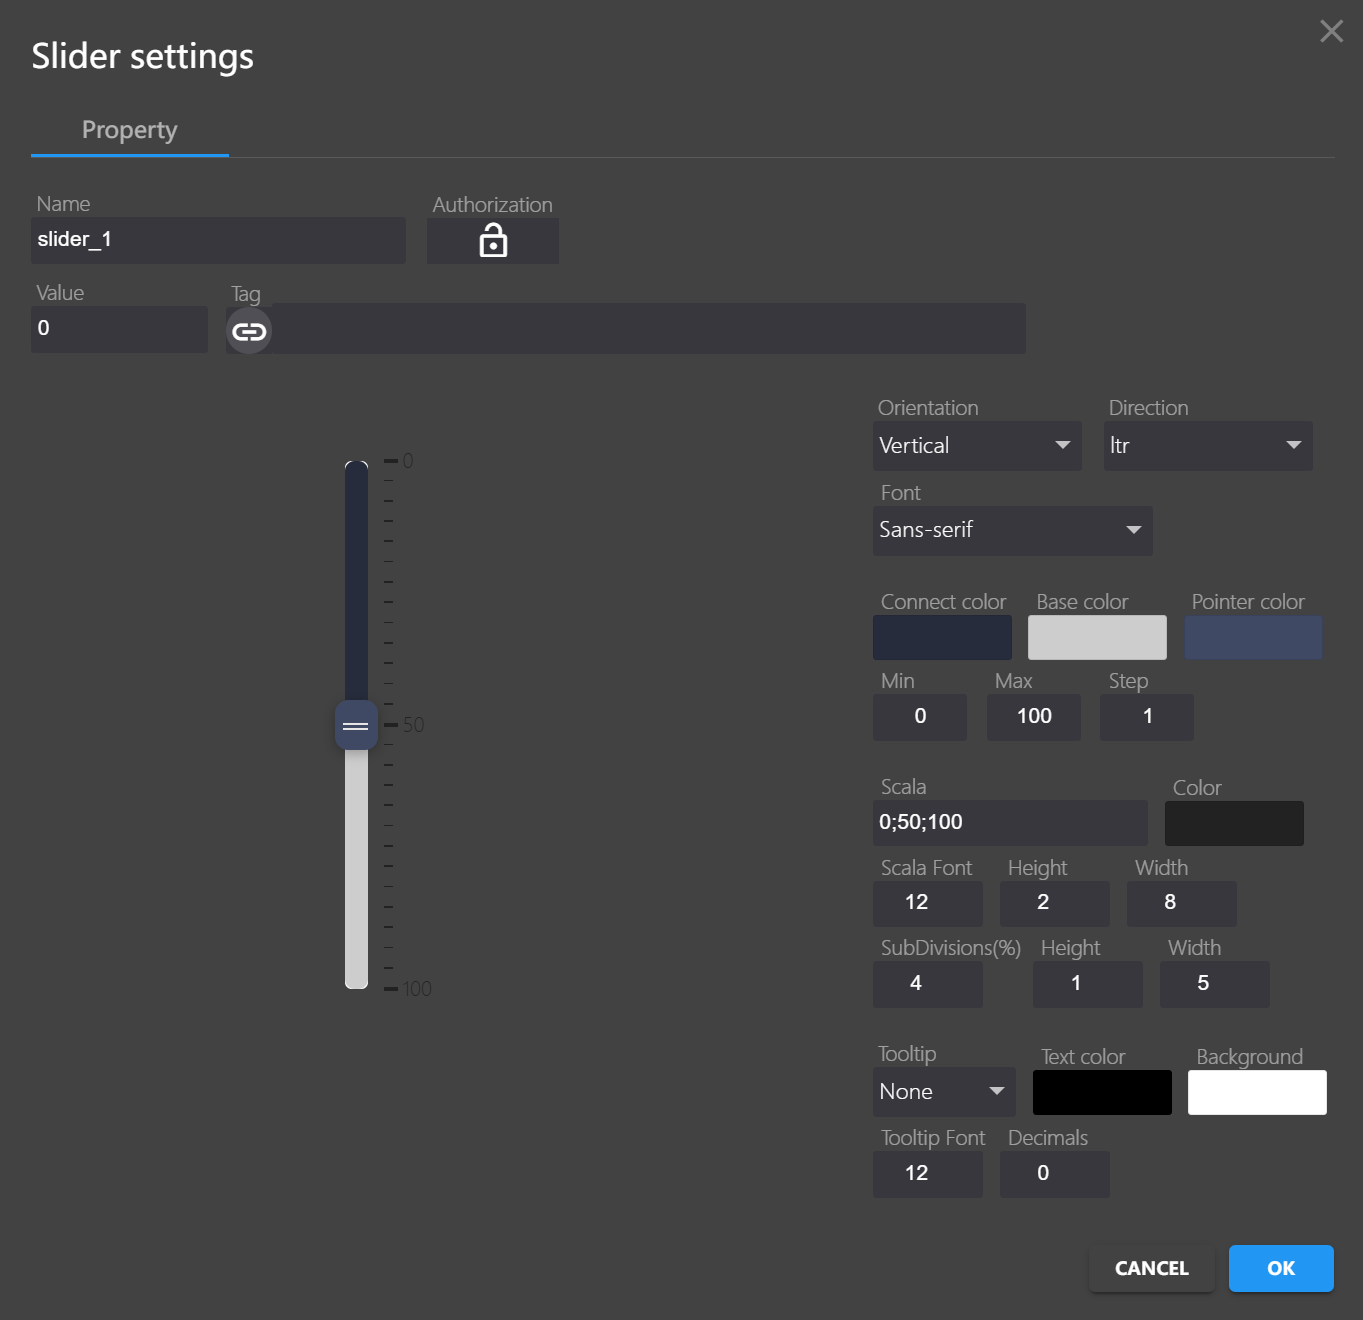
Slider
Use the slider to adjust variables such as flow、pressure.etc. Its properties are as shown in the figure. You can set its color and format. When using it, you need to bind a Tag. Then the slider can adjust the value of the Tag in real time. Here we bind a custom Flow control 1 tag
Alarm
In the industrial process, excessive certain parameters (such as pressure) may cause some dangers. At this time, an alarm is needed to remind the staff that there may be some problems here. Fuxa supports real-time monitoring of a certain value and triggers an alarm when the value reaches a certain dangerous range. By default, fuxa's interface does not open the alarm bar. You need to set it up to open the alarm bar.
After the alarm bar is opened, you can set the alarm. Click the settings button in the upper left corner, then click Alarms, and then click + in the new window to display the alarm settings window. At this time, a Tag needs to be bound, and the system will monitor the value of the Tag. Alarms has four levels, namely High High, High, Low, Message. You can set a Tag value range for each level, and when the Tag value reaches this range,Alerts of the corresponding level will be triggered.
SCADA demo
Tech Support & Product Discussion
Thank you for choosing our products! We are here to provide you with different support to ensure that your experience with our products is as smooth as possible. We offer several communication channels to cater to different preferences and needs.