Create Dynamic IoT Dashboards with ThingsBoard and reComputer R1000
Introduction
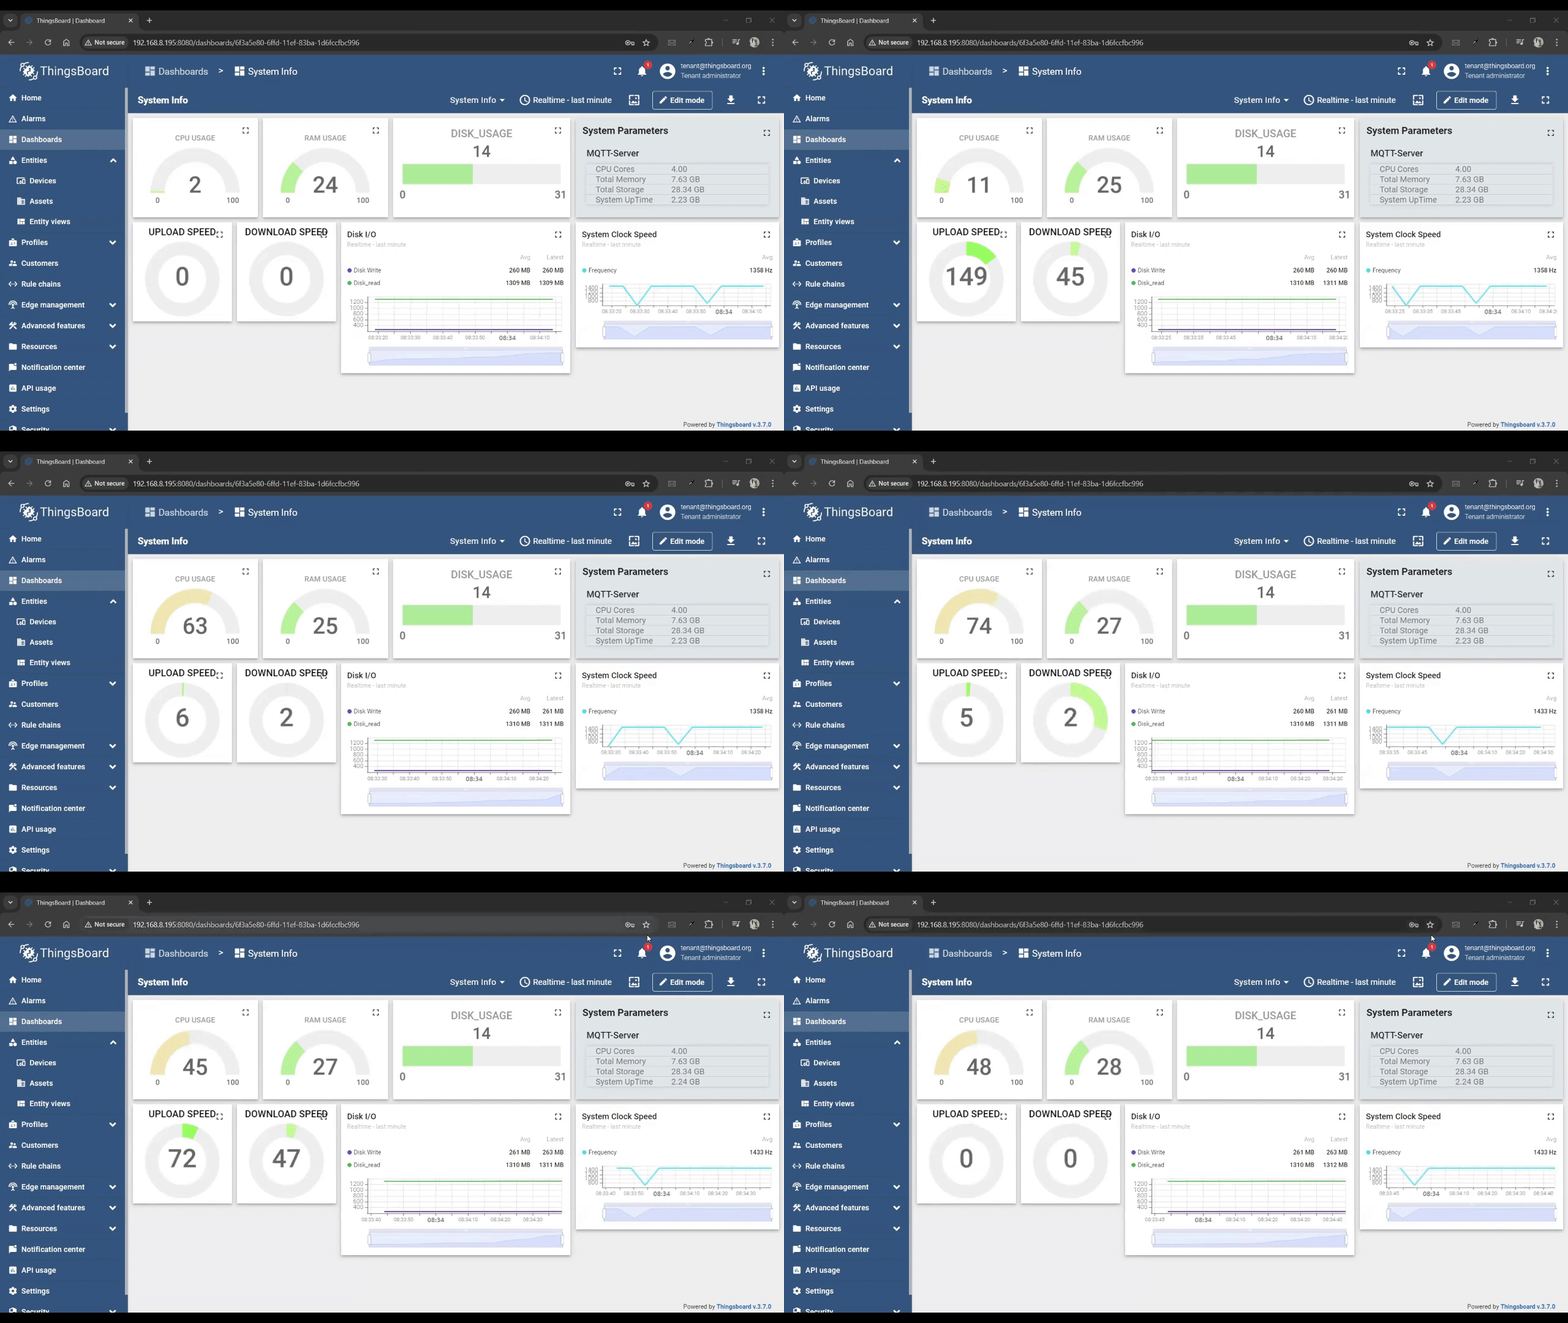
The ThingsBoard Community Edition, an open-source platform, offers powerful features for creating interactive dashboards that stand out among other open-source IoT solutions. With a variety of graphical tools, ThingsBoard allows users to easily visualize and monitor data collected from IoT devices, making it ideal for managing and analyzing real-time data. Whether for industrial automation, smart city projects, or environmental monitoring, ThingsBoard provides a versatile and user-friendly way to track and respond to IoT data insights.
Prerequisites
Hardware
| reComputer R1000 |
|---|
 |
Software
If you're new to ThingsBoard, please ensure it’s installed correctly. Refer to this wiki for guidance.
Login to ThingsBoard
Use the following credentials to log in:
Username: [email protected]
Password: tenant
Step 1: Provision a Device
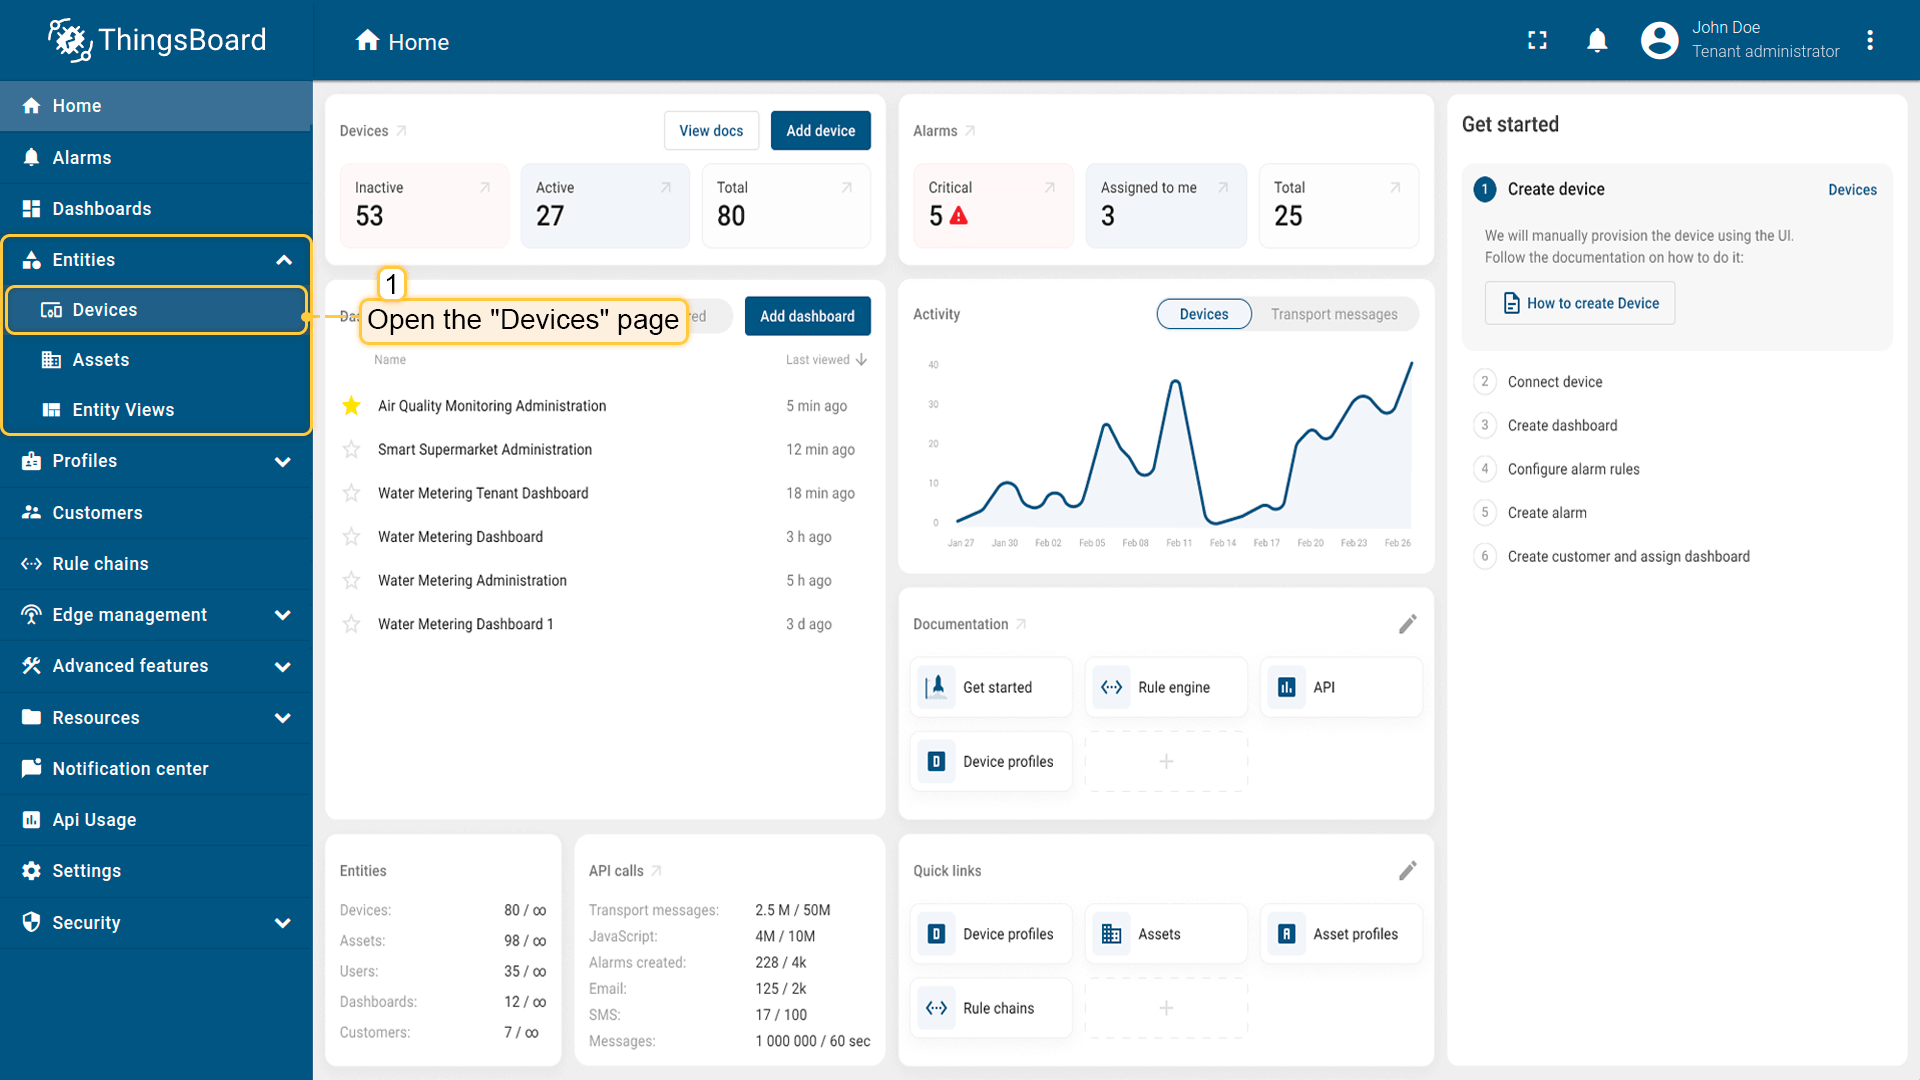
- Navigate to the
Devicespage under theEntitiessection.
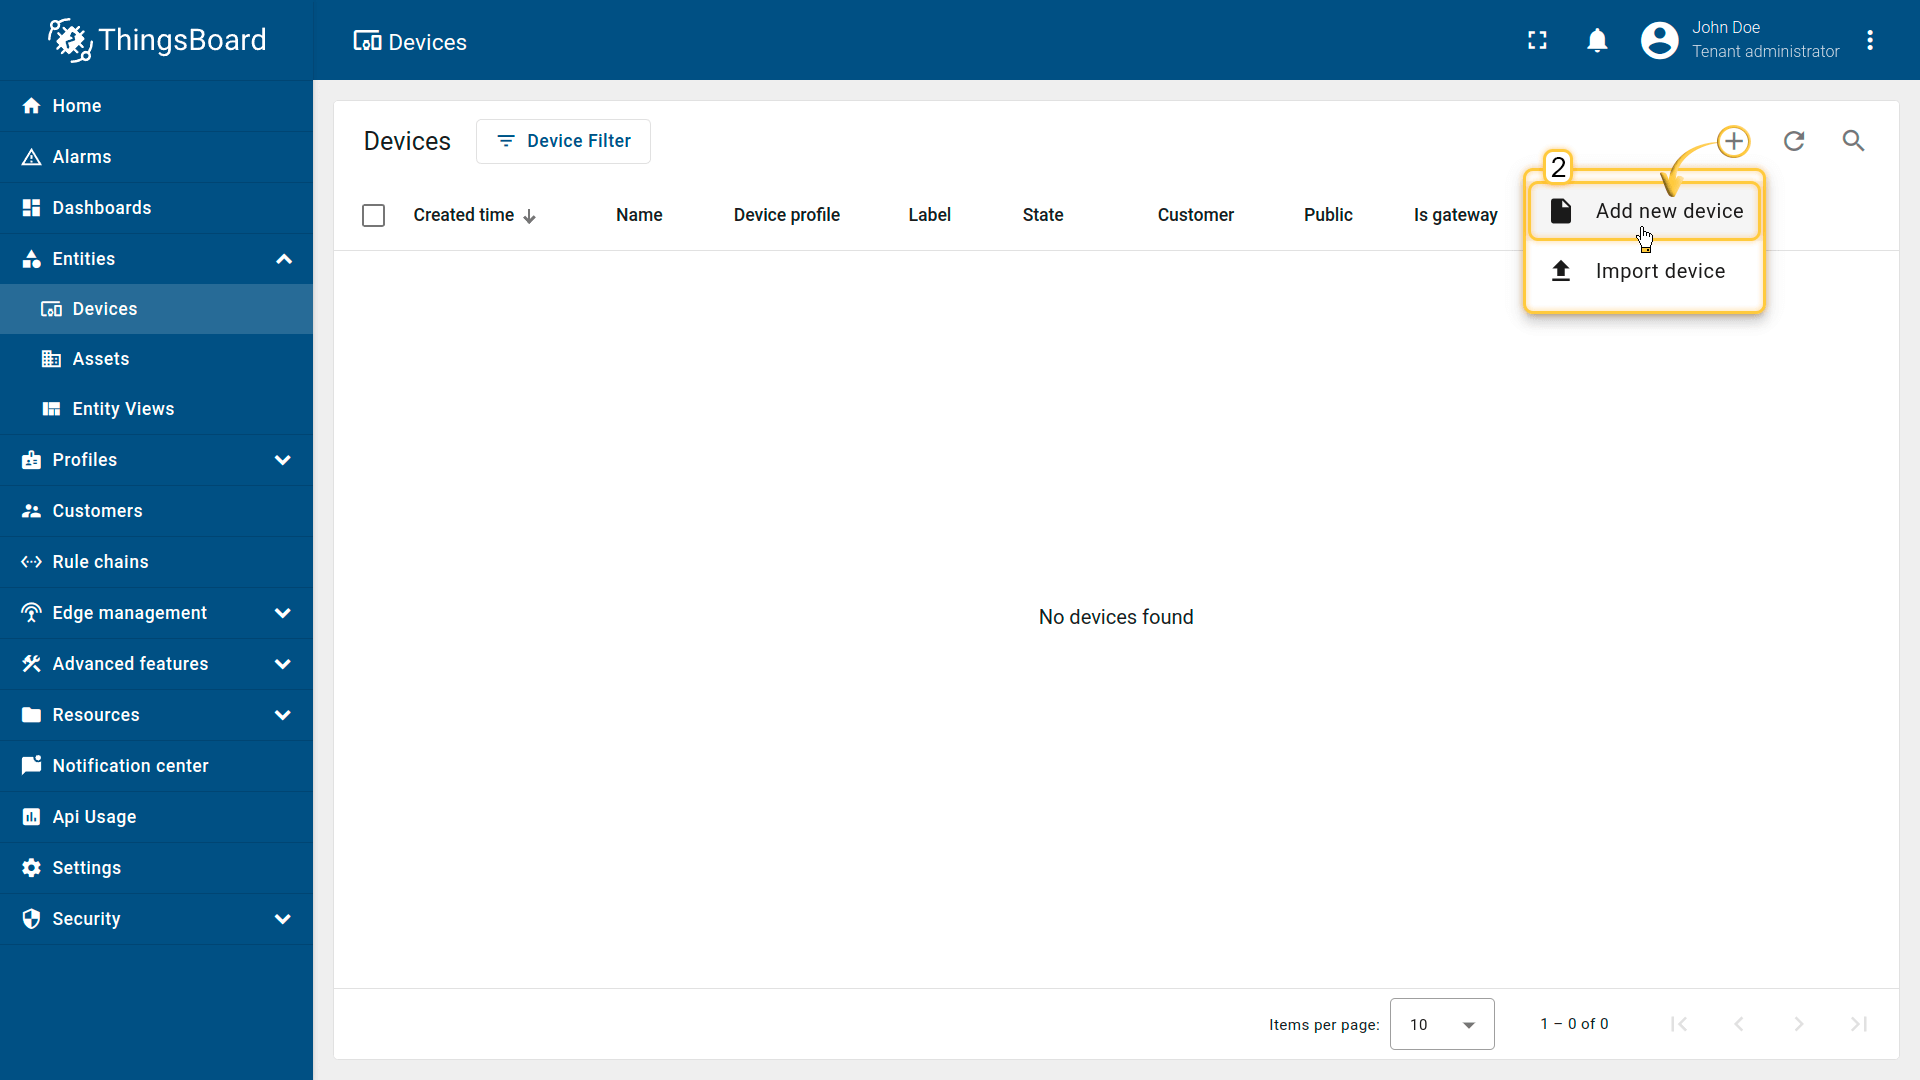
- Click the
+icon in the top right corner of the table and selectAdd new devicefrom the drop-down menu.
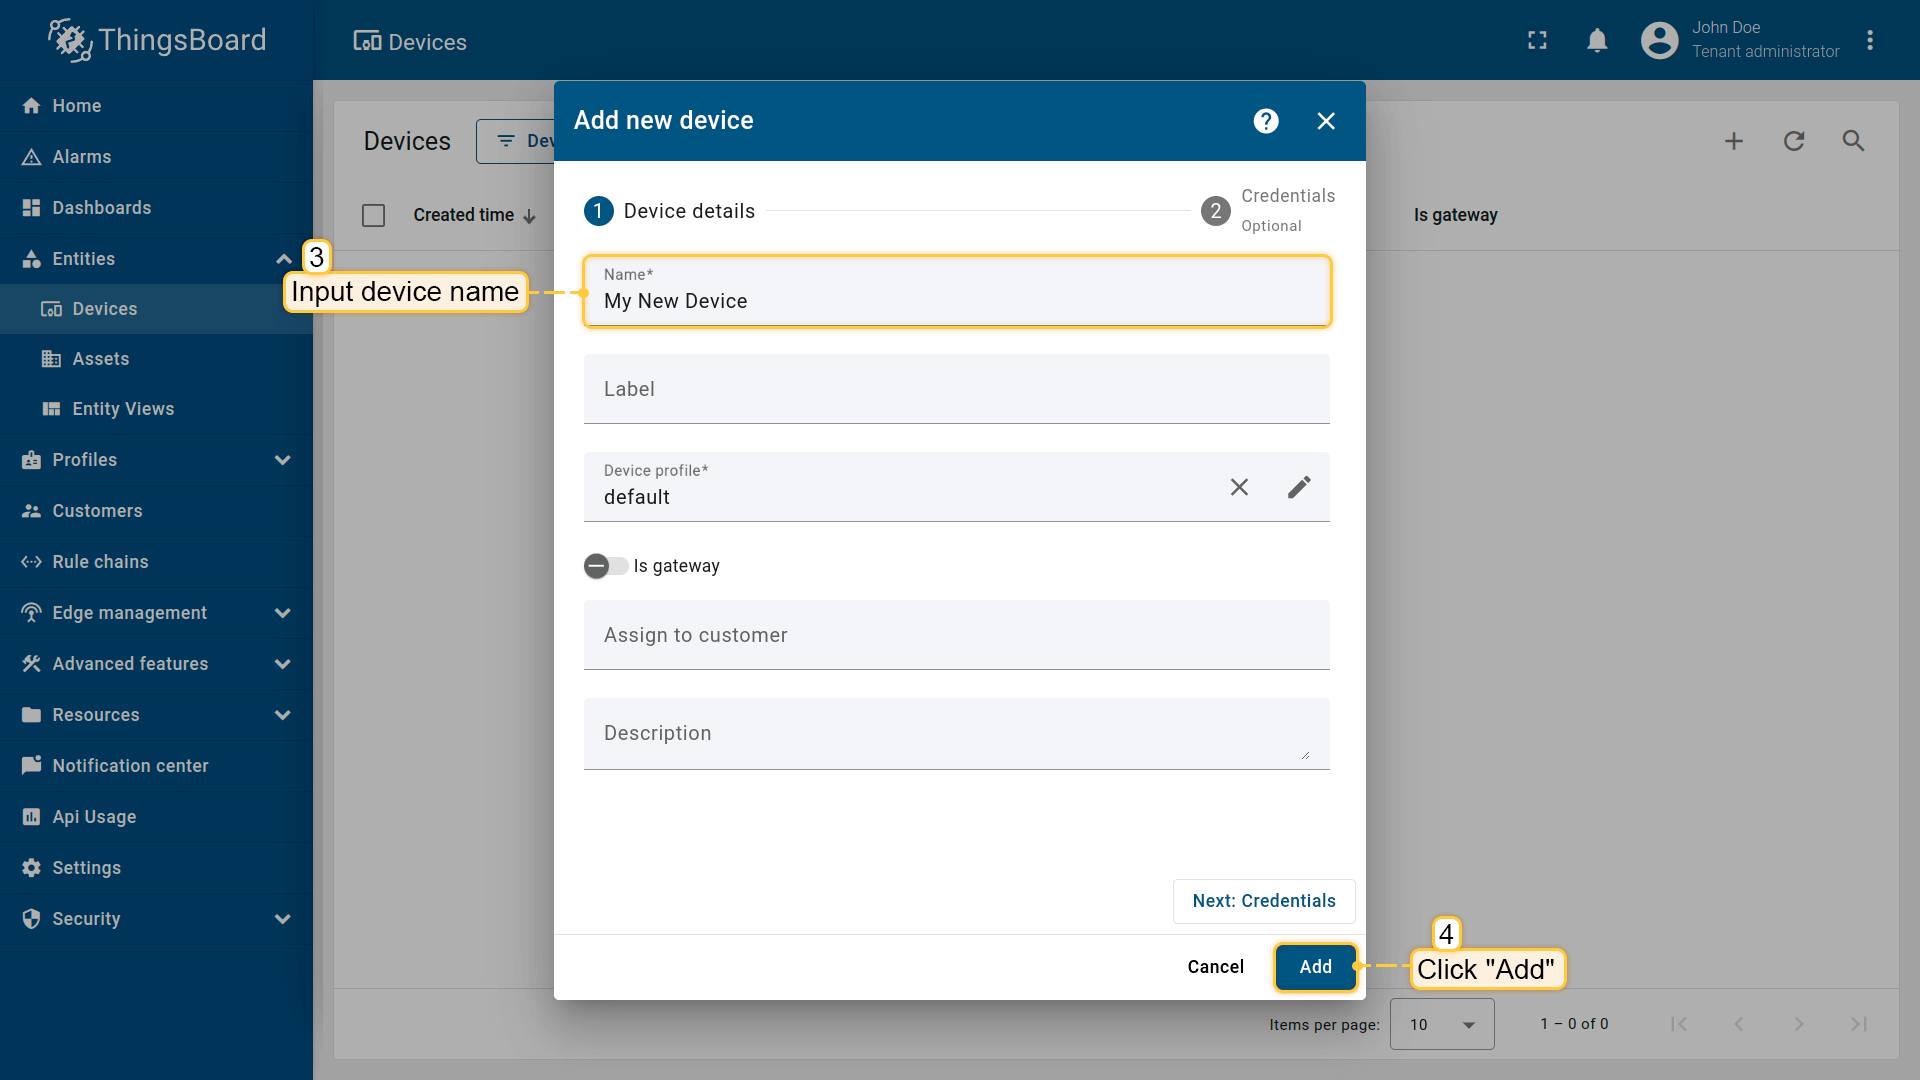
- Enter the device name. Give Client Id, Password, Username. Click
Add.
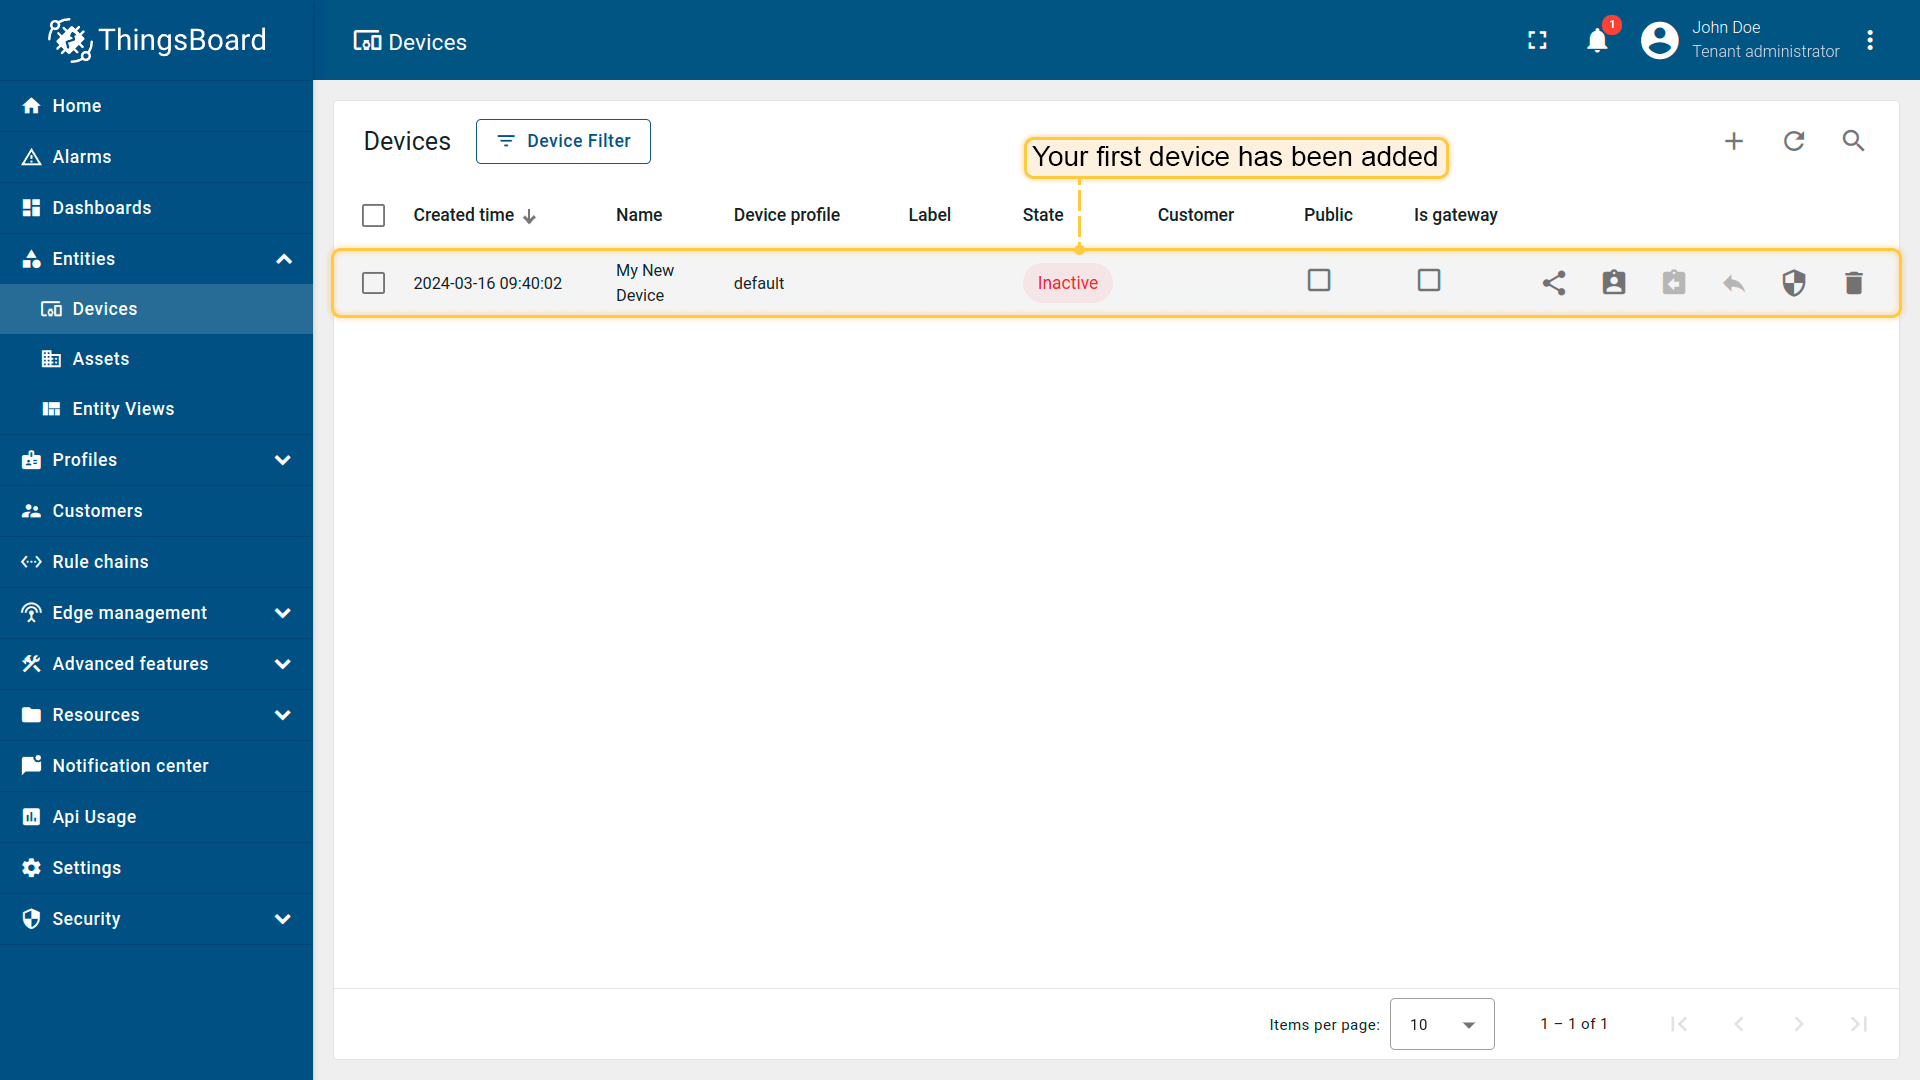
- As you add more devices, they will appear at the top of the table. The table automatically sorts devices by creation time, with the newest ones listed first.
Step 2: Connect the Device
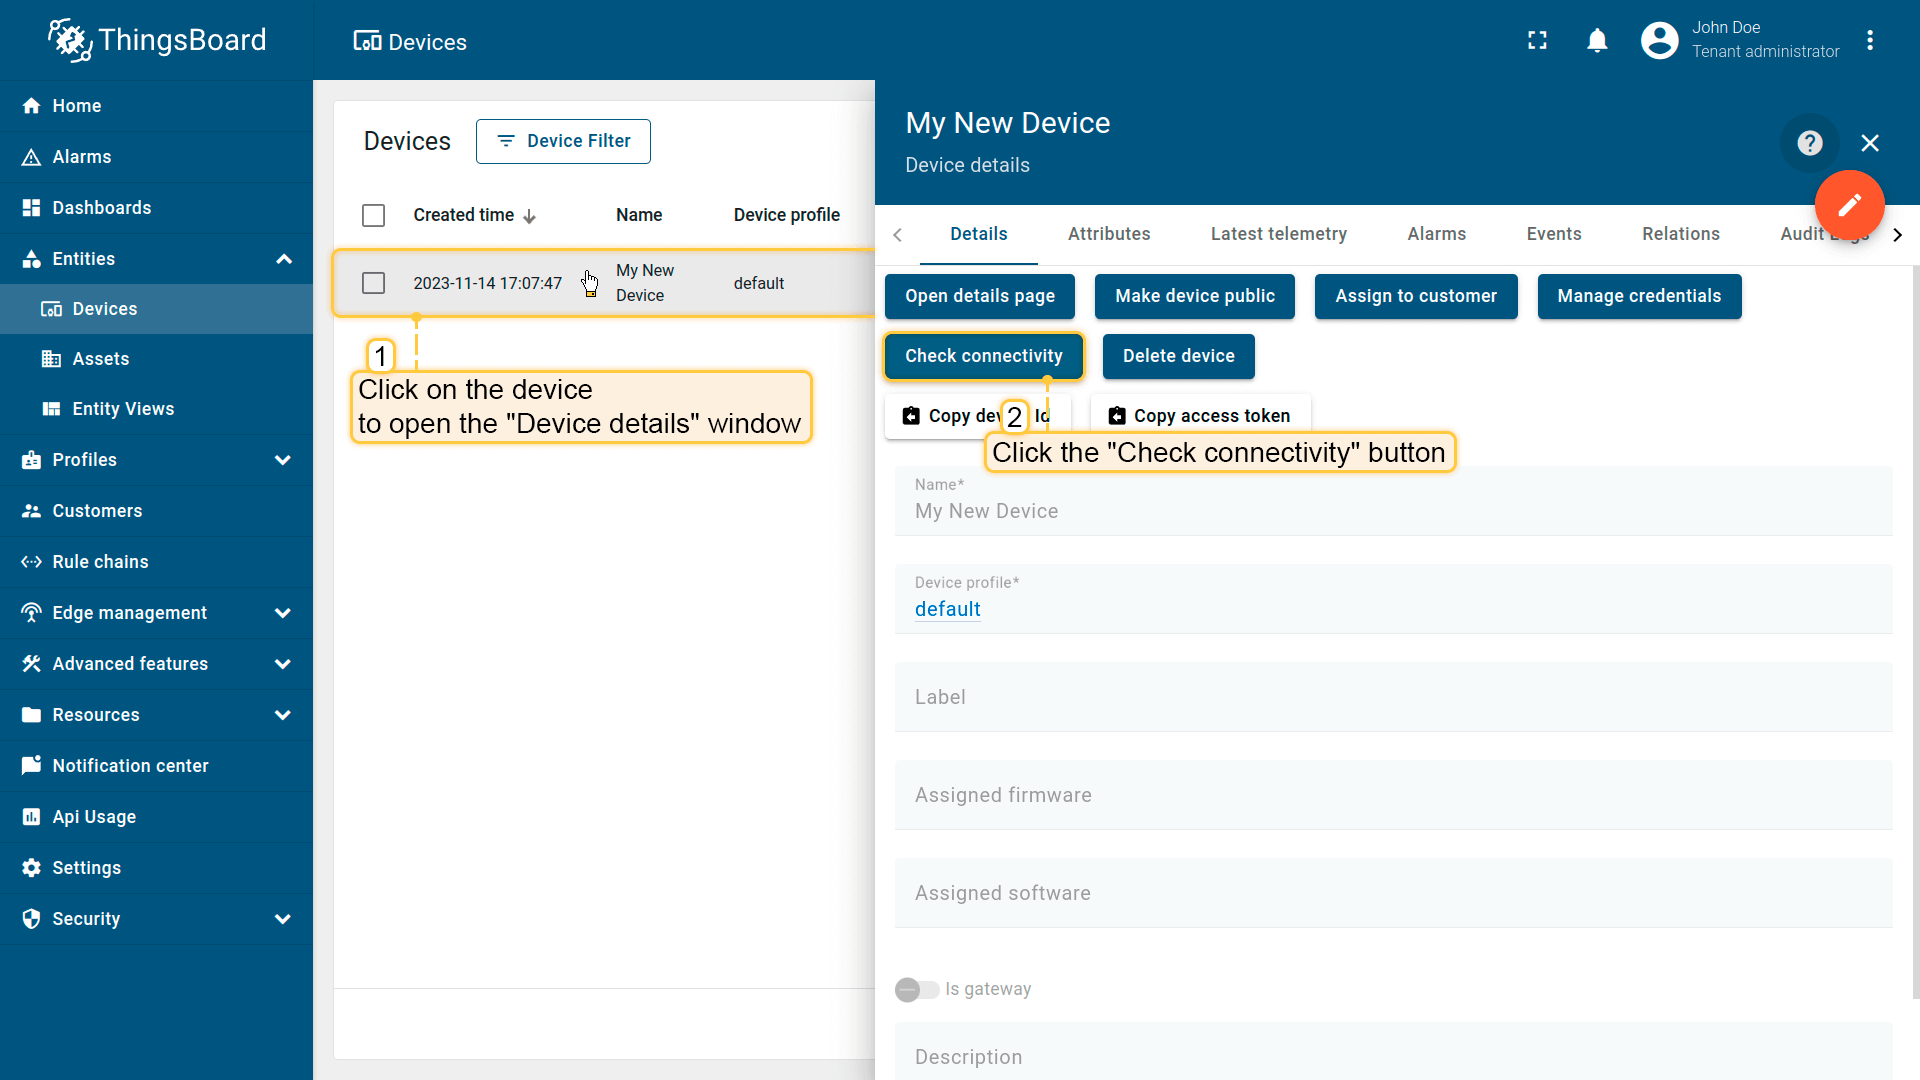
- Click on your device and then click the
Check connectivitybutton in theDevice detailswindow.
- In the opened window, select the messaging protocol and your operating system.
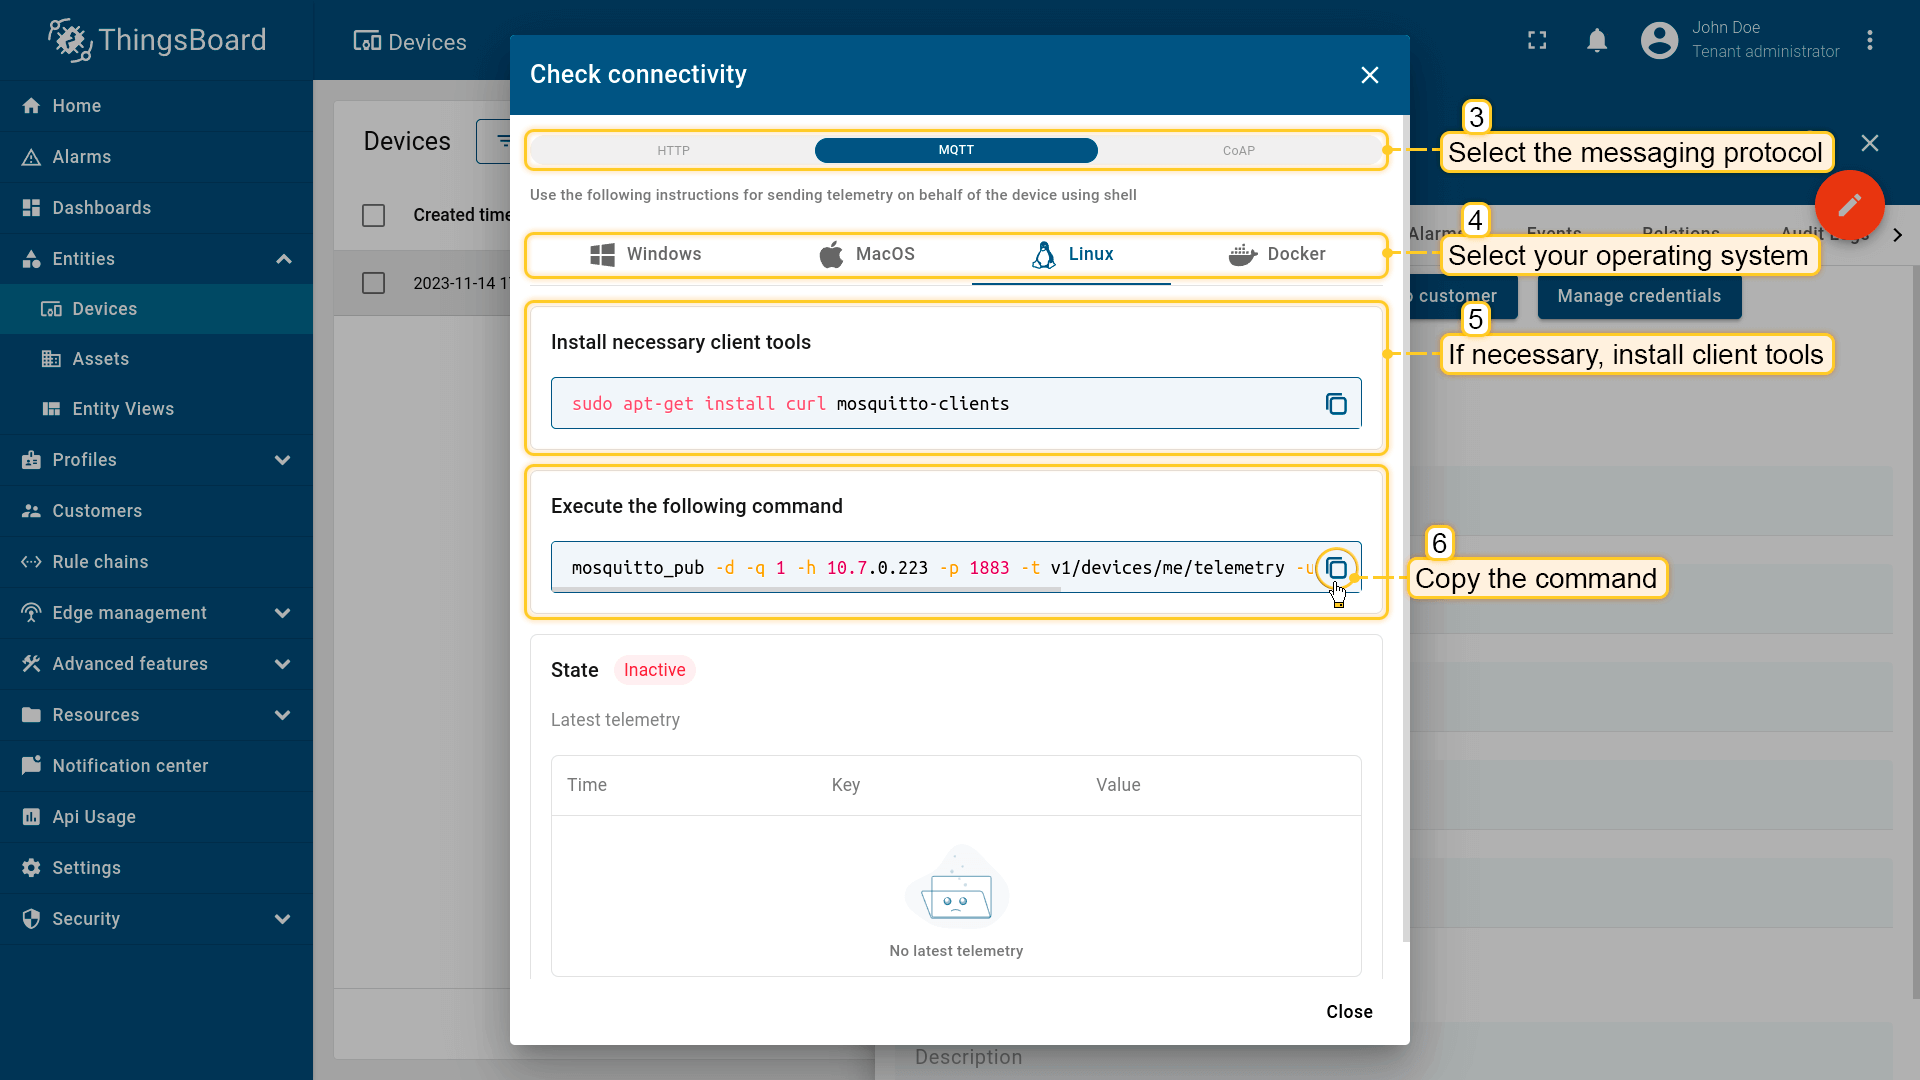
- Install the necessary client tools and copy the provided command.
- Execute the copied command. Once the
temperaturereadings are published successfully, the device state will change from "Inactive" toActive. You will also see the published temperature readings.
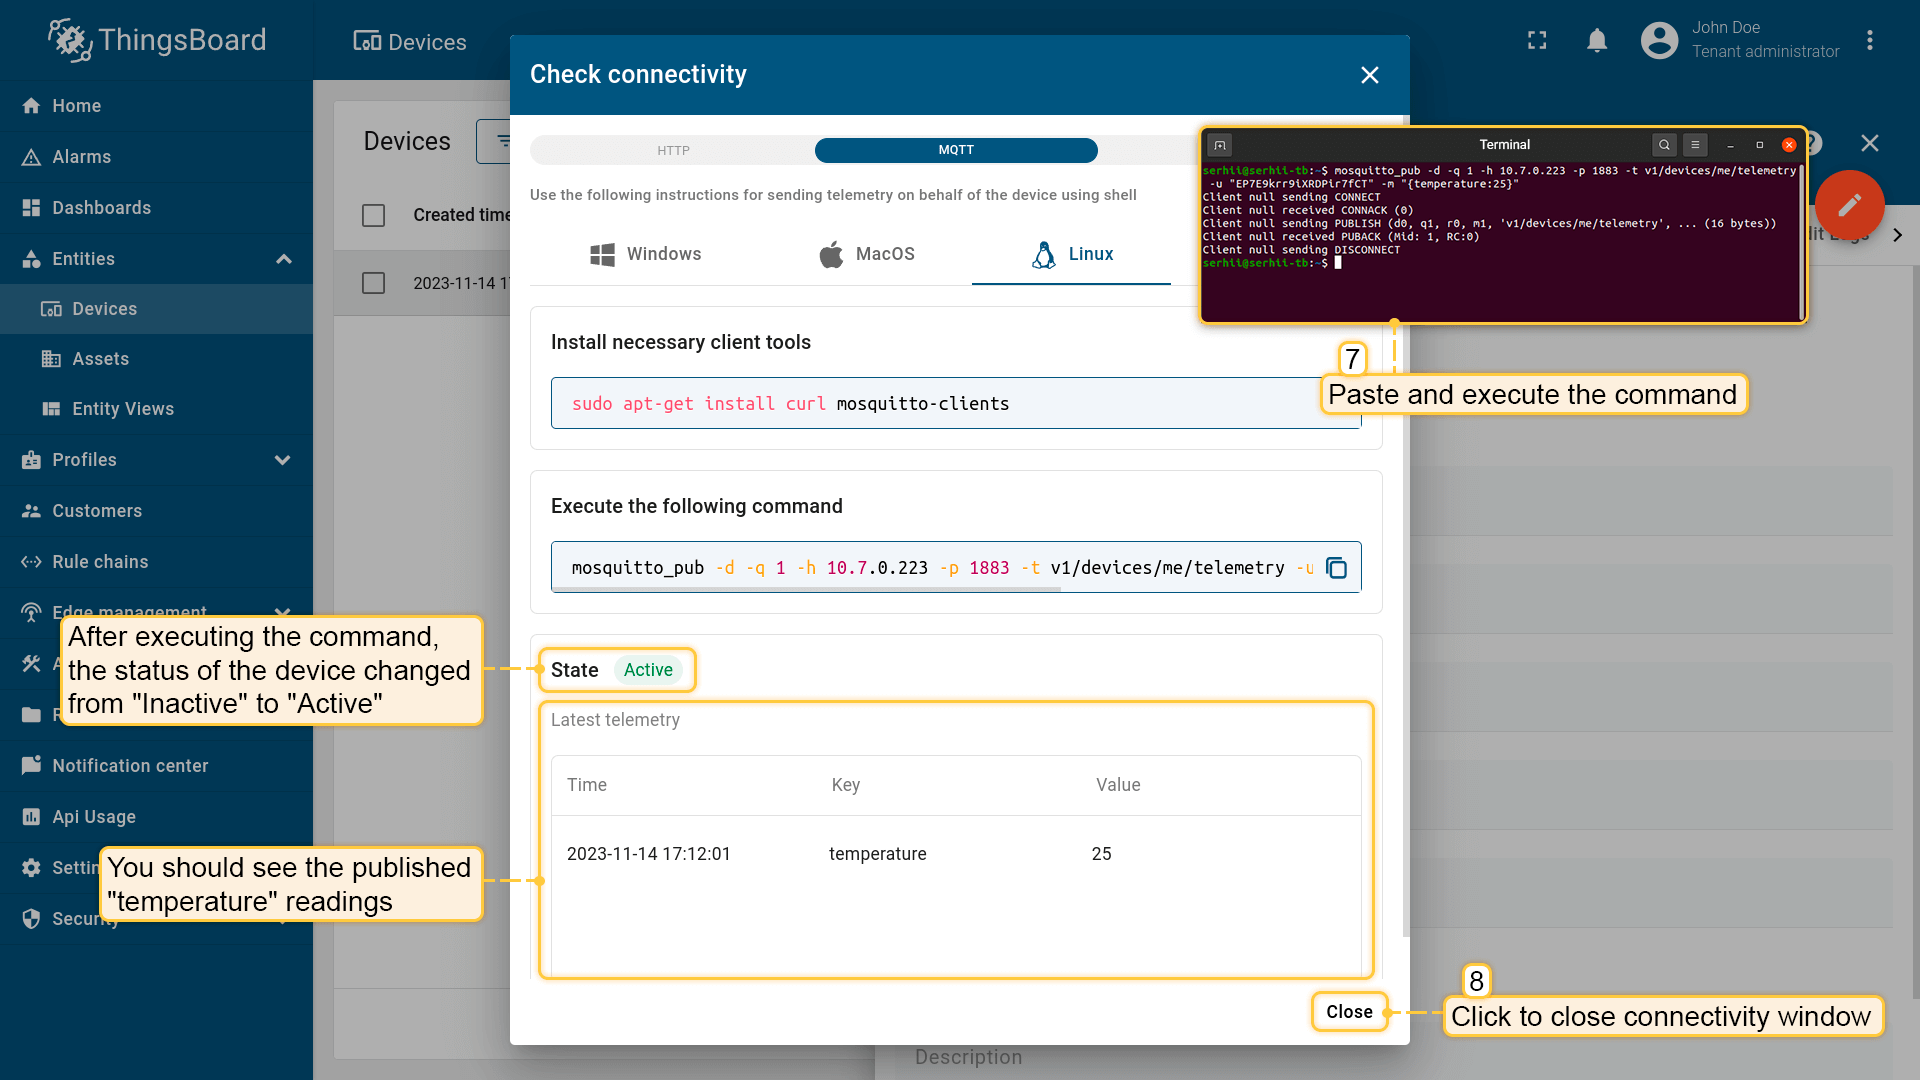
- Close the connectivity window.
Step 3: Configure the MQTT Node in Node-RED
- If you collect data using different protocols like Modbus, BACnet, or OPC UA, you can use Node-RED.
- Open Node-RED and add an
MQTT Outnode. - In the MQTT Out broker setup, configure the
client name, password, broker username, and the IP address of the reComputer. - Use the topic
v1/devices/me/telemetryto send telemetry data.
- If you want to learn more about the MQTT In node, you can explore it further.
You do not need to install the Mosquitto broker on the reComputer.
Step 4: Create a Dashboard
Create an Empty Dashboard
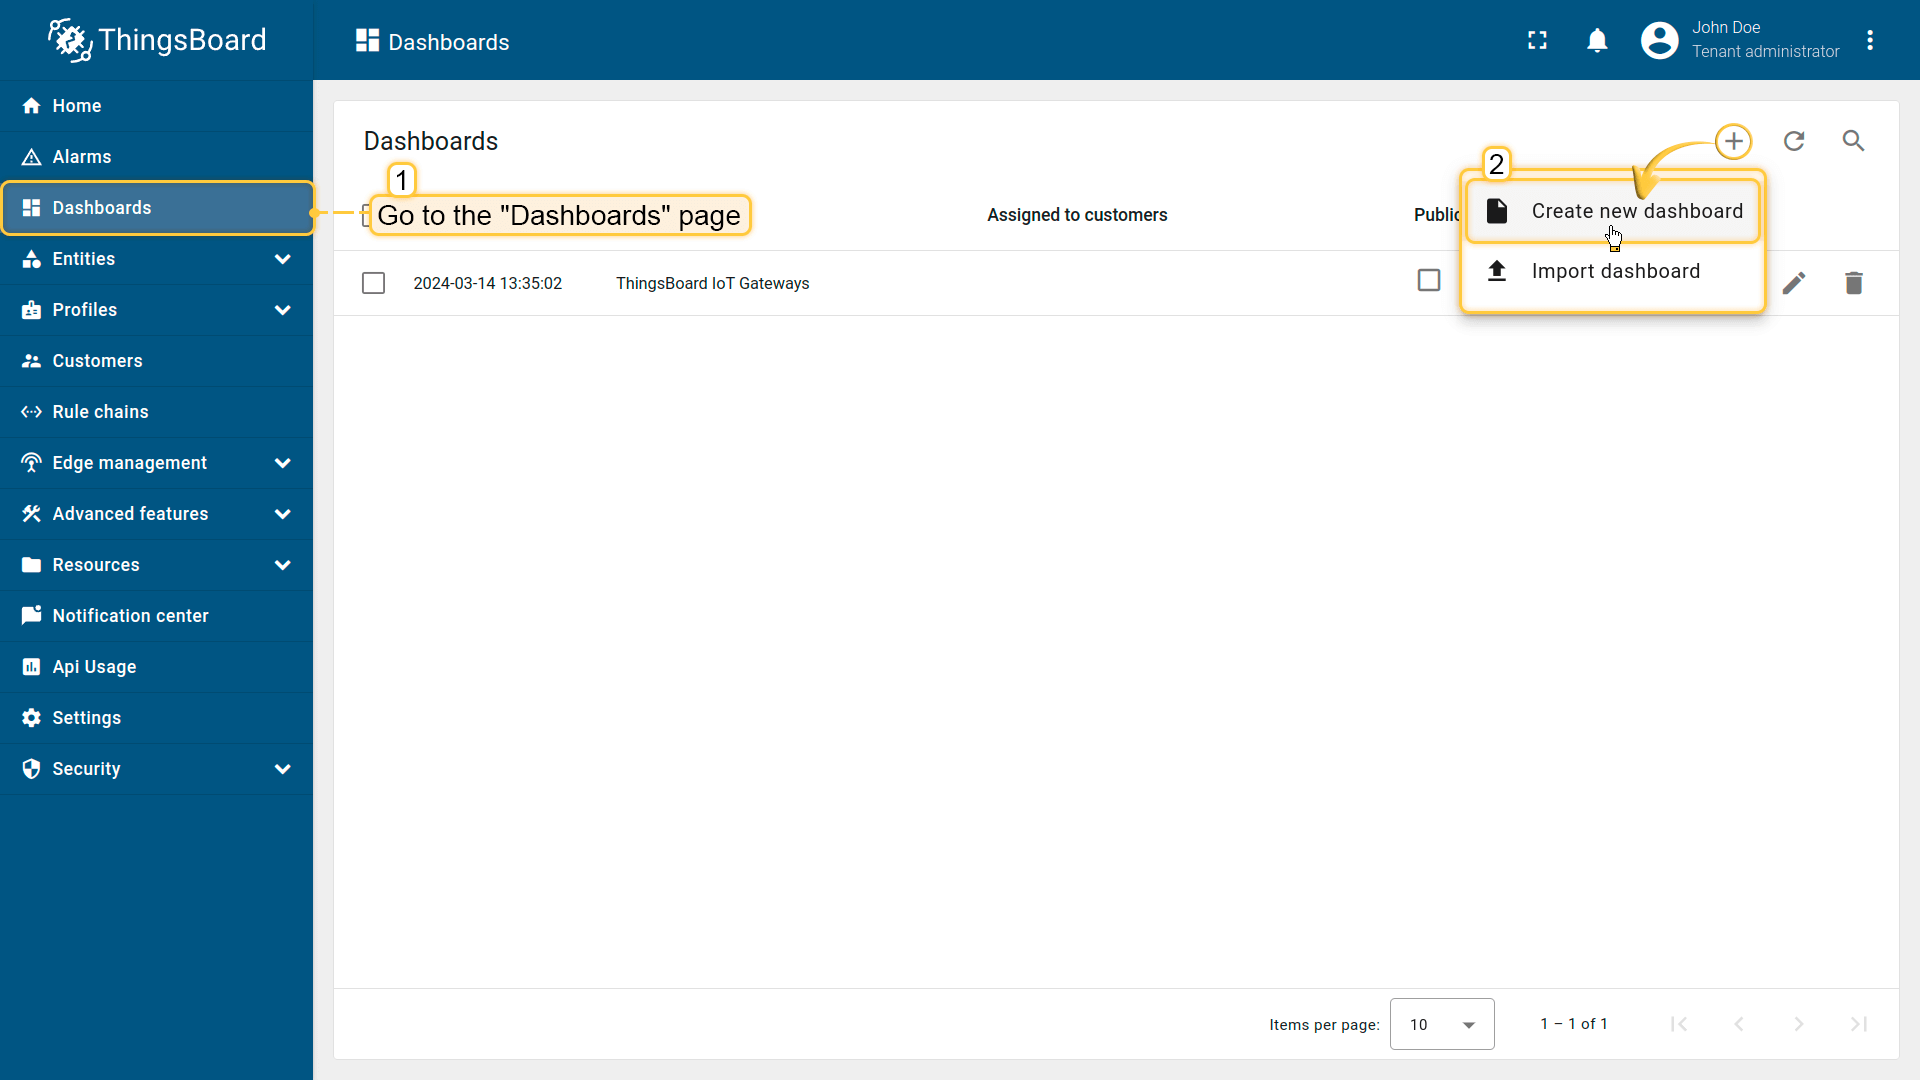
- Navigate to the
Dashboardspage from the main menu on the left side of the screen. - Click the
+sign in the upper right corner of the screen and selectCreate new dashboardfrom the drop-down menu.
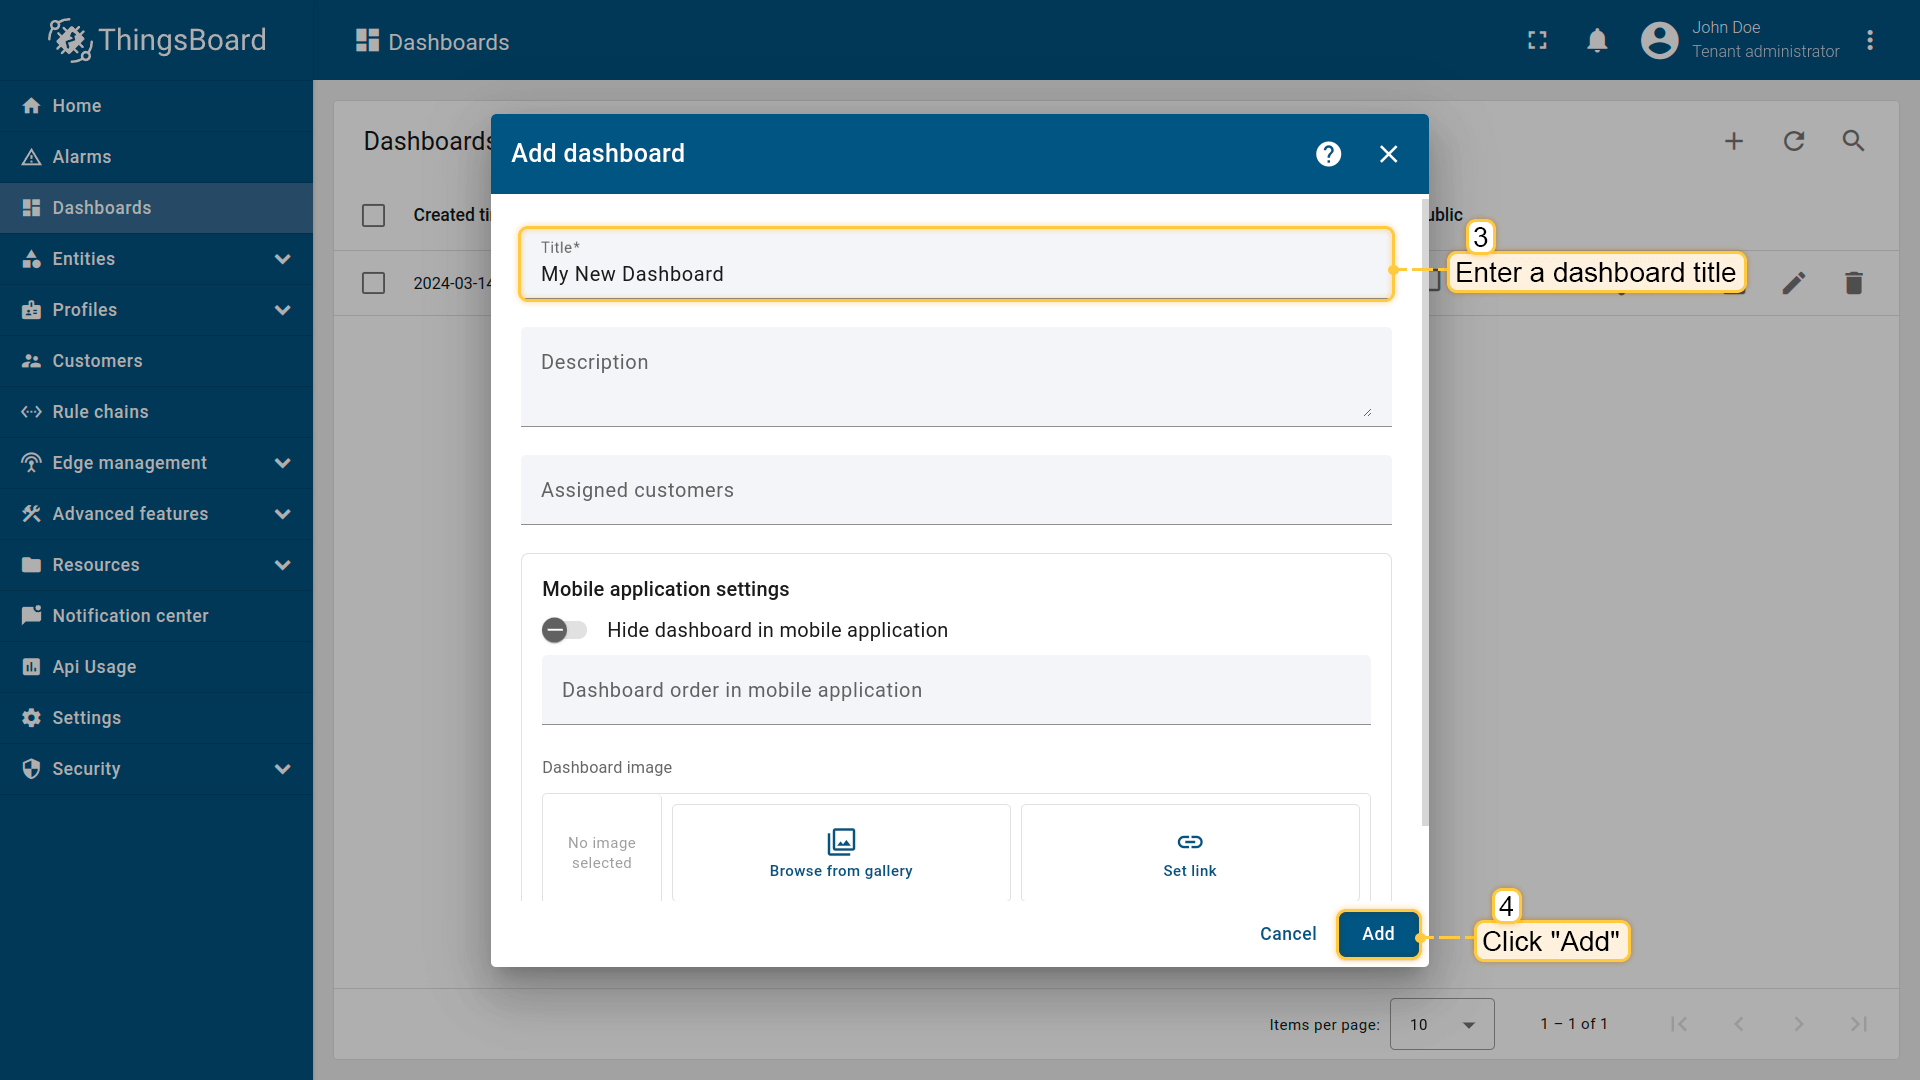
- In the dialog box, enter a title for the dashboard (the description is optional). Click
Add.
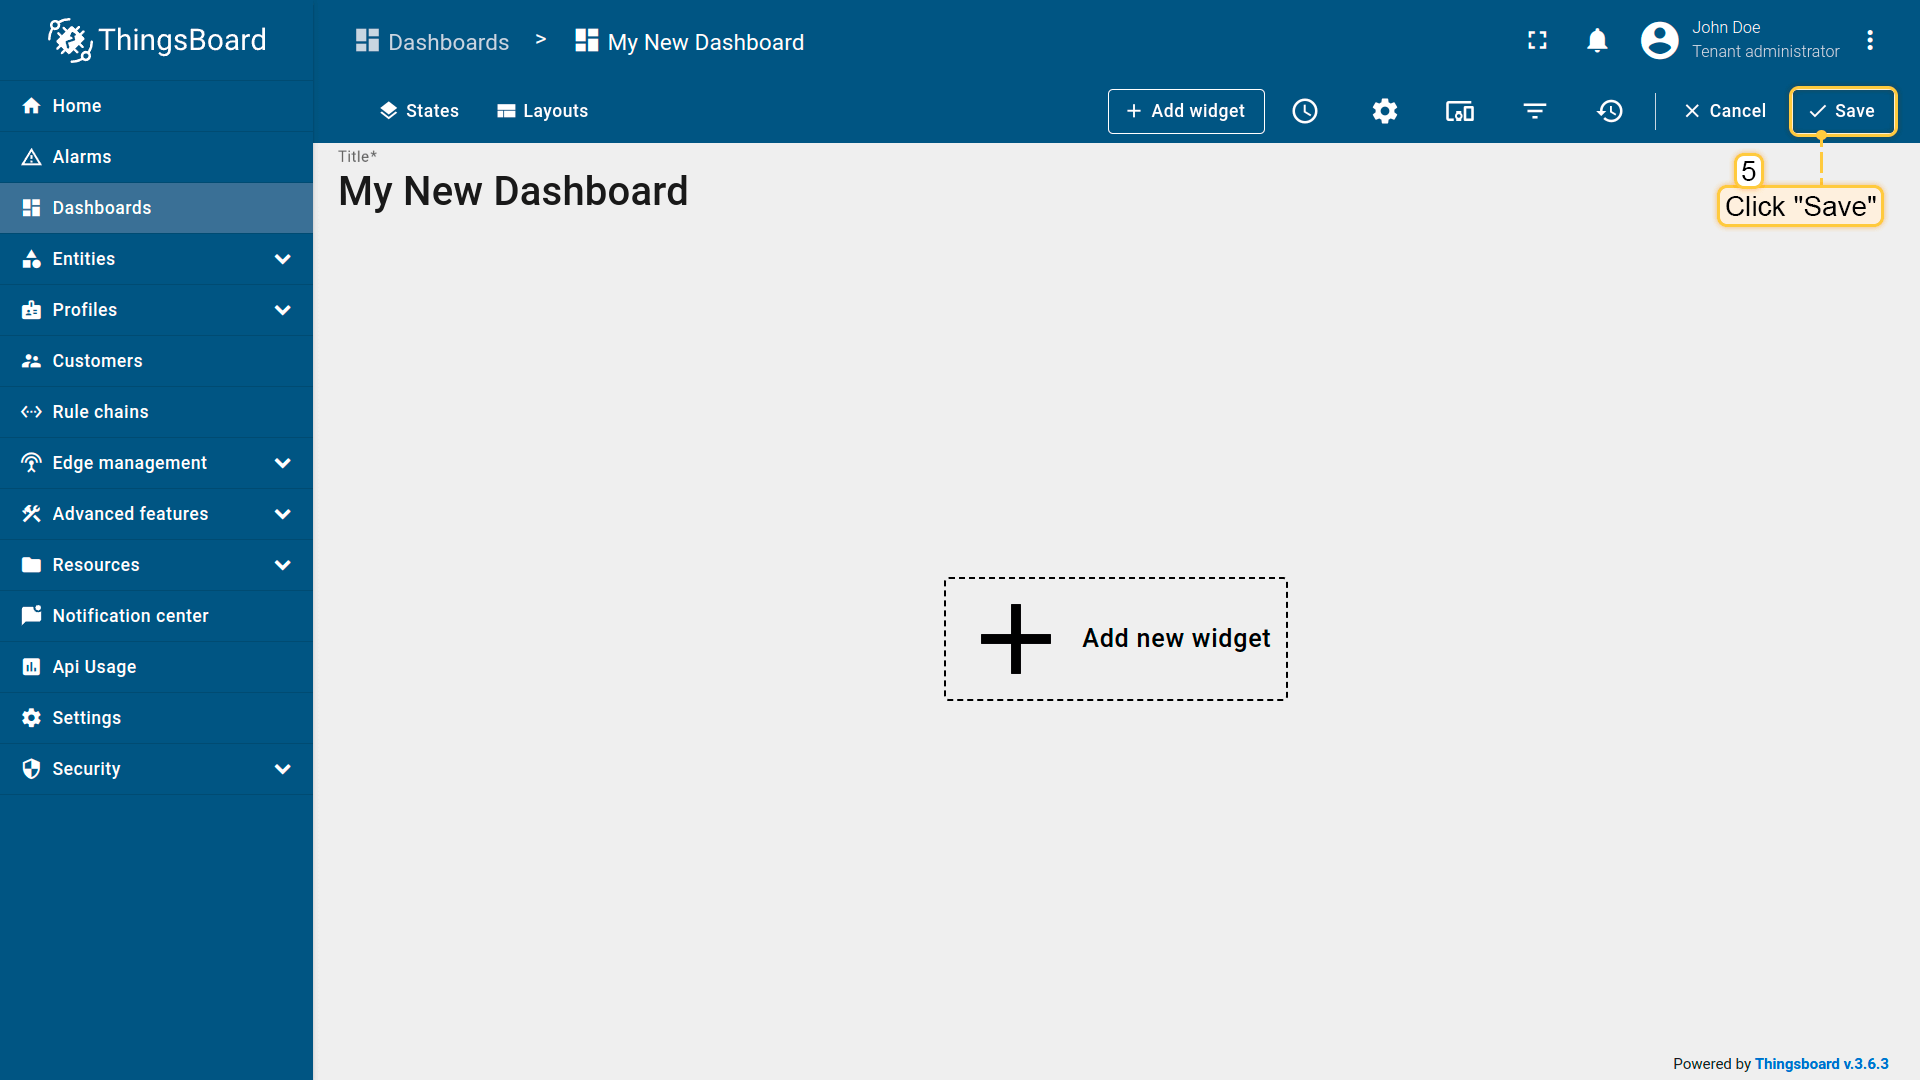
- After creating the dashboard, it will open automatically, and you can start adding widgets.
- To save the dashboard, click the
Savebutton in the upper right corner.
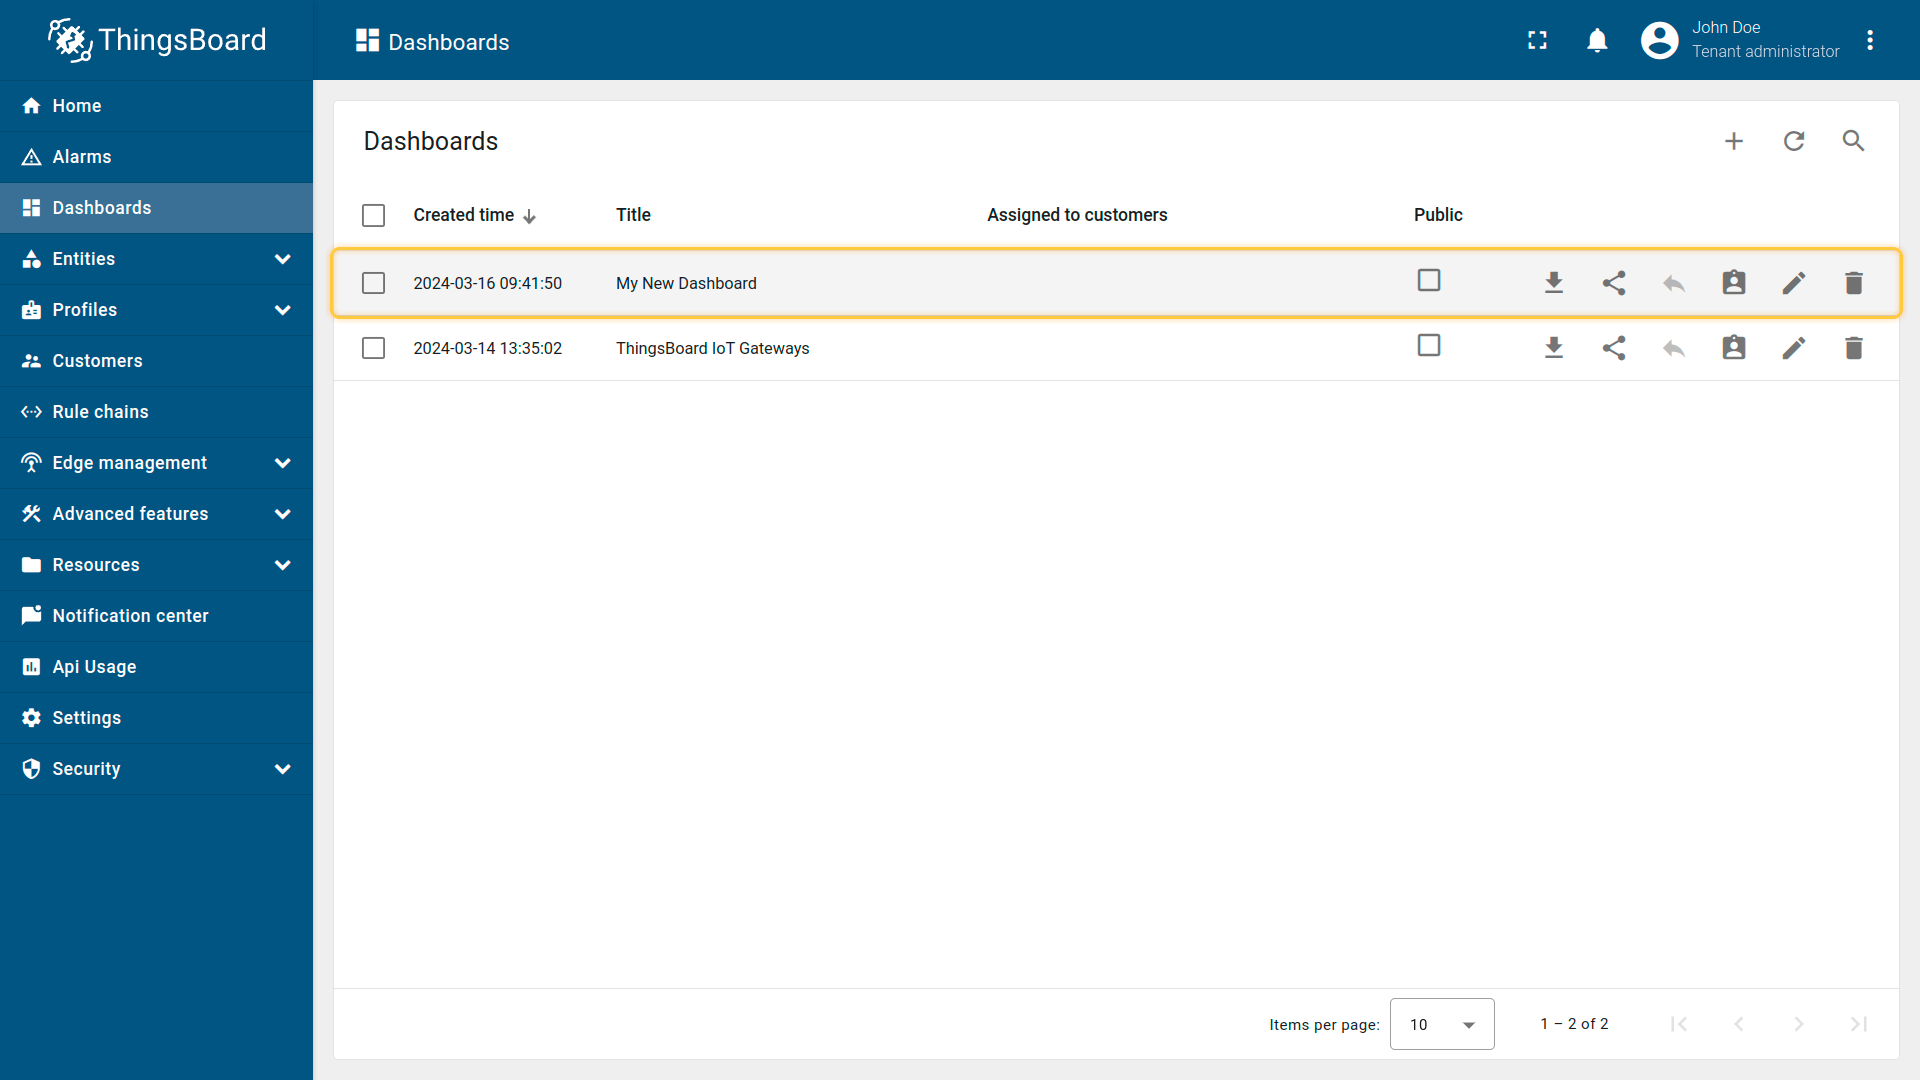
- Your first dashboard is now created. As you add more dashboards, they will appear at the top of the list, sorted by the creation timestamp.
Add a Chart Widget
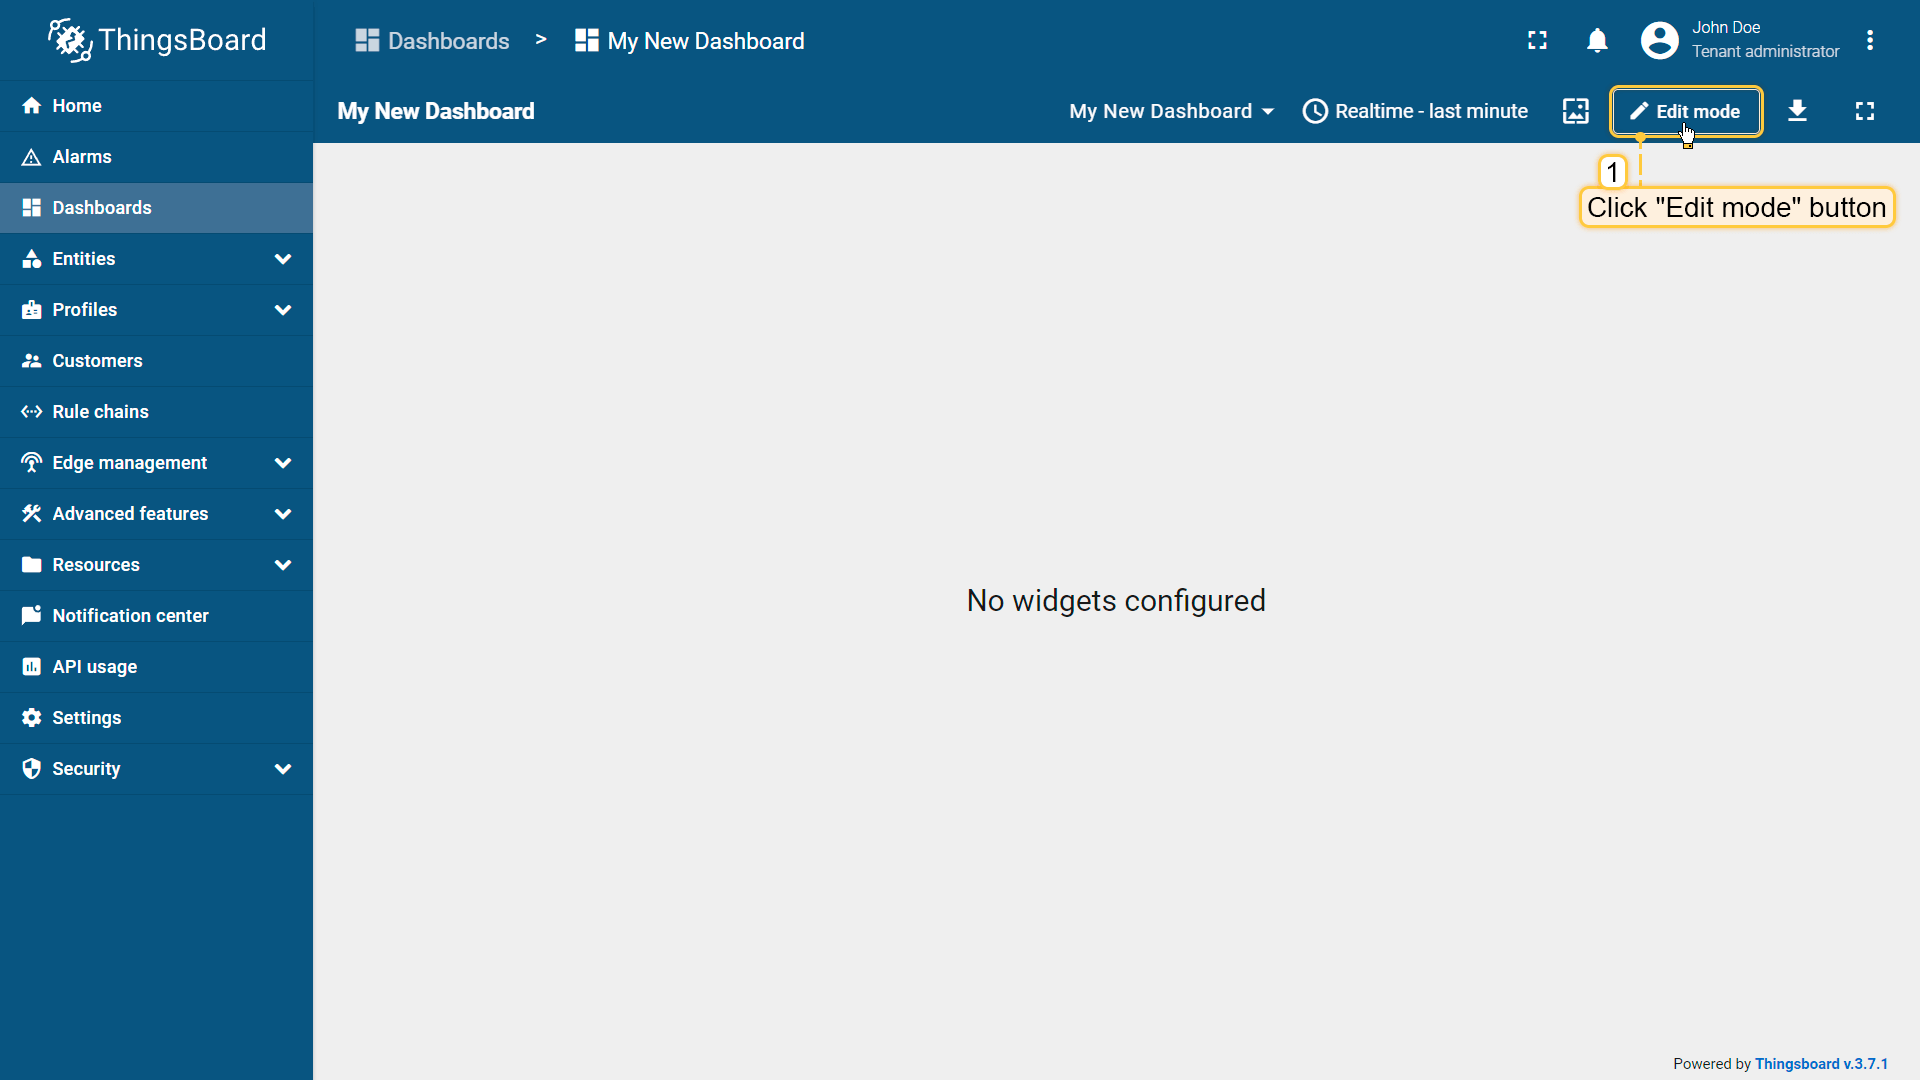
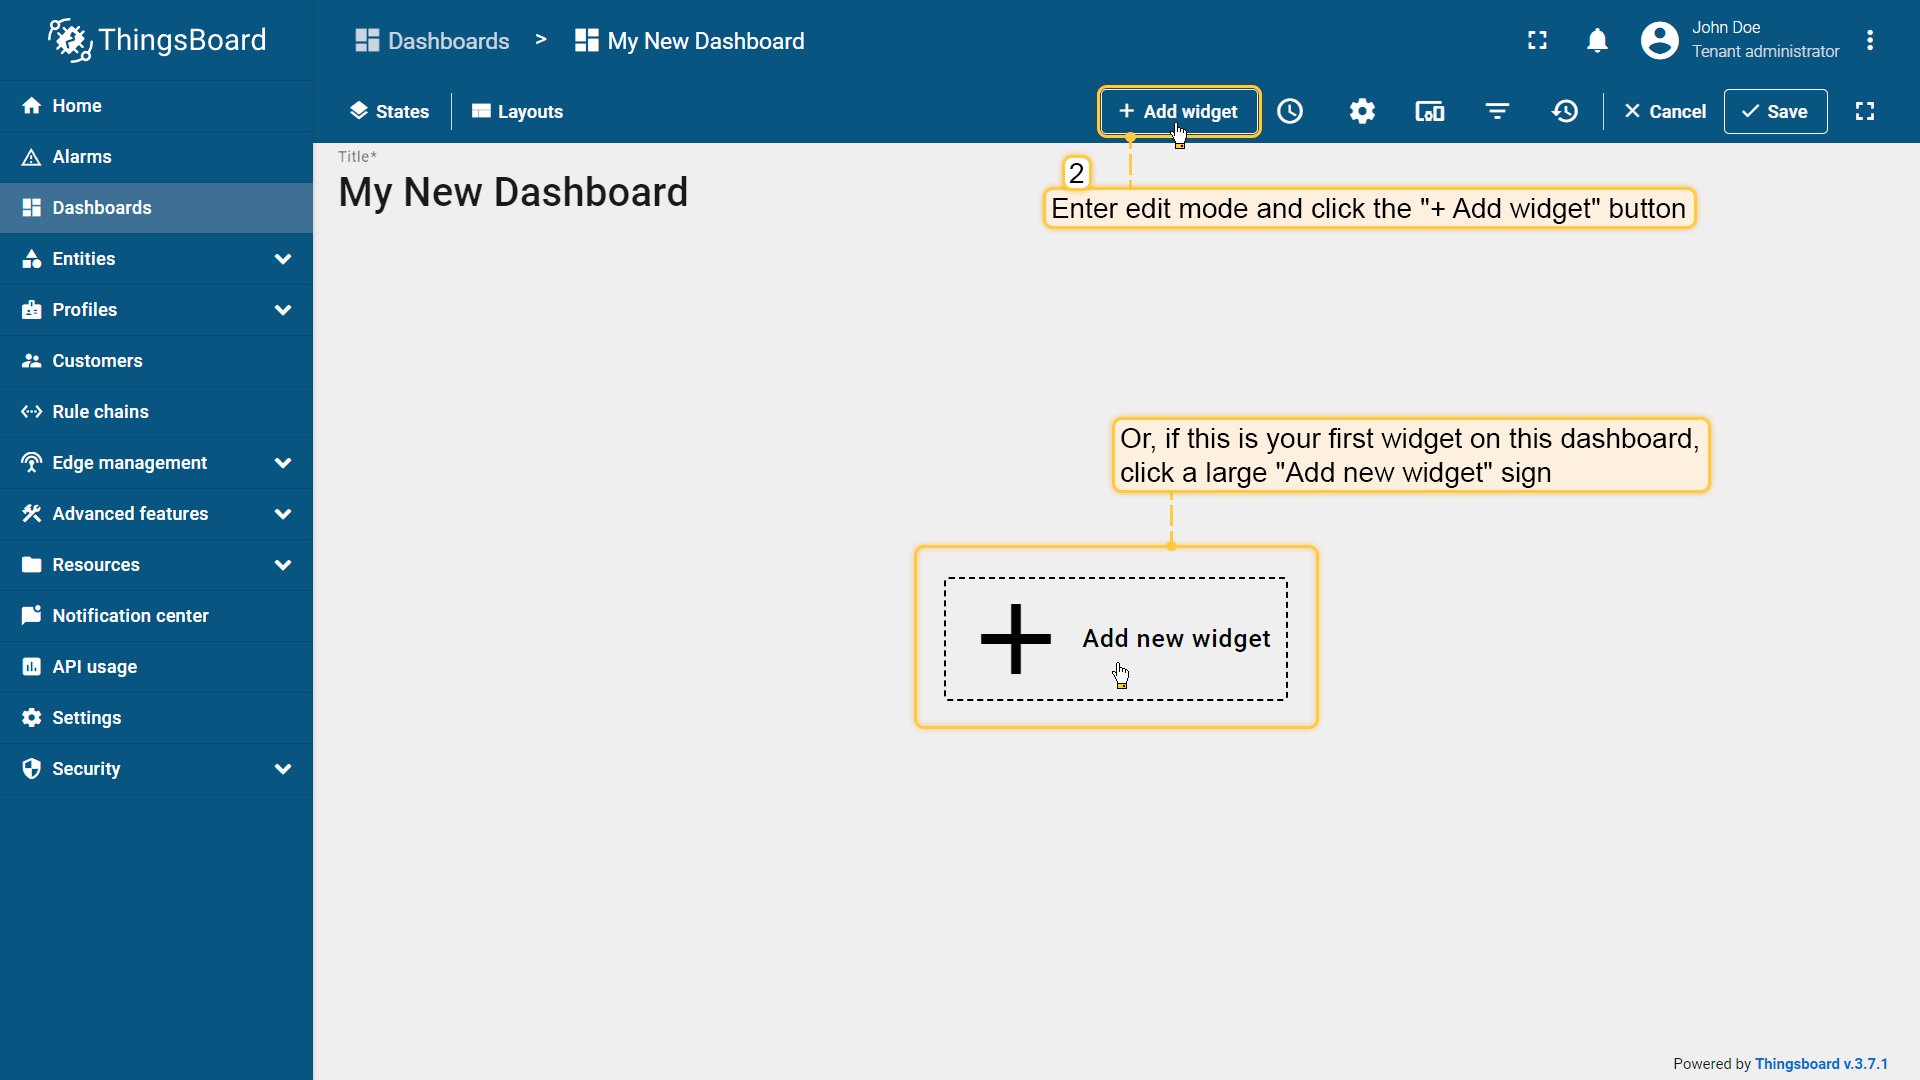
- Enter edit mode and click the
Add new widgetbutton at the top of the screen.
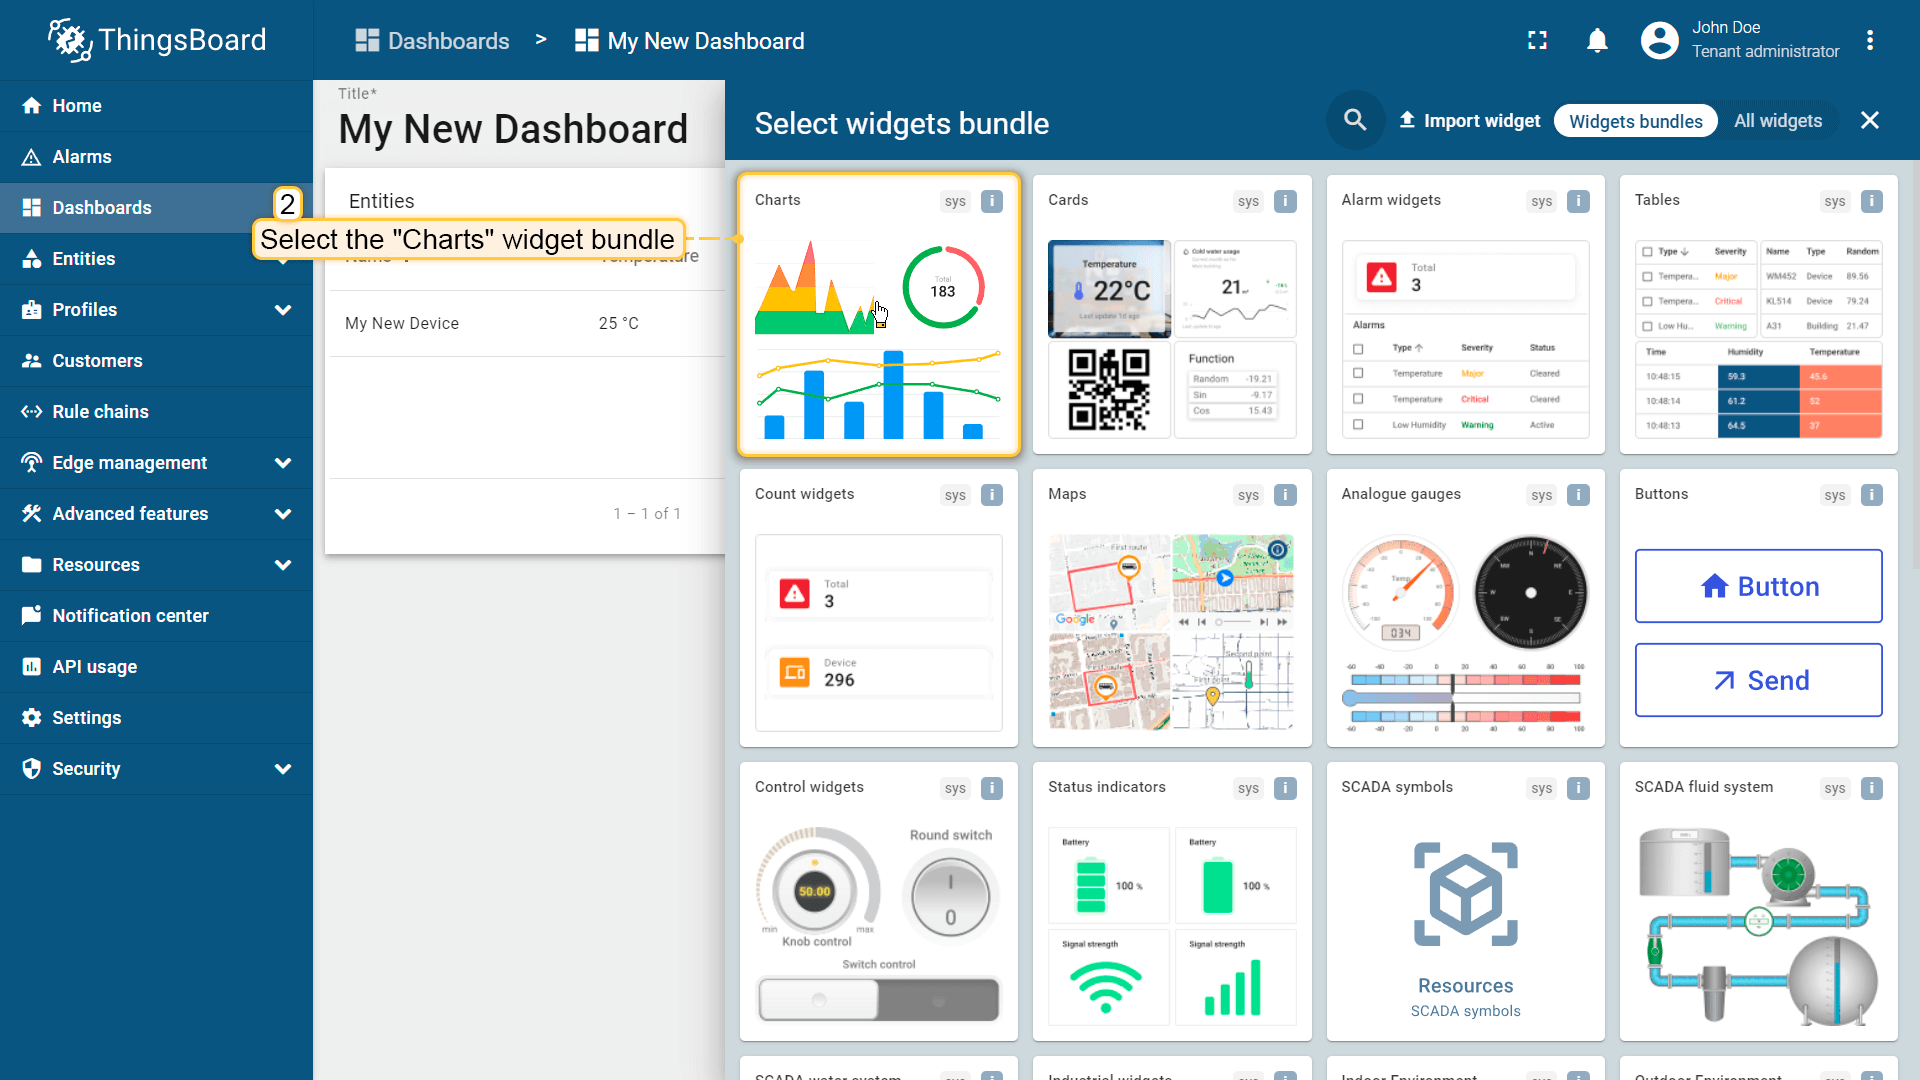
- Find the
Chartswidget bundle and click on it.
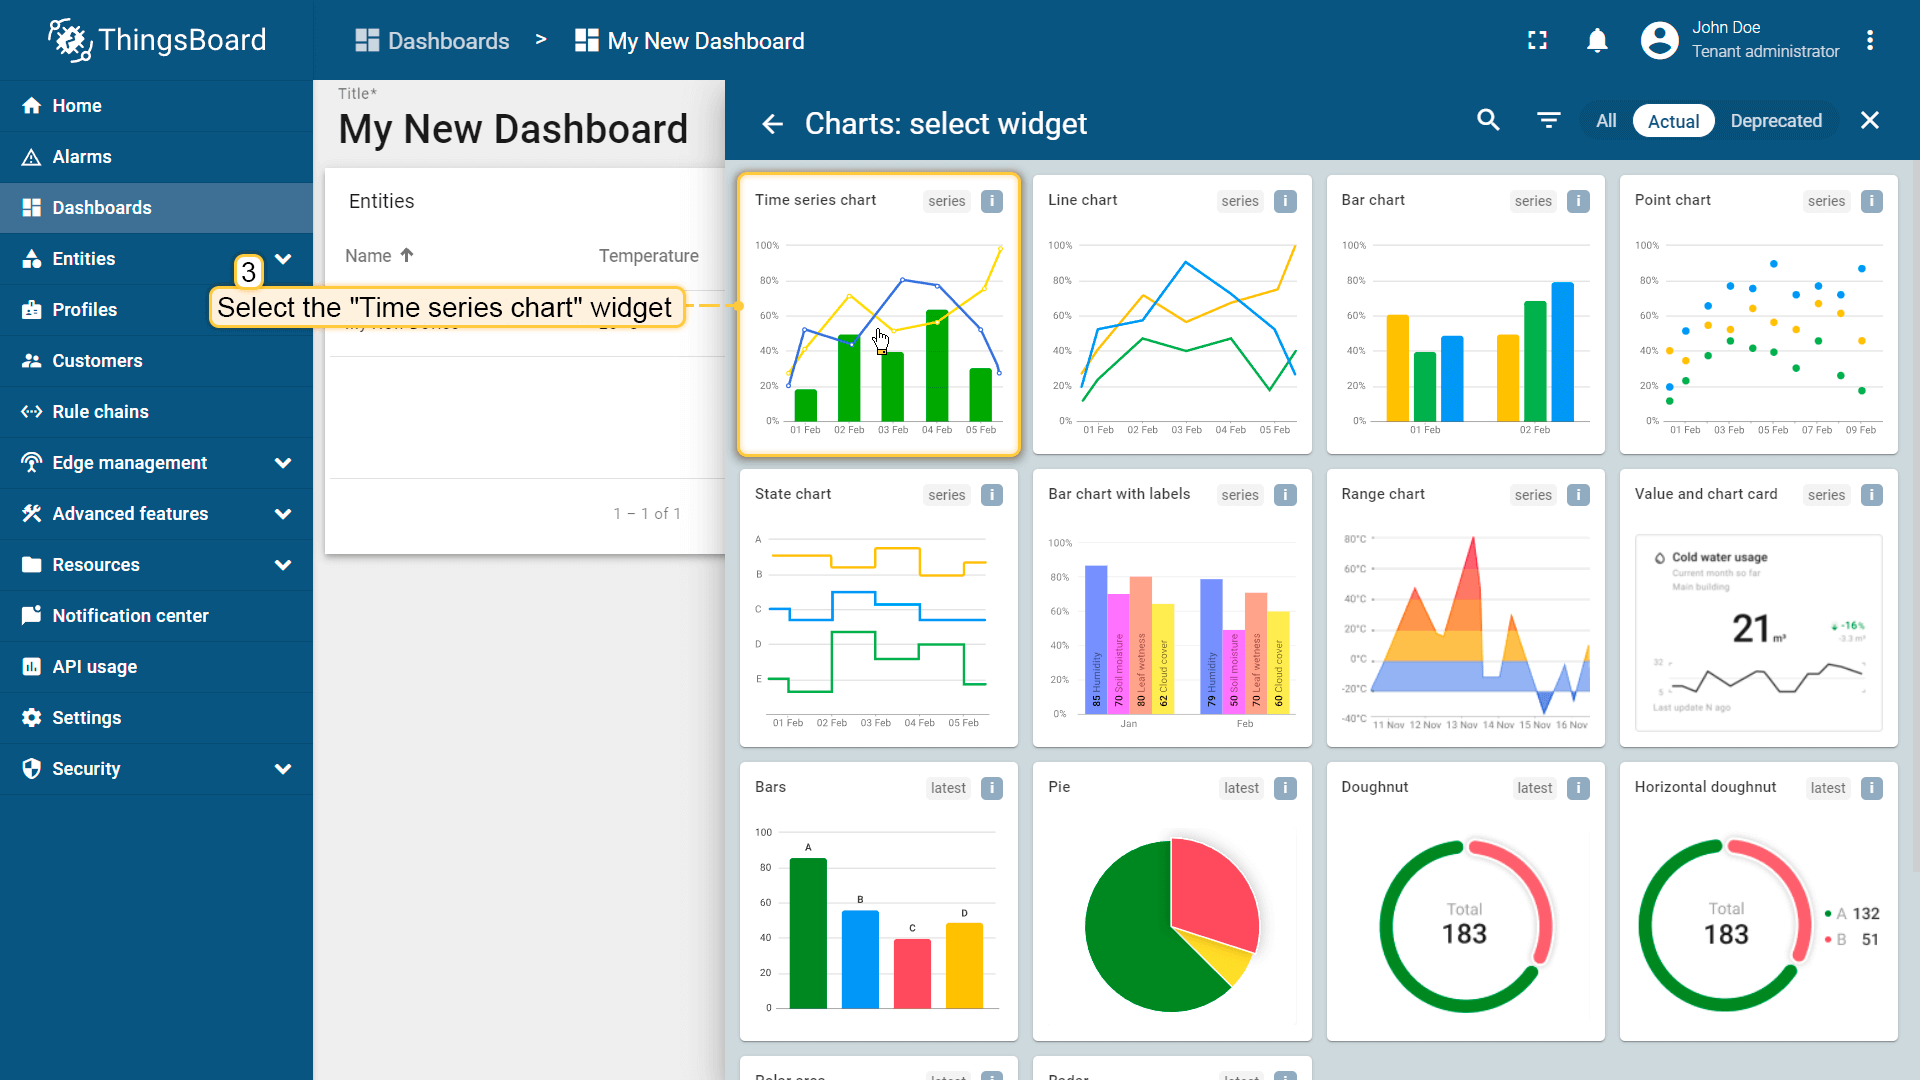
- Select the
Time series chartwidget.
- In the
Devicefield, specify the device you created earlier as the data source. - In the
Seriessection, enter the data keyTemperatureto monitor the temperature values of a device. - Click
Add.
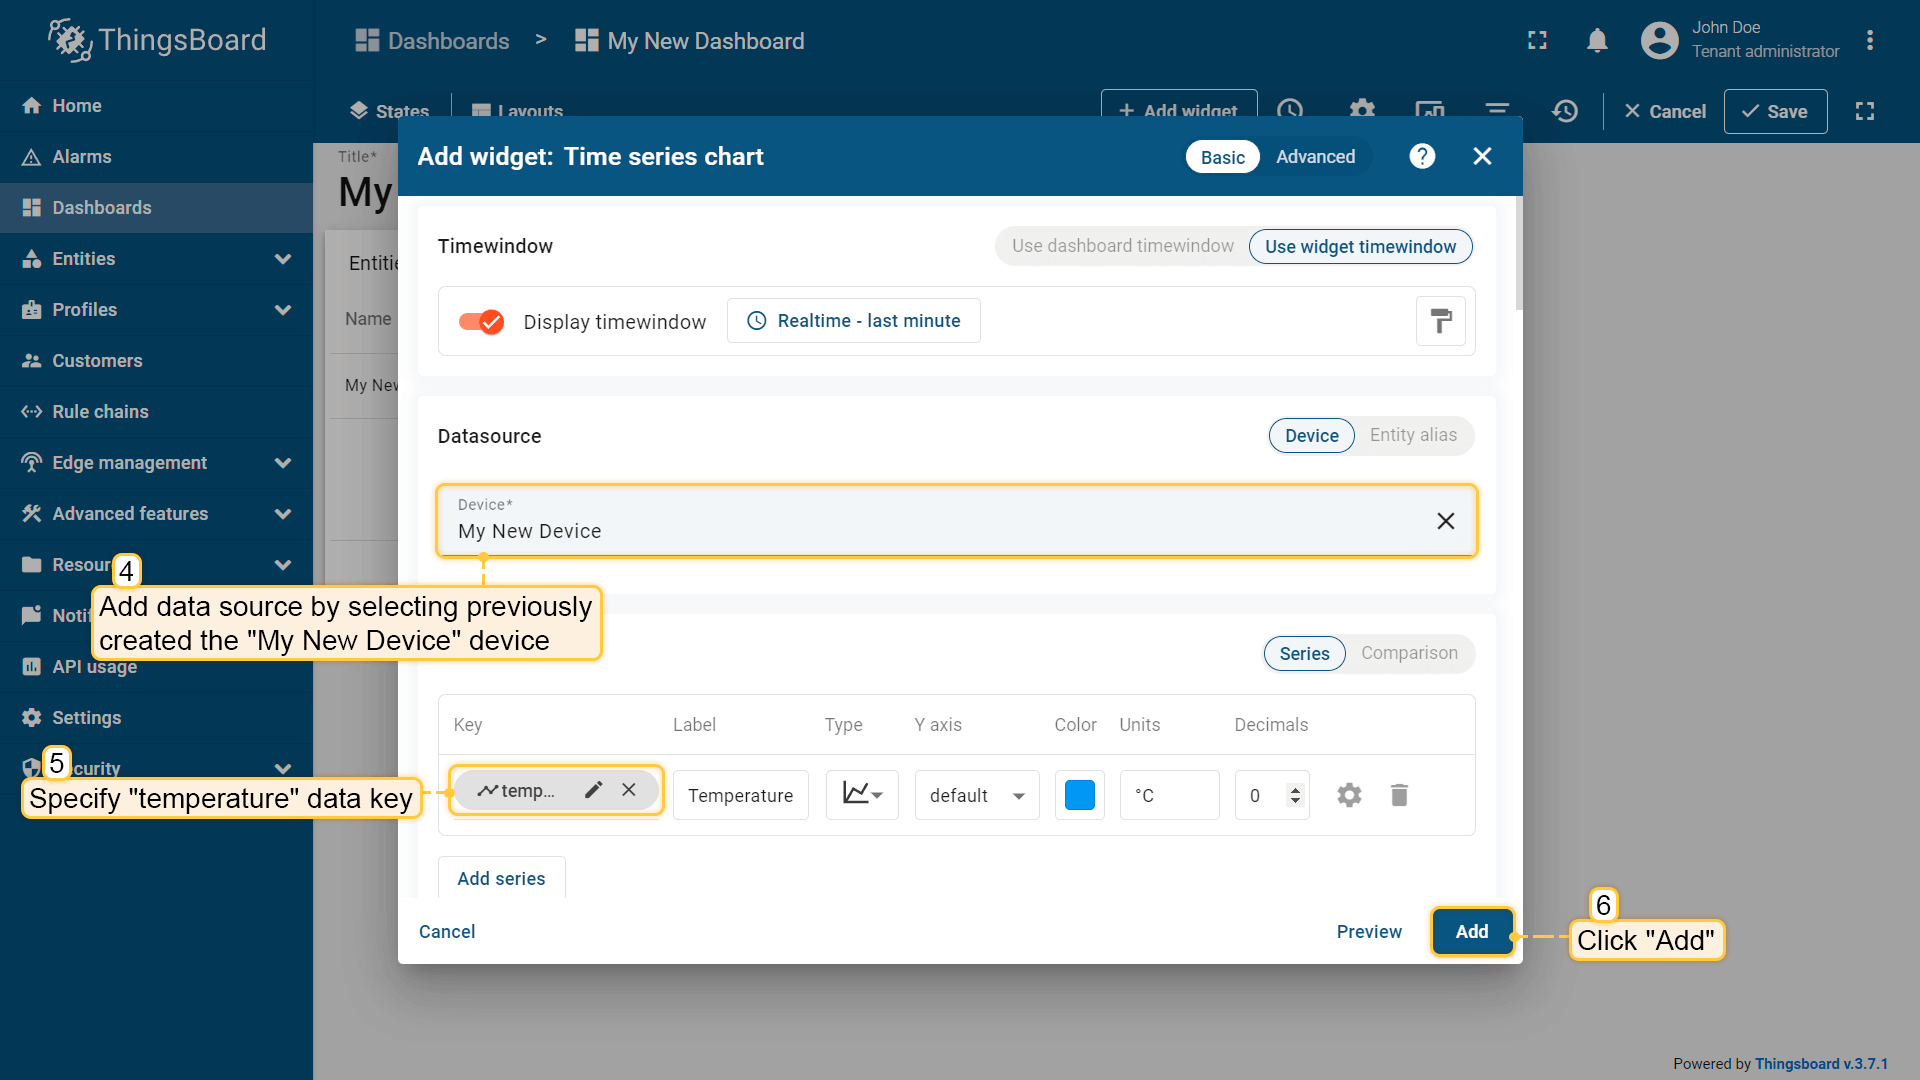
- Resize the widget and apply the changes.
You can explore additional dashboard widgets here.
Tech Support & Product Discussion
Thank you for choosing our products! We are here to provide you with different support to ensure that your experience with our products is as smooth as possible. We offer several communication channels to cater to different preferences and needs.