Vibration Anomaly Detection

Just as the smallest lesion can lead to a fatal disease, the most severe engineering disasters often stem from seemingly insignificant anomalies. Vibration is a crucial indicator—fractures, blockages, overloads, and wear all manifest distinct vibration patterns.
This tutorial introduces the Vibration Anomaly Detection Kit. It is a lightweight intelligent solution designed to monitor and identify abnormal vibration patterns in real-time. By learning a device’s normal vibration signature with minimal training data, it provides early warnings for mechanical faults.
1. Preparation
Before you begin detecting anomalies, please ensure you have the following hardware and software environments ready.
Hardware Requirements
The solution consists of 3 hardware modules.
- MCU: Seeed Studio XIAO ESP32-S3 (Pre-Soldered)
- Expansion Board: Grove Shield for Seeed Studio XIAO (with embedded battery management)
- Sensor: Grove - 3-Axis Digital Accelerometer (LIS3DHTR)
- Cable: 1 USB-C data cable
- Target Object: A device with consistent regular vibrations (e.g., motor, fan).
Get the complete Kit: Vibration Anomaly Detection Kit for XIAO ESP32-S3
Software Setup
- Open your browser and visit SenseCraft AI.
- Log in with your account (register if you don't have one).
- Enter the XIAO ESP32S3 Sense workspace and select "Vibration".
2. Step-by-Step Guide
Follow these steps to train your device to recognize "normal" vibrations and detect anomalies.
Step 1: Connect and Initialize
- Assembly: Connect the accelerometer to the XIAO ESP32-S3 via the Grove Shield. Attach the sensor firmly to your target object.
- Connect: Plug the XIAO ESP32S3 into your computer via USB. Click the "Connect" button on the SenseCraft AI interface.
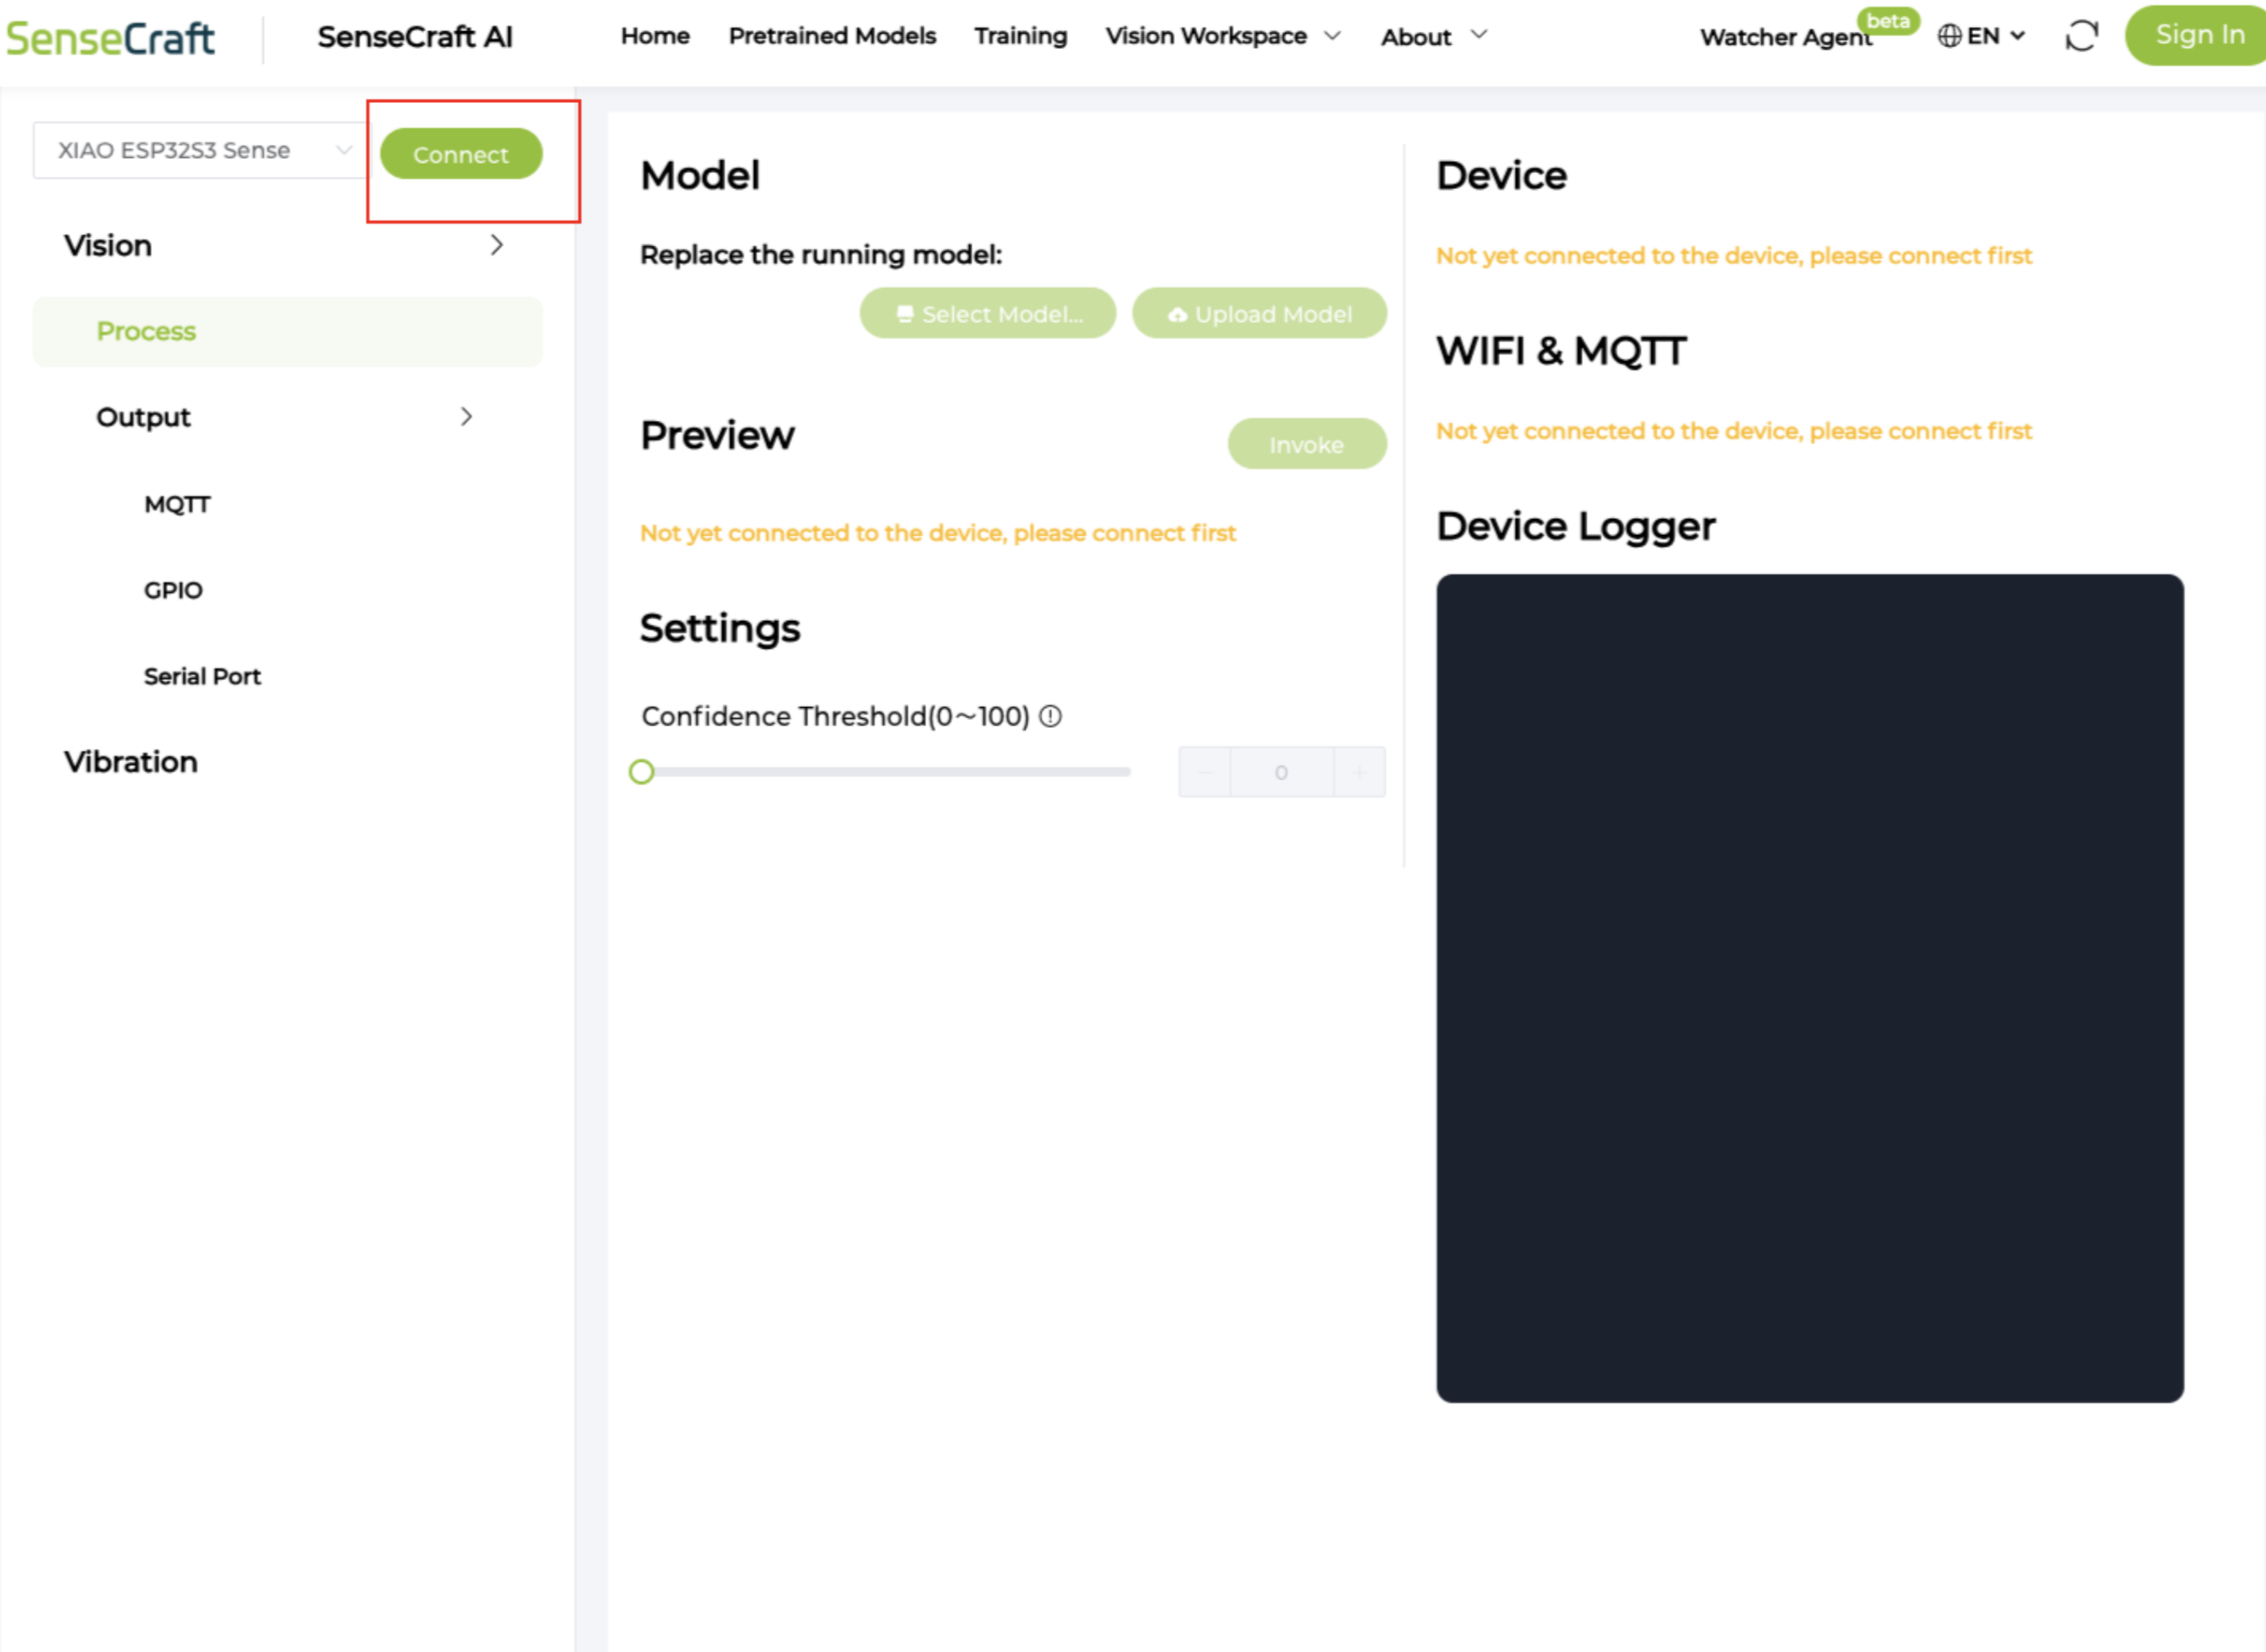
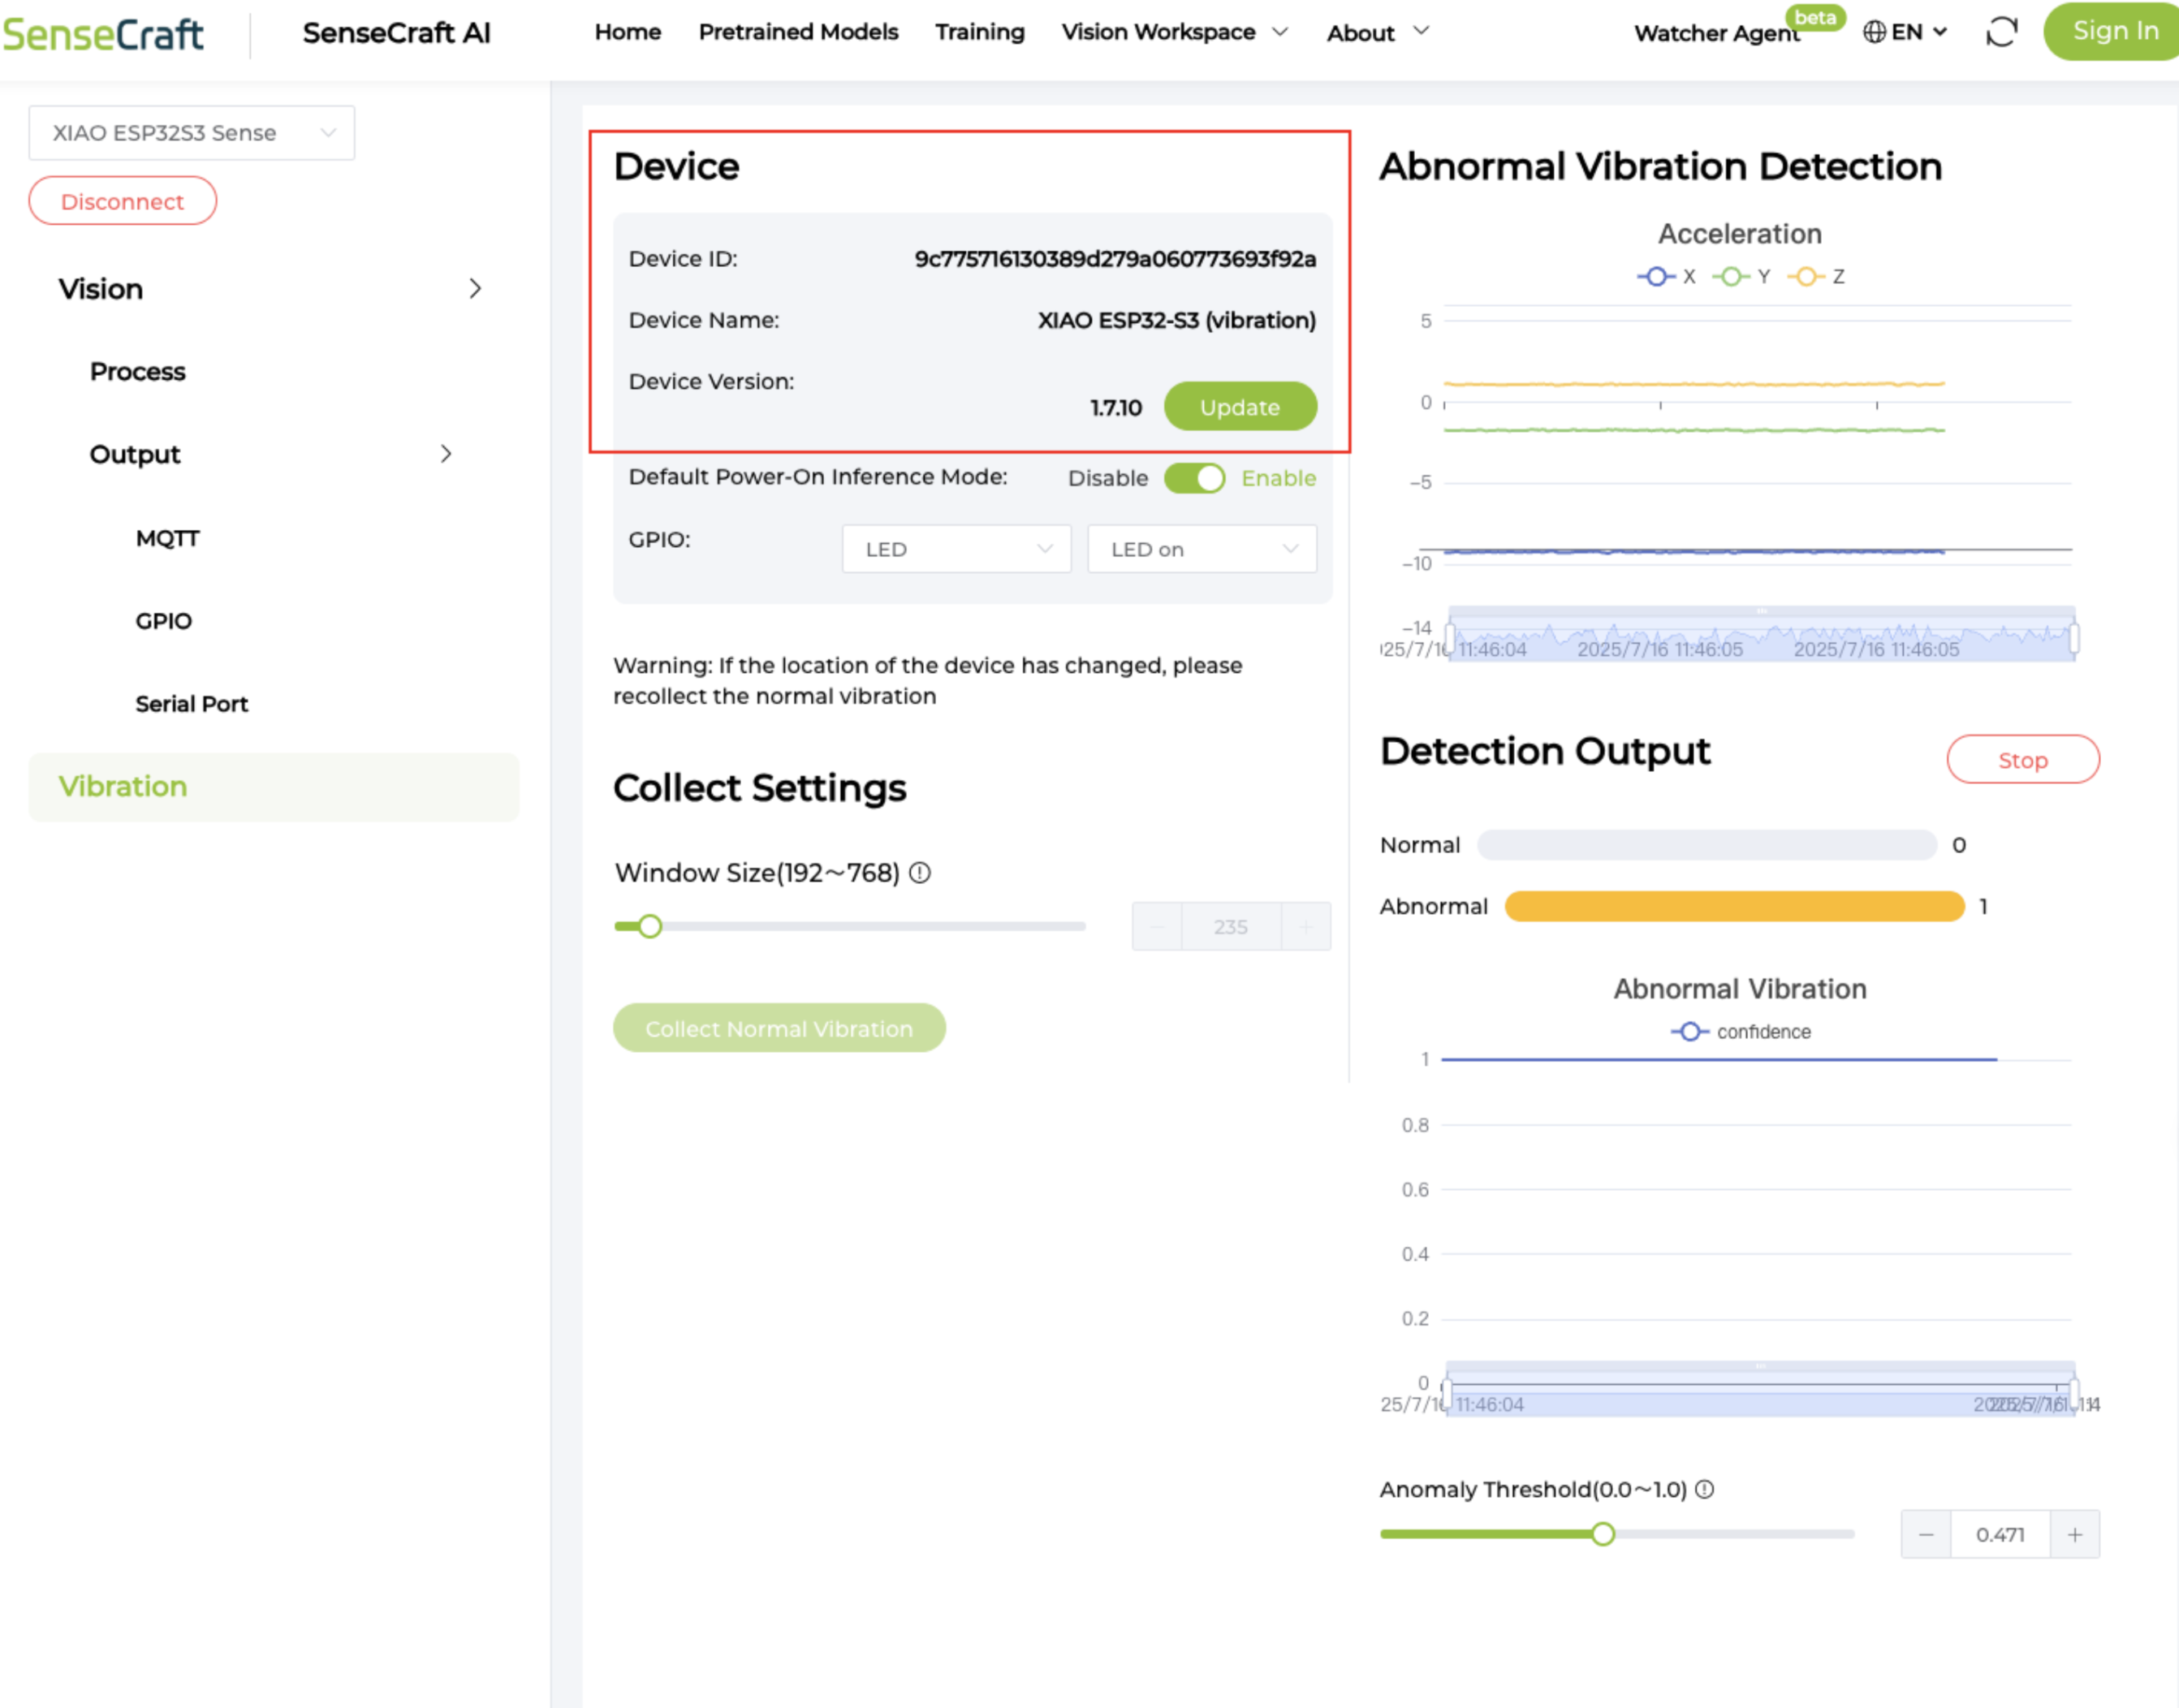
- Verify: The system will display the device information.
- Note: If the firmware is incorrect, use the burn button on the interface to update to the Vibration Anomaly Detection (VAD) firmware.
Step 2: Configuration
Once connected, you will see the Parameter Settings area.
- Window Size: Default is 192. Keep this default for now.
- Tip: A too-small window may lead to insufficient learning, while a too-large window increases inference time. You can tune this later.
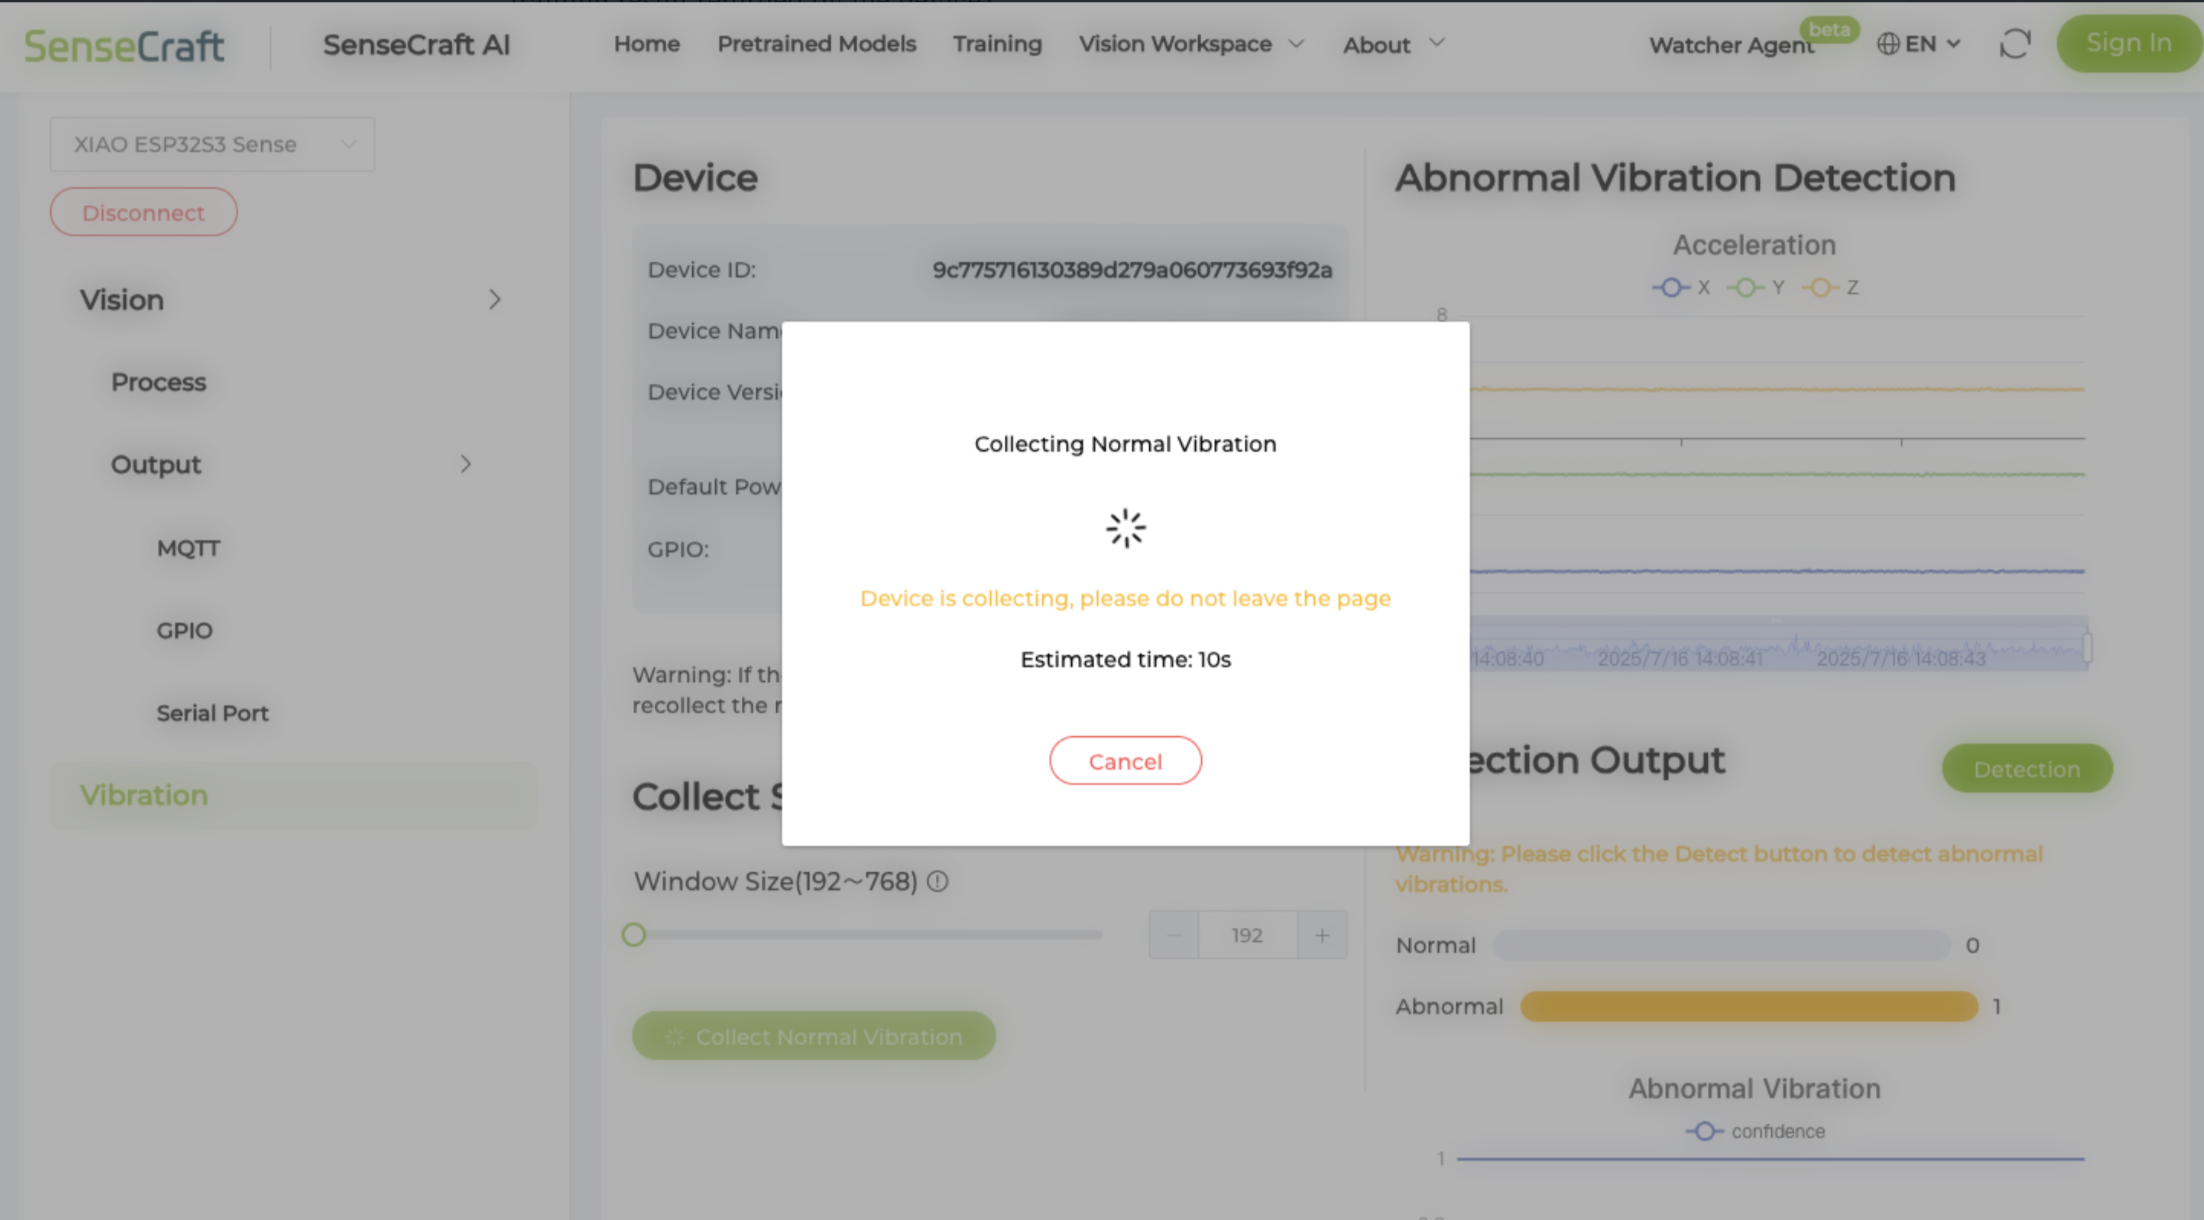
Step 3: Train (Collect Normal Data)
The device needs to learn what "Normal" feels like.
- Ensure your target object is running in its normal state.
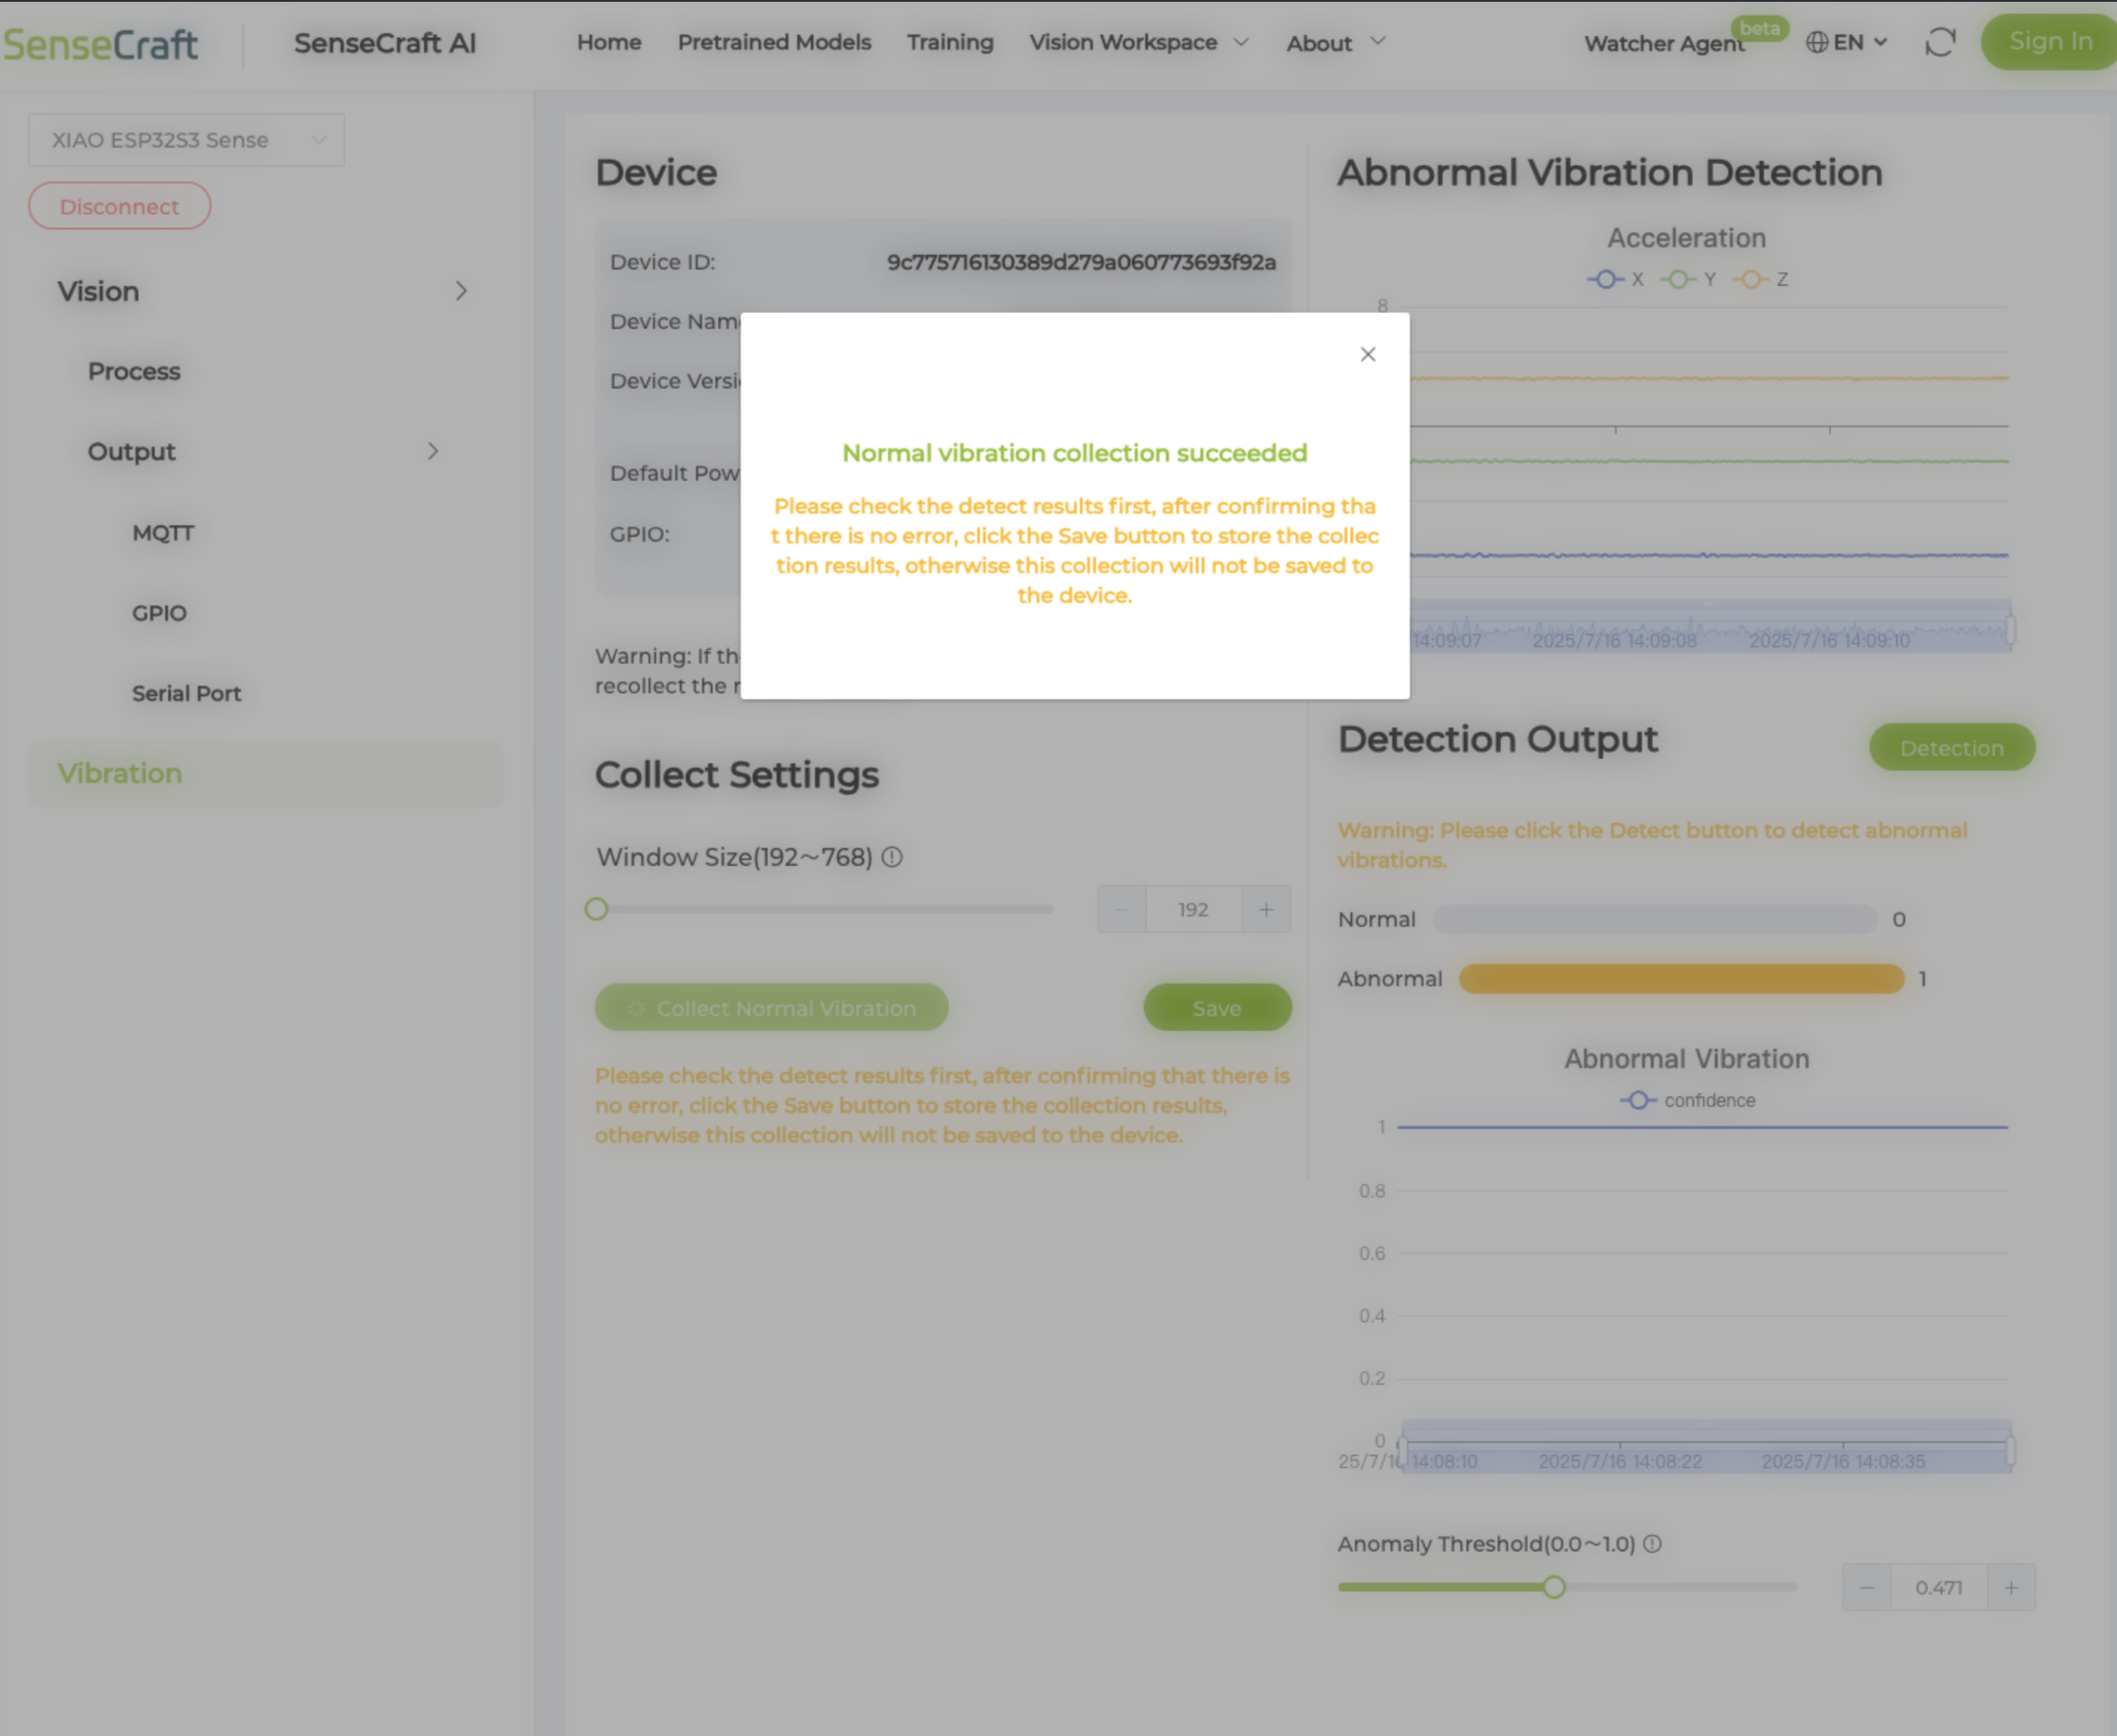
- Click "Collect Normal Vibration".
- Wait for the success message: "Normal vibration collection succeeded".
- Click "Save". This stores the model into the MCU's flash memory.
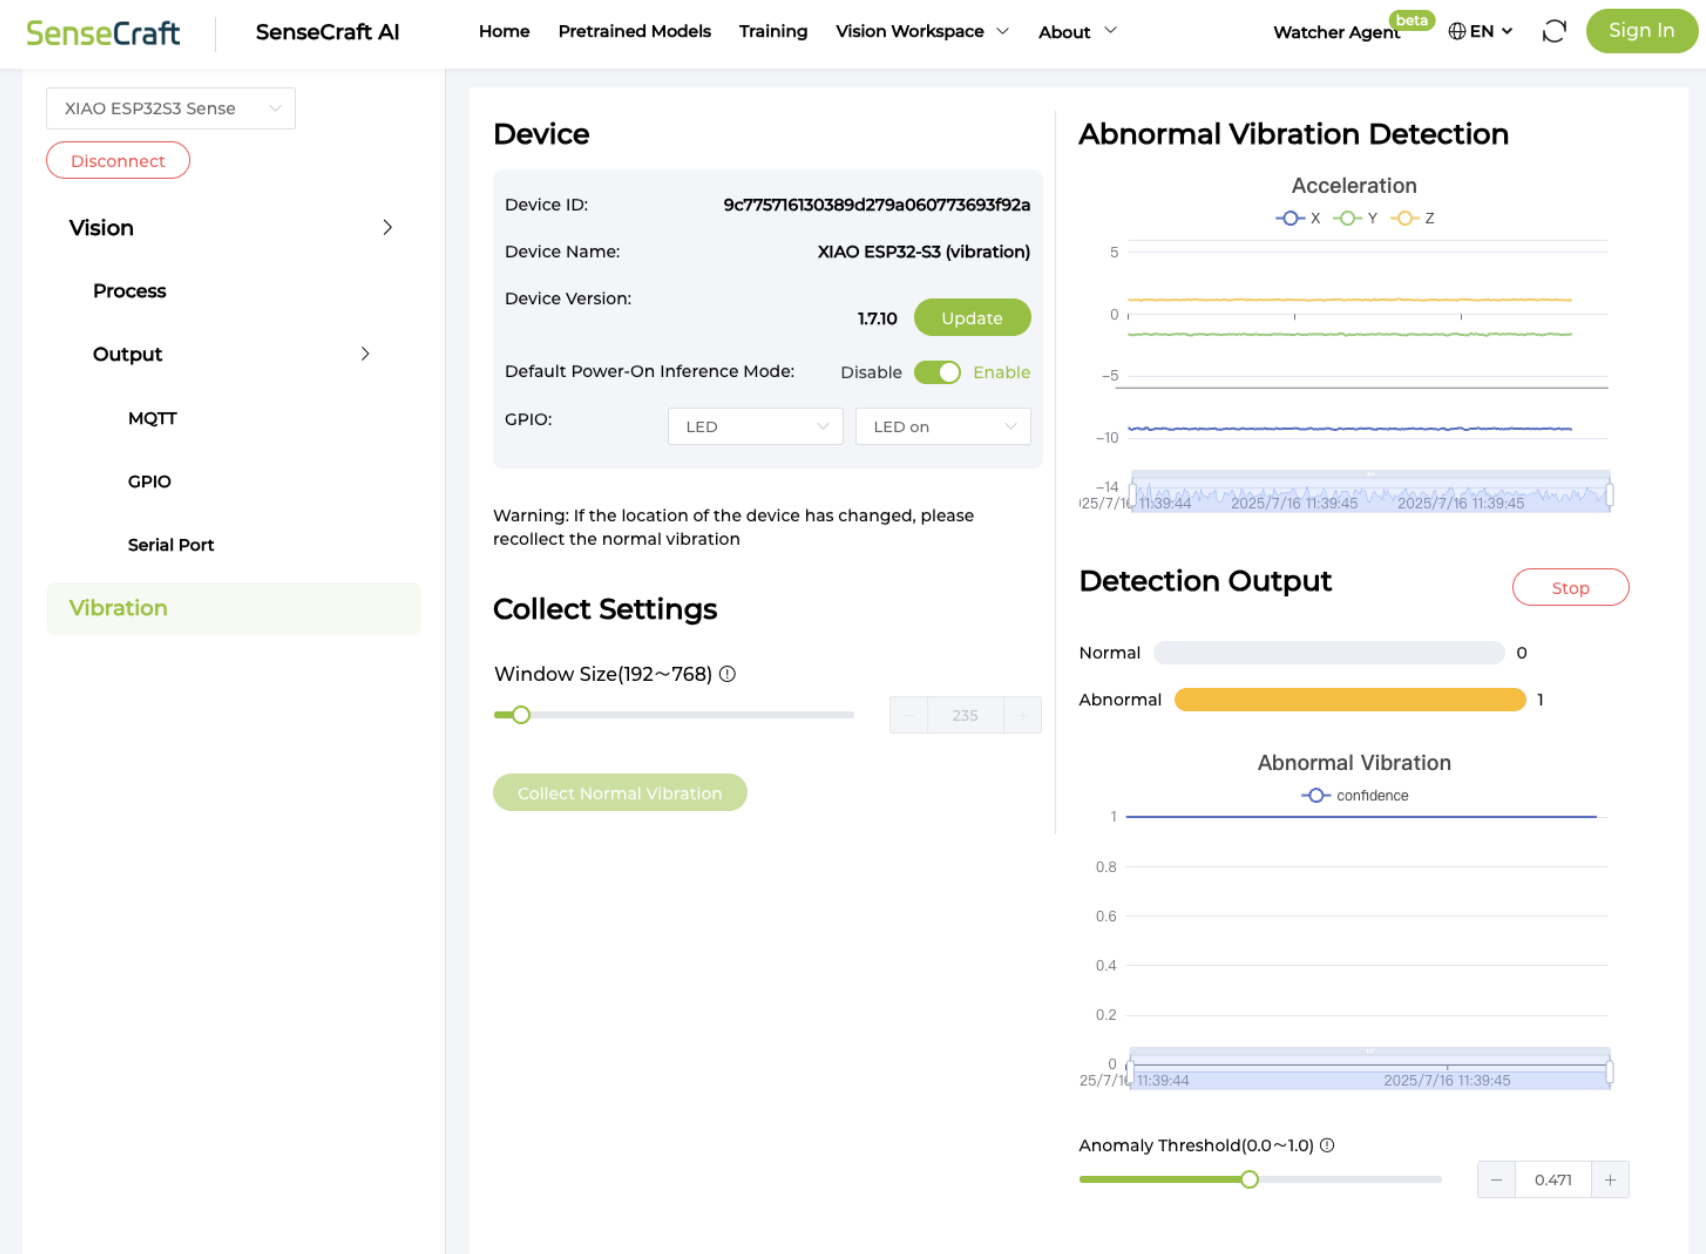
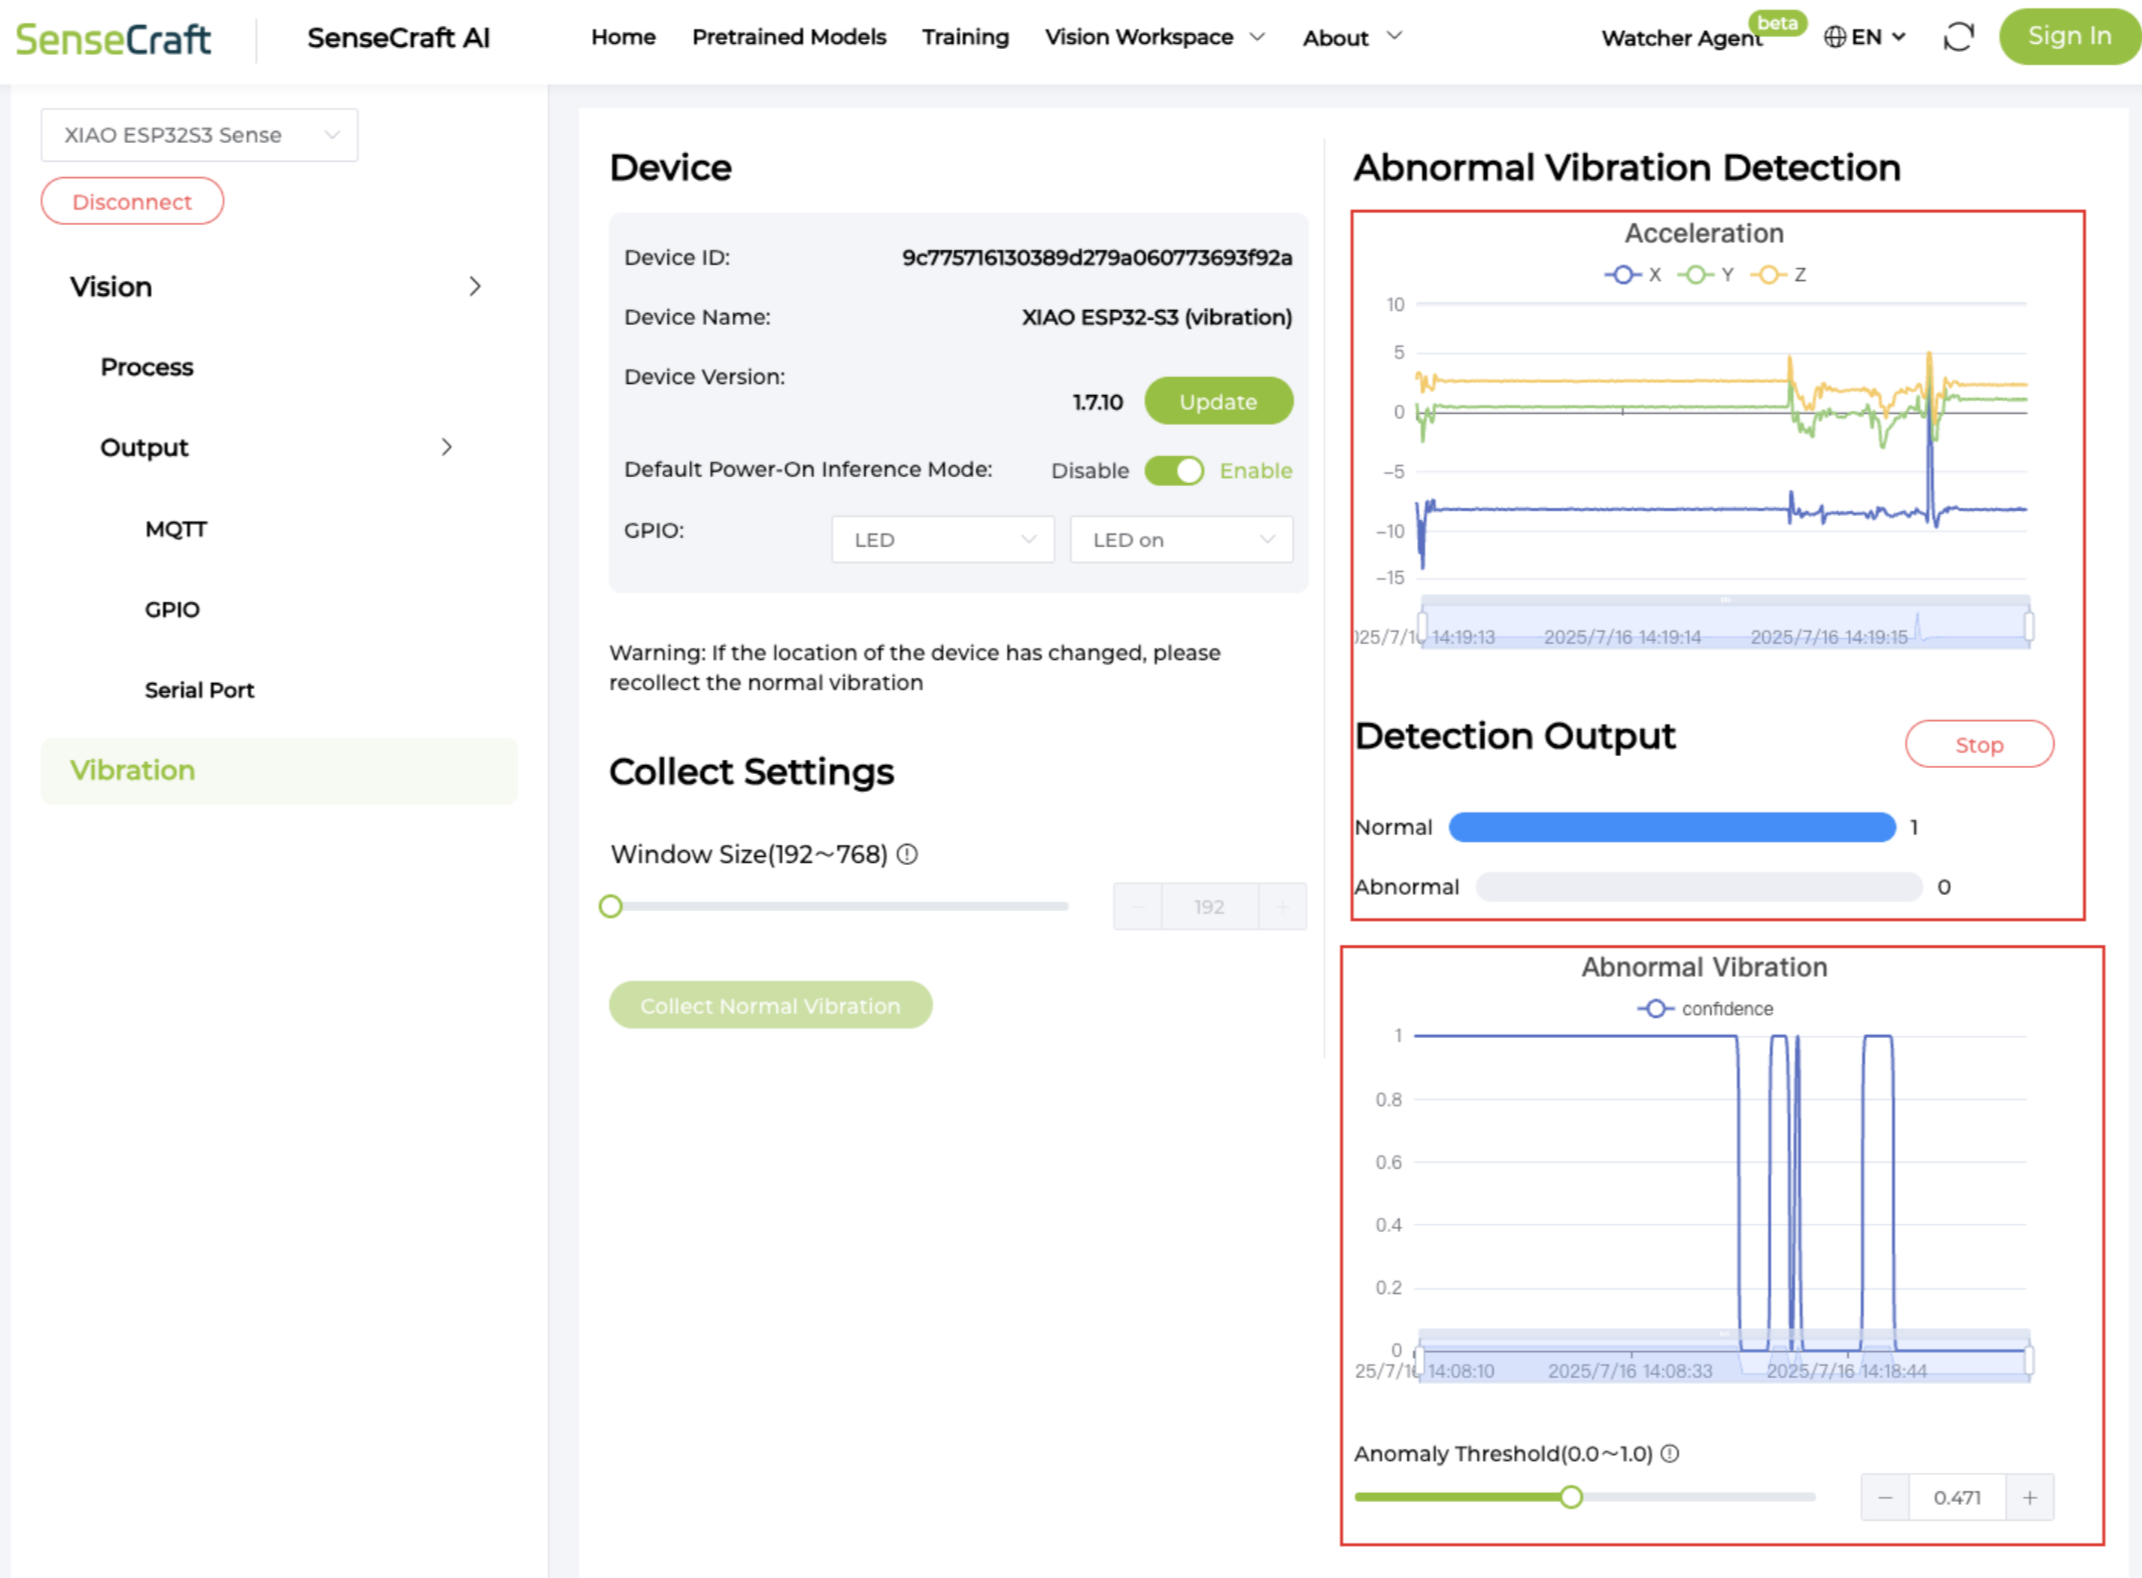
Step 4: Detect Anomalies
- Click "Detect" to start real-time monitoring.
- Observe the Detection Output Area:
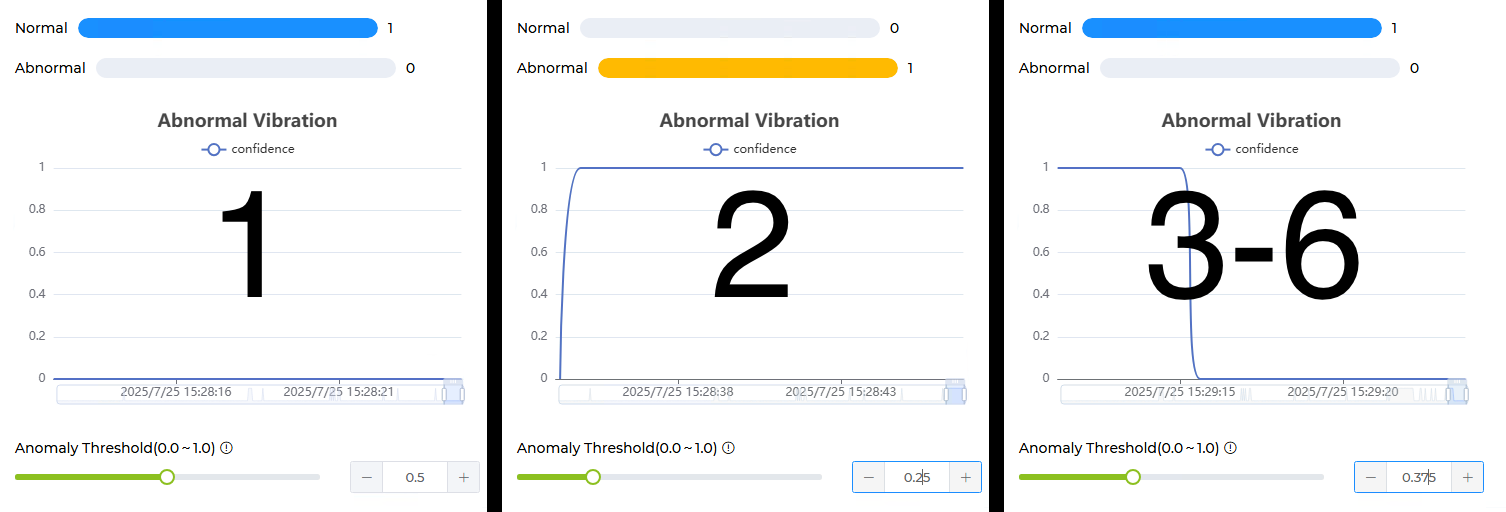
- Normal: The vibration pattern matches the learned model.
- Abnormal: A potential anomaly is detected (Alert displayed).
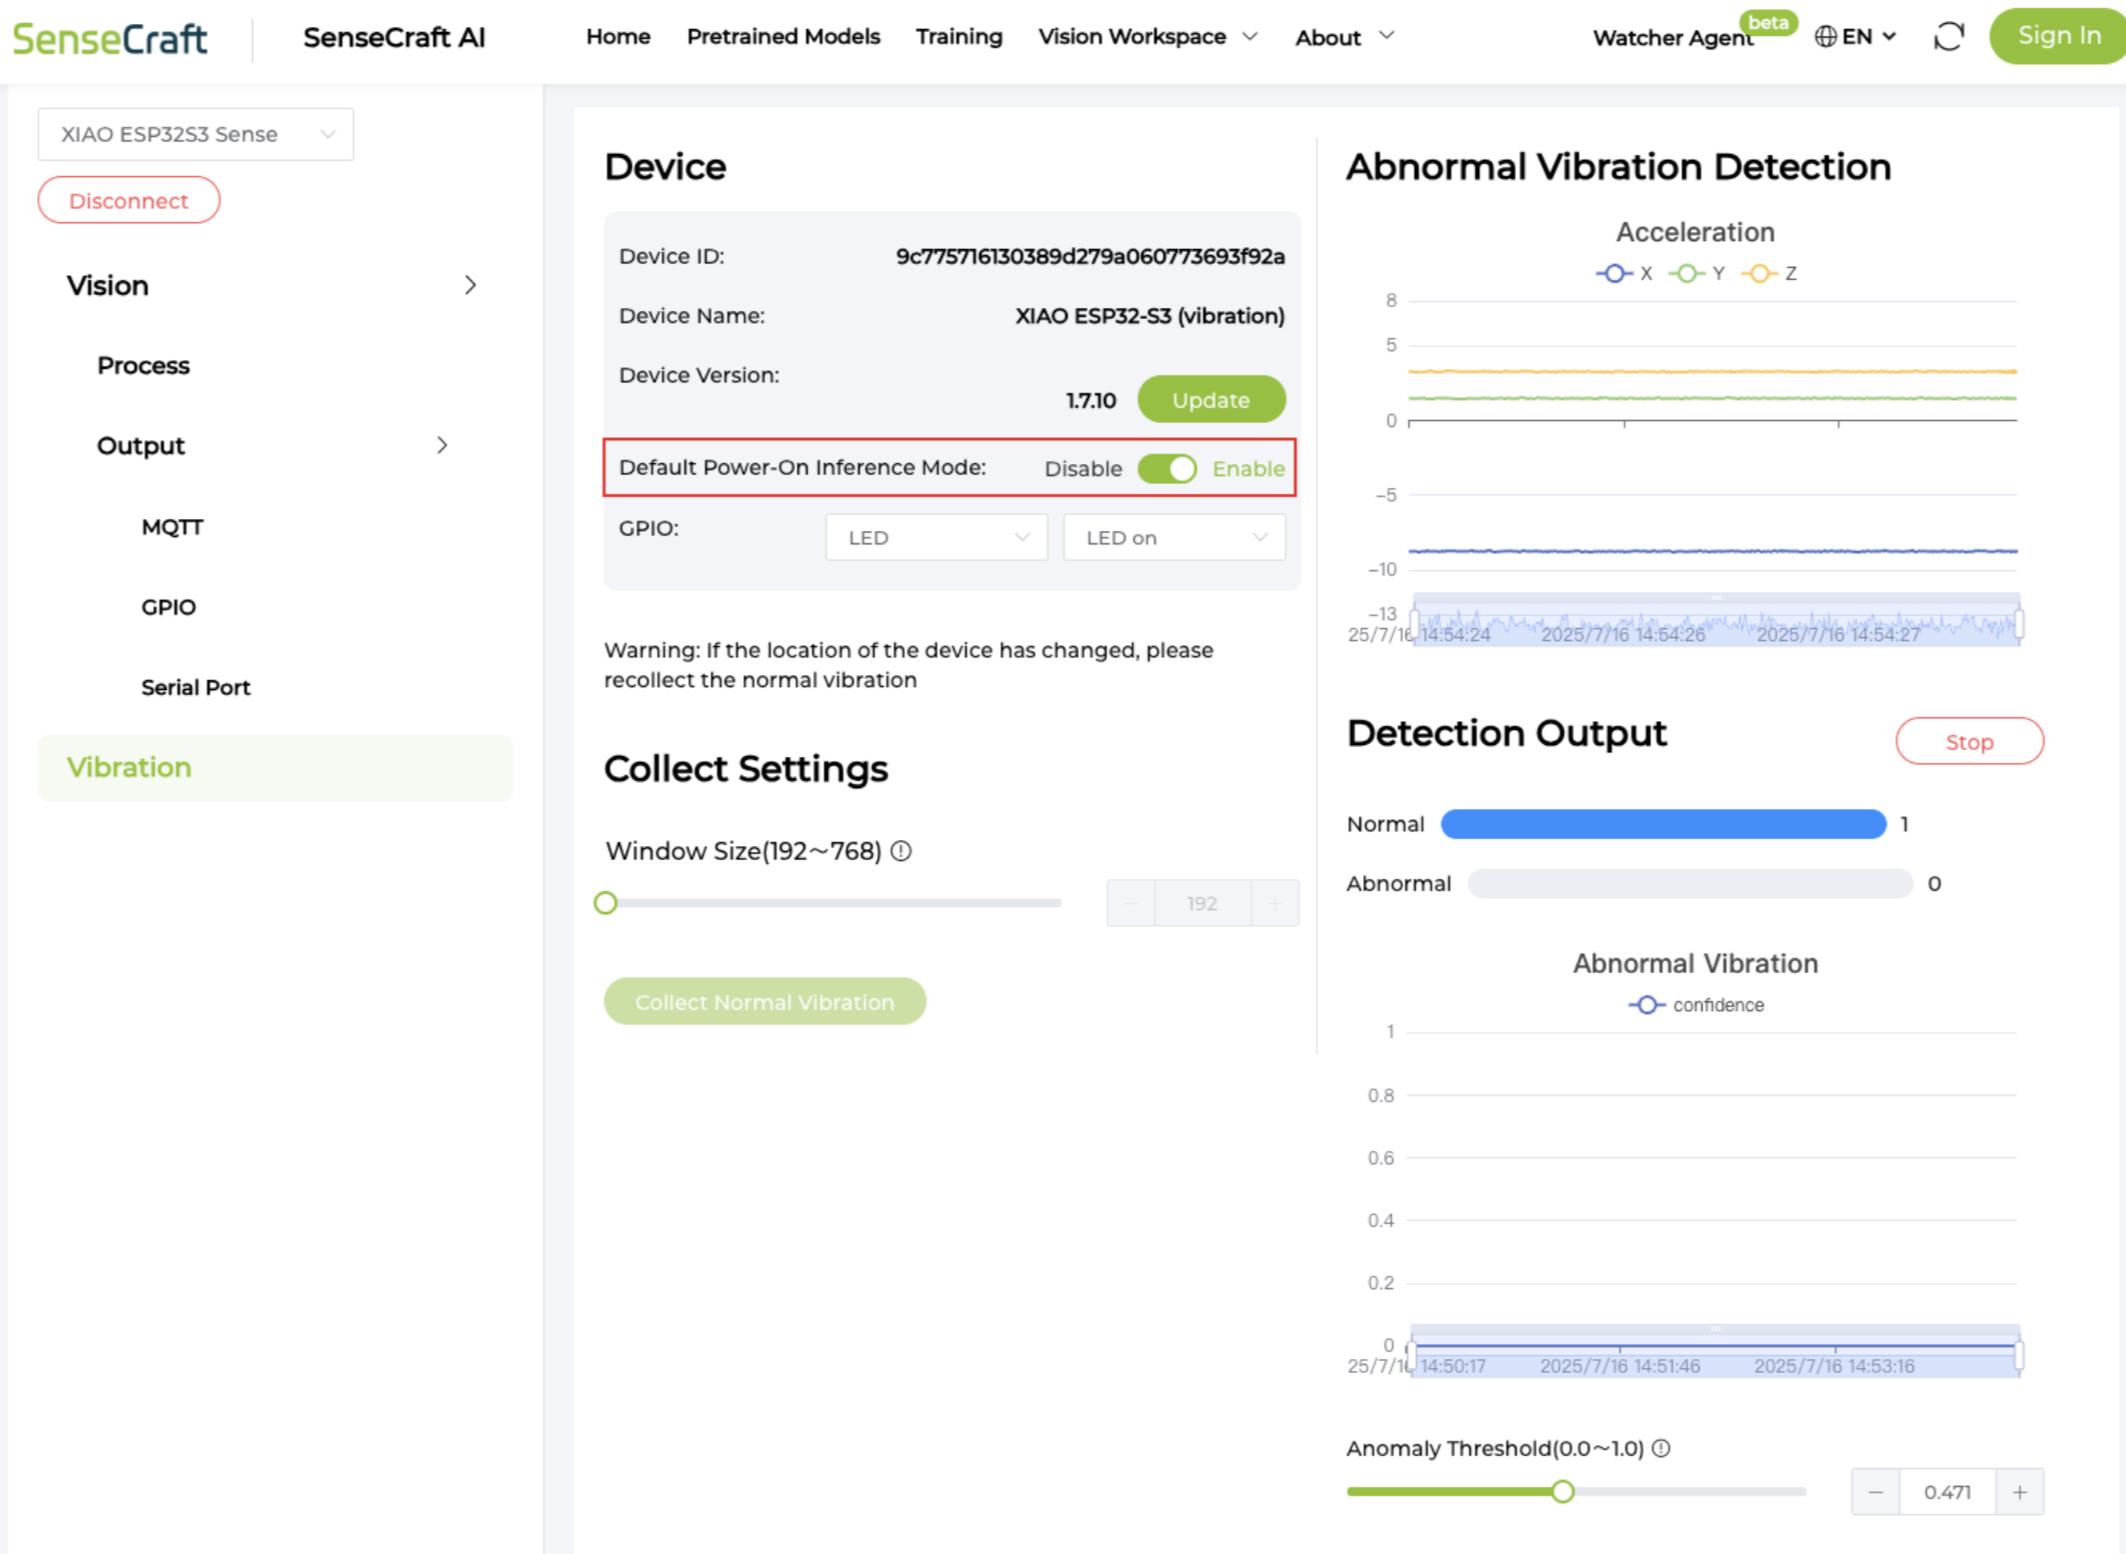
Step 5: Deployment & GPIO
You can configure the device to trigger external hardware when an anomaly occurs.
- Locate the GPIO Configuration section.
- Select a Pin (e.g., LED on Pin 21) and set the active level for the abnormal state.
- Enable "Default Power-On Inference Mode". This allows the device to run automatically when powered by a battery, without a computer connection.
3. Parameter Tuning Guide
If you find the detection is too sensitive (false alarms) or not sensitive enough, you need to tune the parameters.
UI Overview for Tuning
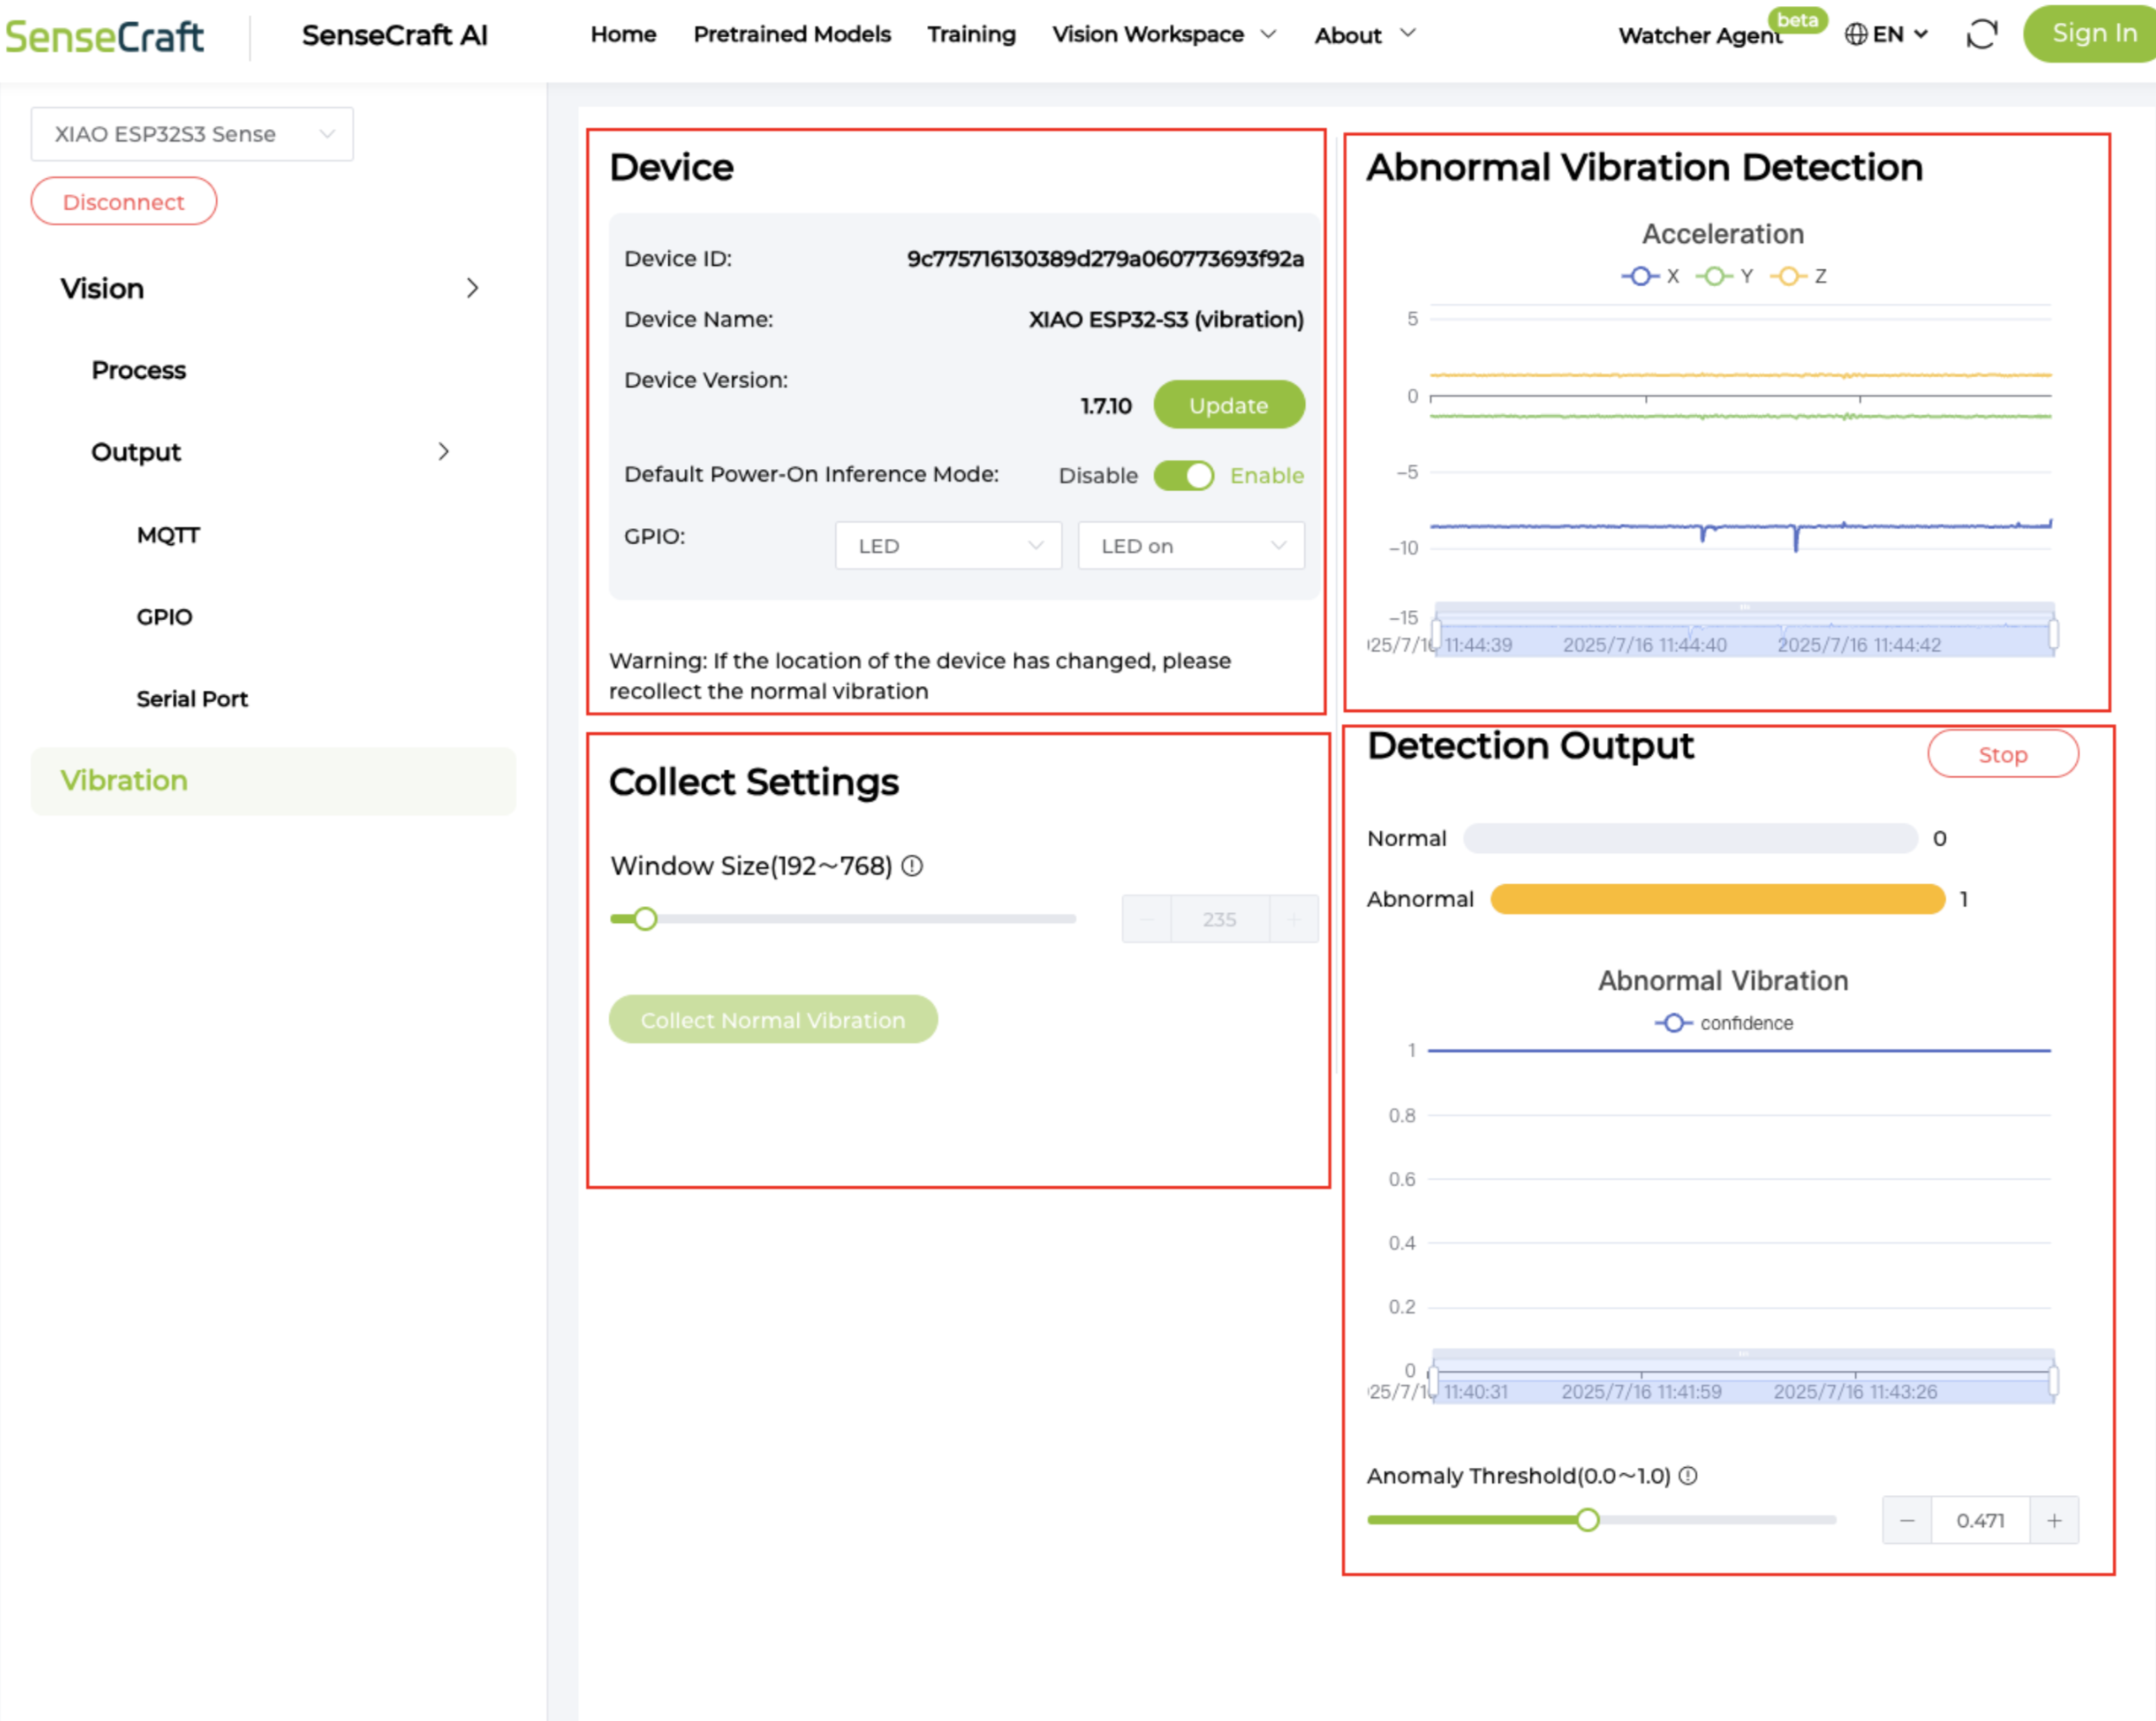
The UI helps you visualize the data:
- Device Info: Top area.
- Settings: Parameter and Collection settings.
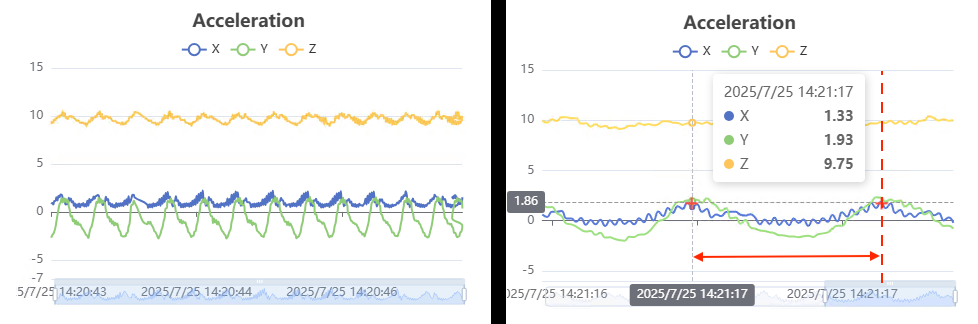
- Visualization: Real-time waveform (Time vs. Acceleration).
- Output: Detection results (0 for Normal, 1 for Abnormal).
Key Parameters
1. Window Size
Defines the number of sample points for one "cycle" of analysis.
- Default: 192 (approx. 1.92 seconds at 100Hz).
- How to Tune: The window must cover at least one complete vibration cycle. Use the waveform chart to measure the period of your machine's vibration. If the machine vibrates slowly, increase the Window Size.
2. Anomaly Threshold
Defines the sensitivity of the detection.
- Range: 0.0 to 1.0 (Default: 0.5).
- How to Tune:
- Too many false alarms? Increase the threshold (e.g., to 0.6 or 0.7).
- Missed anomalies? Decrease the threshold (e.g., to 0.3 or 0.4).
4. Algorithm & Theory
This section explains the technology behind the "Collect" and "Detect" buttons. It is optional for basic usage.
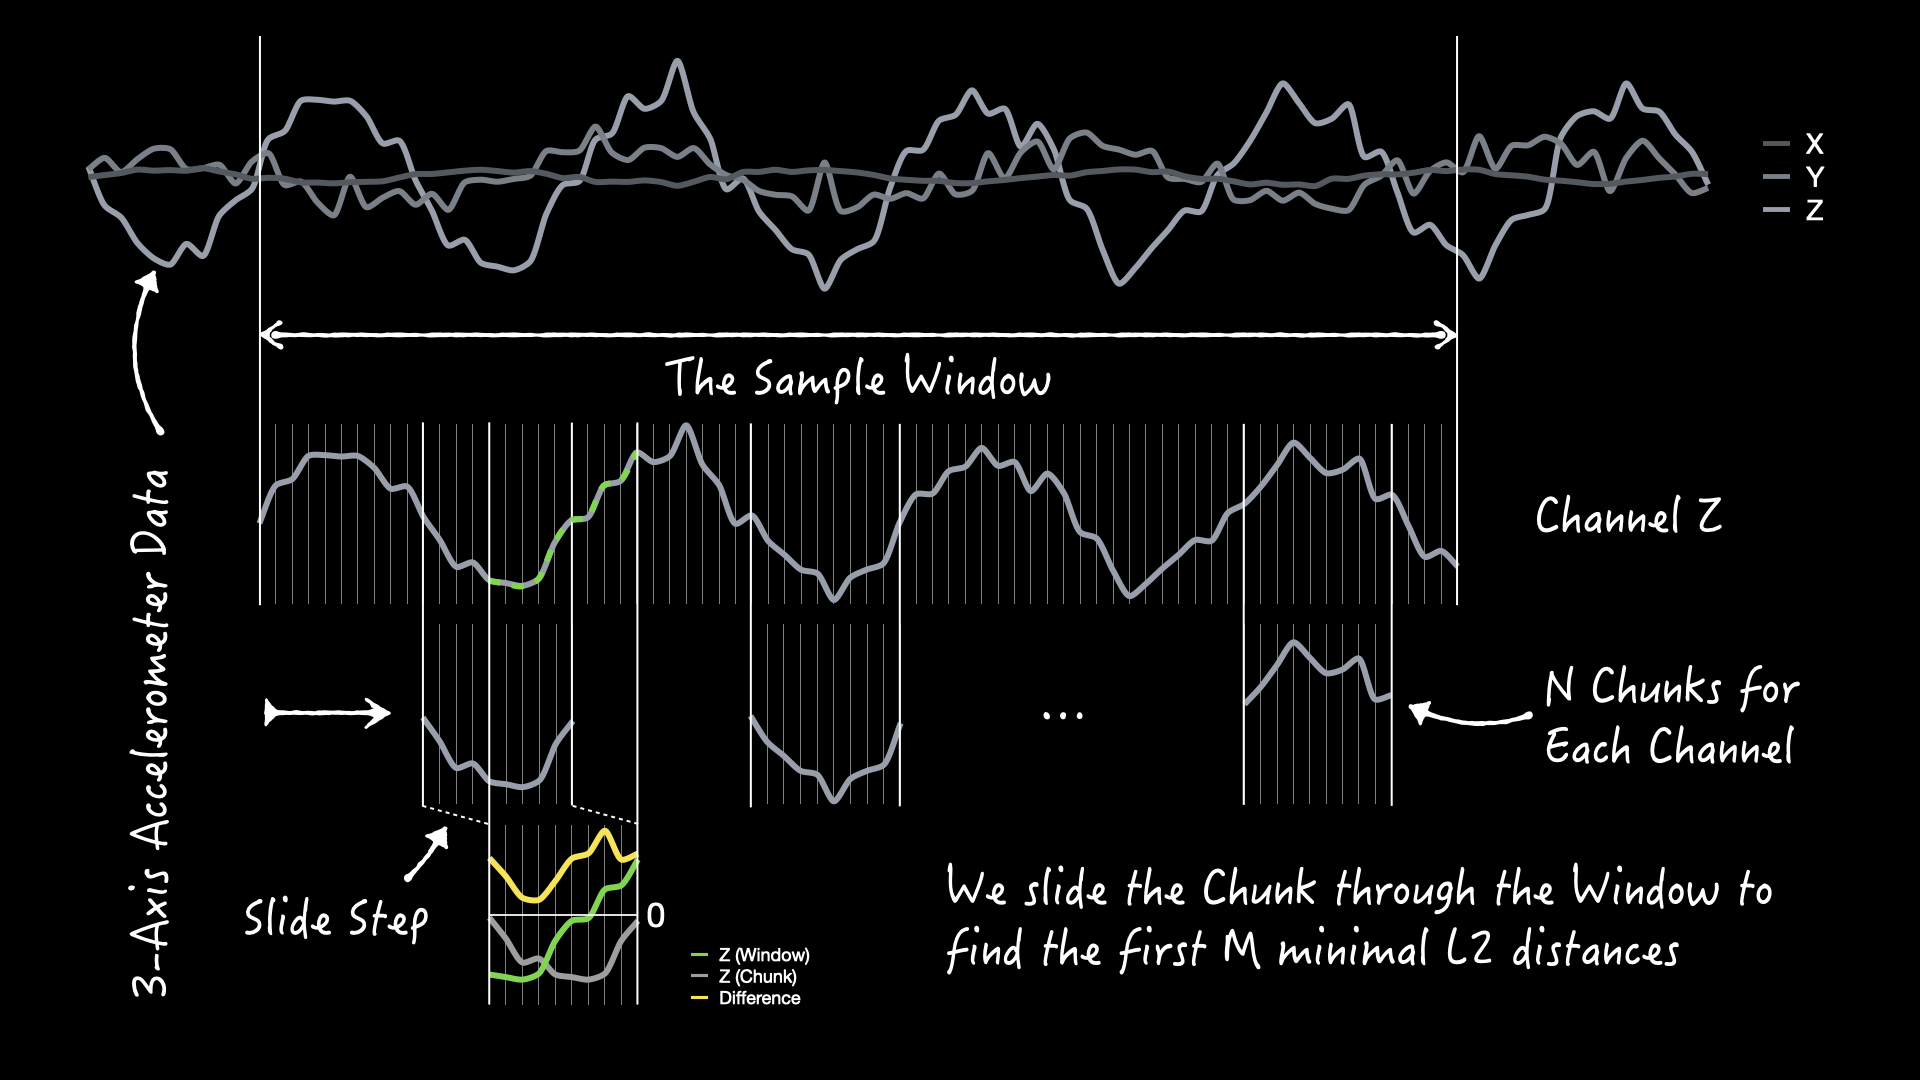
The system uses the Gyroscope Euclidean Distance Anomaly Detection (GEDAD) algorithm, adapted for 3-axis accelerometers. It consists of two phases:
Phase 1: Learning
The algorithm establishes a baseline template of normal vibration.
- Template Generation: Collects a set of normal 3-axis acceleration data.
- Threshold Calculation: The algorithm slides "chunks" of data across the template, calculating the Euclidean (L2) distance. It then statistically determines a threshold that separates normal variations from anomalies.
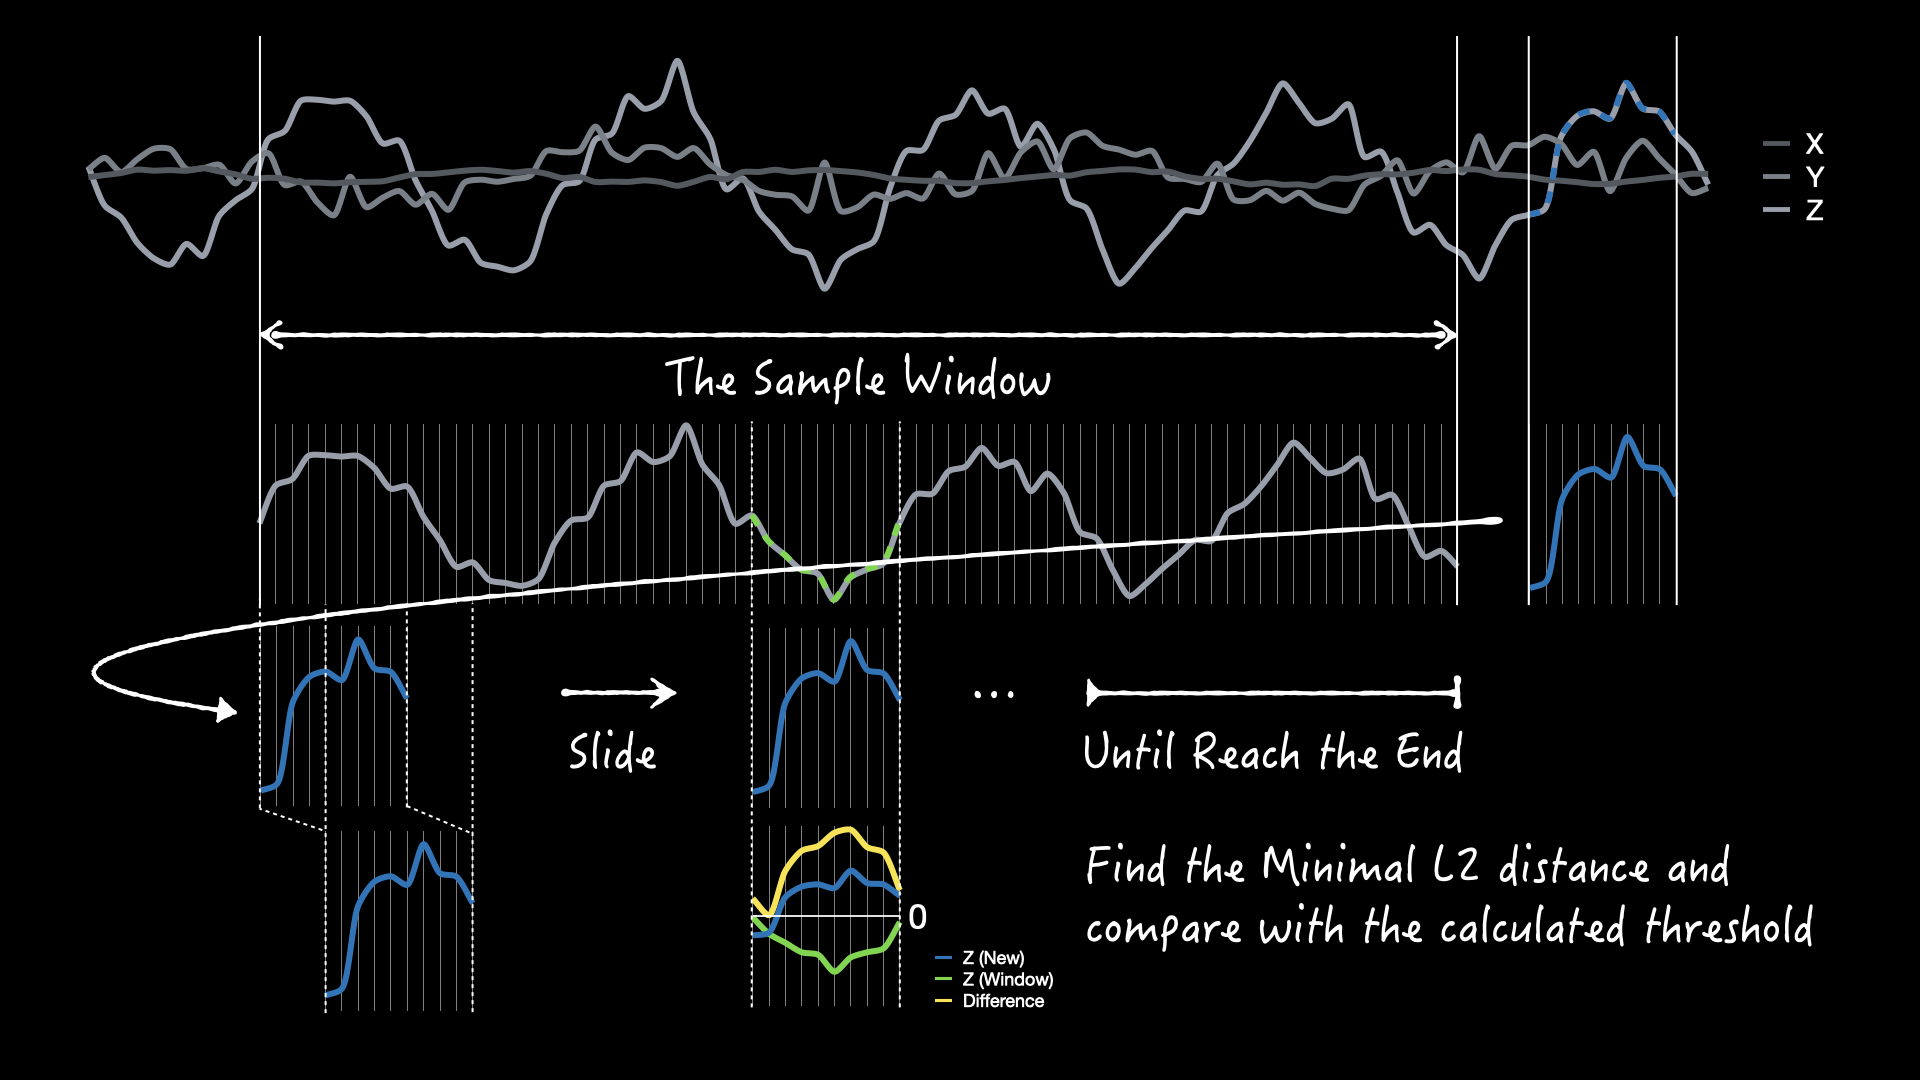
Phase 2: Inference
During real-time detection, incoming data is compared against the learned template.
- If the Euclidean distance of the real-time data is below the threshold relative to the template, it is Normal.
- If the distance remains above the threshold, it is flagged as Abnormal.
Advantages:
- Fast training speed.
- Low computational overhead (suitable for ESP32S3).
- Requires minimal data for training.
5. Application Scenarios
The Vibration Anomaly Detection Kit is ideal for predictive maintenance and safety monitoring in various fields:
- Industrial: Pumps, Air Compressors, Fans, Motors, Gearboxes.
- HVAC: Refrigeration Compressors, Cooling Towers.
- Robotics: AGV/AMR Systems, Agricultural Tractors.
- Data Centers: Chiller Units, Server Cooling.
- Consumer: Washing Machine balance alerts, Garage door mechanisms.
Open Source & Support
Source Code: GitHub - Seeed-Studio/AcousticsLab
Our algorithms and firmware are open-source. We are actively working on features like WiFi + MQTT reporting and FFT analysis. Feel free to submit an Issue or Pull Request.
Tech Support: