Dashboard
The Dashboard allows you to monitor device status and sensor data in real-time.
Overview
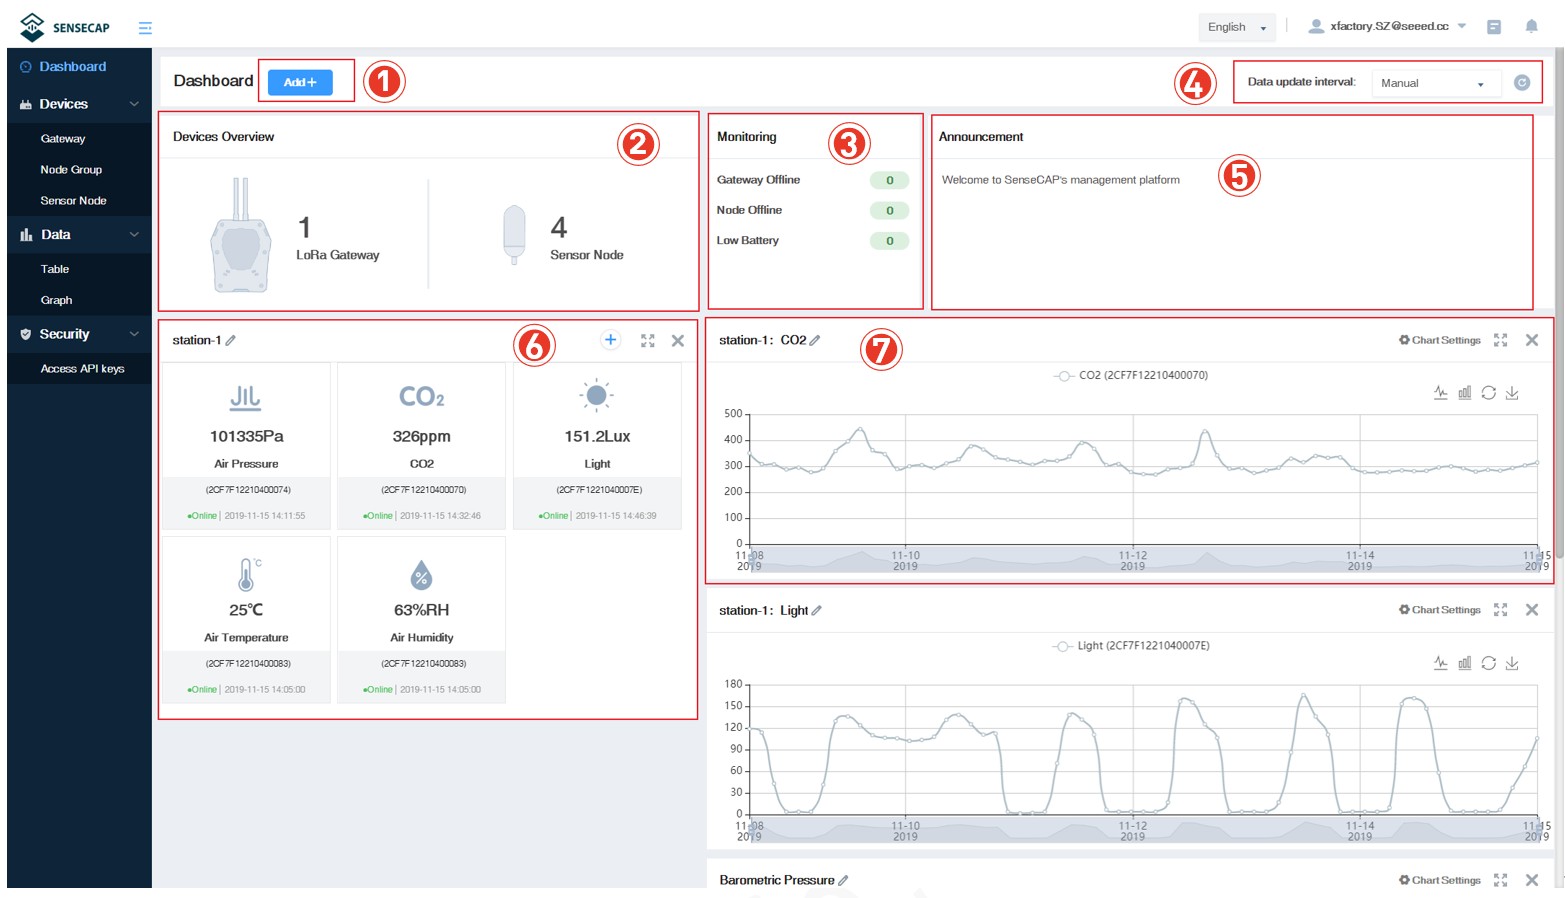
① Add “Scene” or “Chart”. ② Devices Overview: displays the total number of devices. ③ Monitoring: count all offline devices and low power devices. ④ Data update interval: sets how and at what time the page (web page) is refreshed. ⑤ Announcement: prompt for portal version upgrade and other information. ⑥ Scene: the corresponding visual display module is configured according to the sensor area. ⑦ Chart: one or more sensors of the same type can be selected to display historical data over a while.
Configure Scene
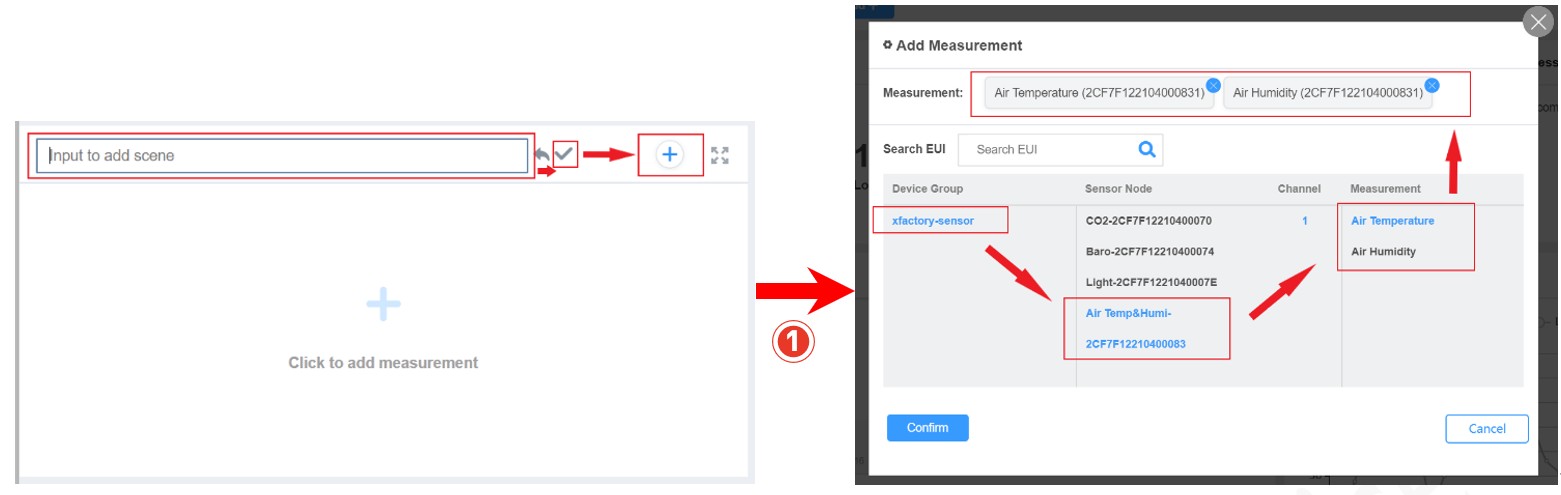
According to the installation site or application scenario, you can choose to create scene data, by grouping different data and showing the latest data in the form of icons. Example: There are several groups under the account: station-1, station-2, station-3…Create a scene for station-1. ① Customize the name, create the scene display of “station-1”, and select “Add measurement type”.
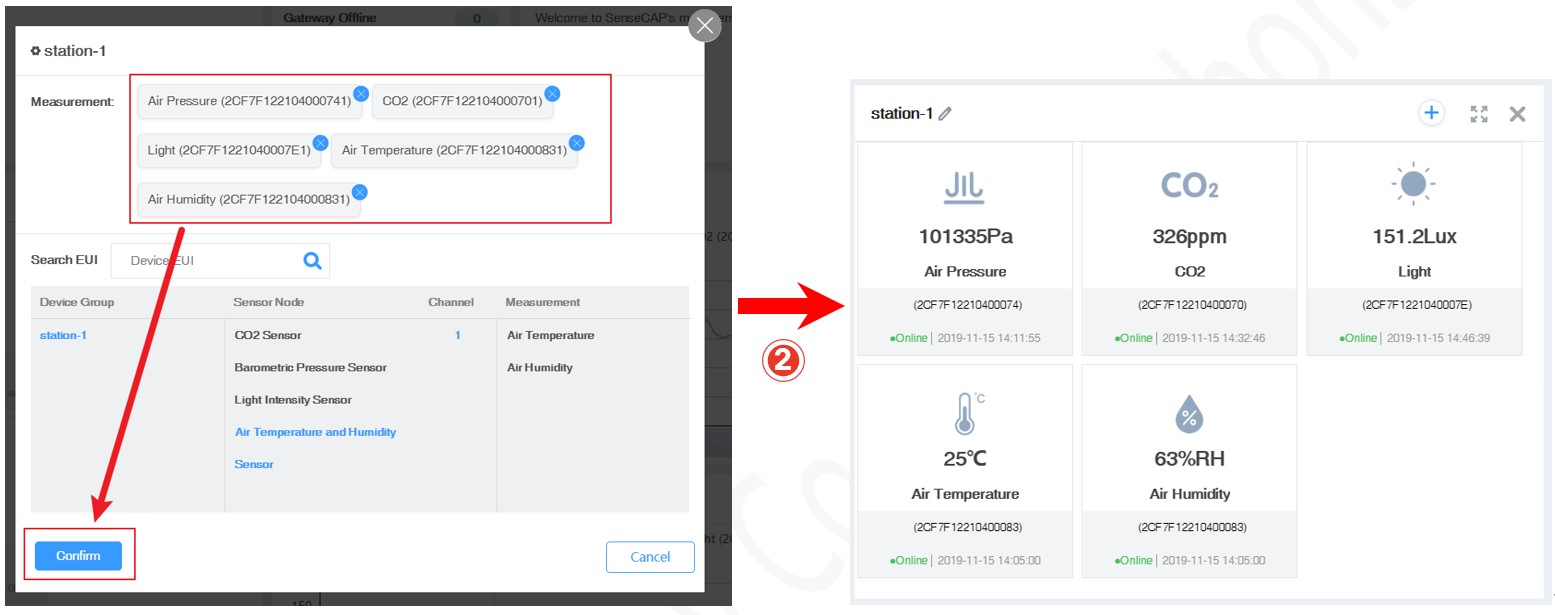
② Select the measurement data to be displayed under the group “station-1” and confirm.
Configure Charts
You can create charts to show the info such as measurement type, device EUI, time range, etc.
① Select “Add”- “Chart”.
② Customize the name and select “add measure type”.
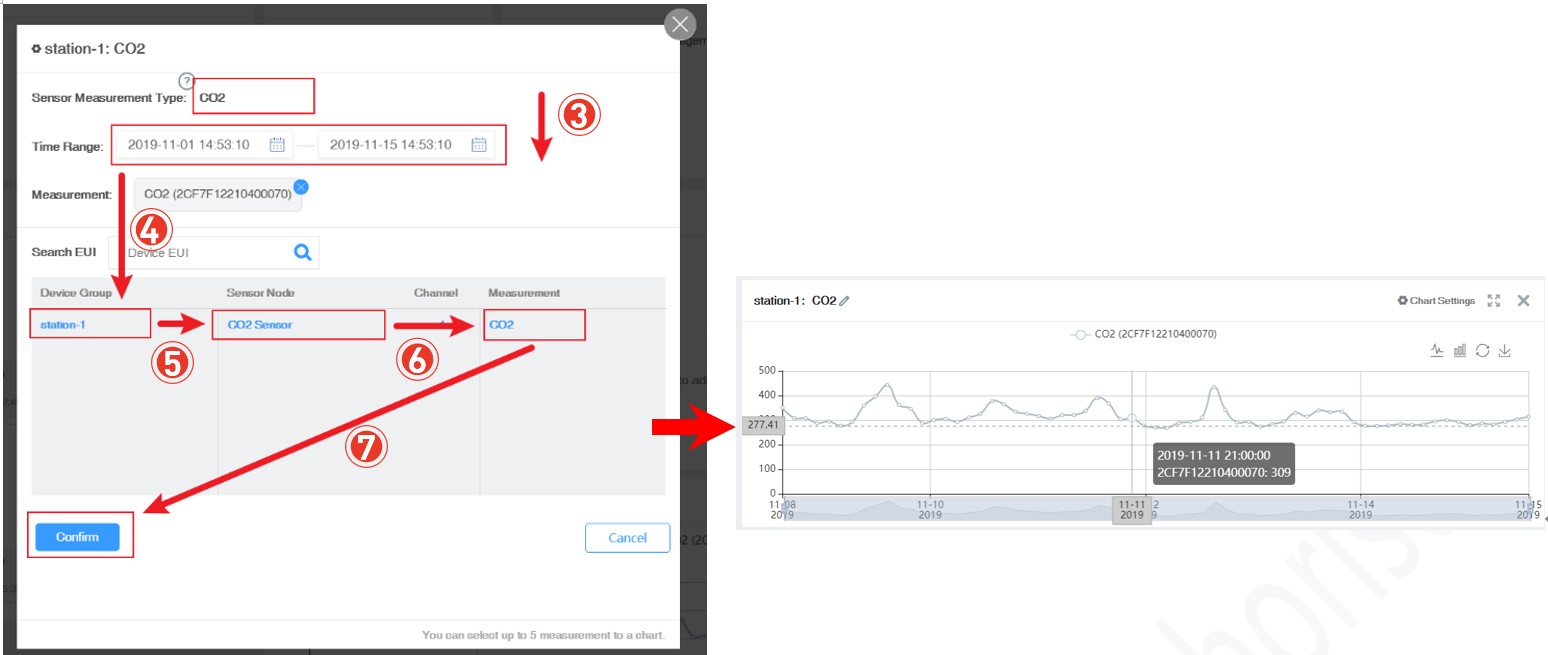
 ③ Select the data type and time to display.
④ Select a group.
⑤ Select the specific sensor node under the group.
⑥ Select the measurement type.
⑦ Confirm.
③ Select the data type and time to display.
④ Select a group.
⑤ Select the specific sensor node under the group.
⑥ Select the measurement type.
⑦ Confirm.
Only one measurement type can be added per chart. Add up to 5 curves per chart.