LoRaWAN Agricultural Environment Monitoring: Hardware, Deployment, and Interfaces
This is an operations dashboard, not a certified measurement system: the value shown is the raw value the node reported, with a unit attached.
What this solution does
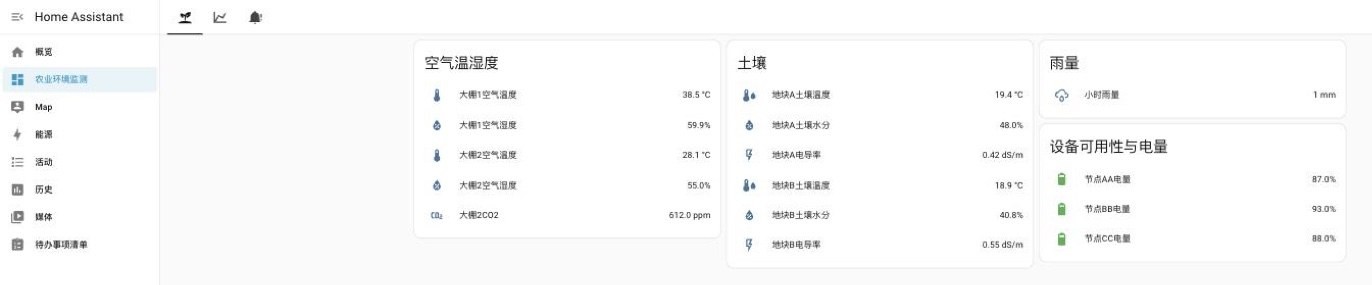
Soil moisture and EC in a greenhouse decide when to irrigate and when to feed; rainfall and soil temperature in an open field decide the same for a different crop. SenseCAP LoRaWAN nodes measure those values and report them over the air. The uplinks become Home Assistant entities with the correct unit, device class and state class: they appear on a dashboard, accumulate history, and raise a notification when a value crosses a threshold.
It is meant for greenhouses, open field plots, sites with no usable internet, and existing SenseCAP deployments that want a local dashboard without moving anything.
- Selection and deployment: reference design page
SenseCAP nodes work out of the box
S210x nodes report on the cycle configured on the node, with nothing to push to them. Entities are created by MQTT discovery with units and classes set; no YAML to write.
Third-party probes connect the same way
Existing RS485 or analogue probes come in through the S2100 data logger and use the same measurement mapping. The mapping, compose files, dashboard and automations ship in the public solution package; adding a quantity is one row in a config file.
Can run with no internet at all
ChirpStack runs on the M2 gateway, the bridge and Home Assistant on a local host. No cloud account, no outbound connection.
Change network server, keep the dashboard
Entity names are identical on the SenseCAP cloud, a self-hosted The Things Stack and a local ChirpStack, so switching paths leaves dashboards, automations and exports untouched.
What hardware you need
Four things on site: the LoRaWAN nodes, a gateway that hears them, a network server, and one Linux host with Docker.
① The nodes — SenseCAP S210x sensors measure directly; an S2100 data logger brings existing third-party RS485 or analogue probes onto the same LoRaWAN network. Nothing is deployed to either — they measure and report periodically on a cycle configured on the node.
② The gateway and network server — the three paths differ only here, and the choice decides whether the site needs internet.
| Device | Role | When to choose it | |
|---|---|---|---|
 | SenseCAP S210x Soil and air sensor nodes | Measure and report | Always. Pick the variant by the quantity you need and the band by your region |
 | SenseCAP S2100 LoRaWAN data logger | Third-party probe to LoRaWAN | You already have RS485 or analogue probes |
 | S-Soil MTEC-02B RS485 soil moisture, temperature and EC probe | Wires to the S2100 over RS485 (Modbus-RTU); the S2100 sends the LoRaWAN uplink | You need soil moisture, temperature and EC through the S2100 path |
 | SenseCAP M2 LoRaWAN indoor gateway | Forwards to the SenseCAP cloud, or runs ChirpStack itself | You want a fully local site: switch to the built-in network server in the M2 web interface |
 | reComputer R12 Series LoRaWAN gateway and industrial controller | Is the gateway, and hosts The Things Stack on the same machine | You are self-hosting The Things Stack and have no gateway |
 | reRouter CM4 reRouter CM4 host | Runs the network server, or runs the dashboard | You need a host and do not already have a Linux machine with Docker |
③ The dashboard host — any Linux machine with Docker. It runs Home Assistant, the MQTT broker and agri-env-bridge, and needs no inbound internet access.
Order nodes, gateway and concentrator for the same band (EU868 / US915 / AS923, etc.). The band is fixed at the factory and cannot be changed in software. For the two self-hosted paths you also need each node's DevEUI, JoinEUI and AppKey to register it on the network server.
Negative Selection Boundaries
- High-Bandwidth Streaming: LoRaWAN is designed for periodic telemetry (5–60 min intervals); for continuous video monitoring or sub-second control, use 4G or wired industrial Ethernet.
- Metal Enclosures and Silos: Thick metal silos or heavy underground obstructions cause severe RF attenuation; use external antennas or RS-485 wired sensors.
How a site is deployed
1. Mount the nodes
Soil probes read the layer they sit in. Readings at 10 cm and at 40 cm are separate entities (soil_moisture_10cm … soil_moisture_40cm). Decide the depth from the crop's root zone before digging the first hole; moving a probe later makes the history already recorded on that entity incomparable.
Radio coverage has to be measured on site; no range figure is given here. Before fixing sensor positions, confirm on site that the gateway receives each node's uplinks.
2. Install the software — 3 to 6 steps depending on the path
The per-device steps and application packages are on the reference design page; pick a configuration for your site and download.
Outline:
- Deploy Home Assistant and the broker on the Linux host (all three paths, one Docker compose deployment).
- Bring up the network server — nothing to do on the cloud path; on the ChirpStack path switch the M2 to its built-in local network server in the web interface, or bring up a ChirpStack compose stack on a Linux host; on the The Things Stack path bring up the stack with its Postgres and Redis on the reComputer R12 Series gateway.
- Install the decoder (self-hosted paths only) — the payload formatter on The Things Stack, or the device-profile codec on ChirpStack. Without it, no entity appears.
- Join the nodes (self-hosted paths only) — register each DevEUI, JoinEUI and AppKey on the network server.
- Deploy the bridge with the source configured for the path and the broker credentials filled in.
- Import the dashboard and automations and confirm the entities carry values.
Estimated time 45 minutes, difficulty intermediate. The The Things Stack path takes longest: the concentrator has to be fitted physically and the stack brings up its own database and cache.
Verification is the same on all three paths: the Lovelace dashboard imported in the last step shows the entities with values.
Available interfaces
Everything leaves through one MQTT broker on port 1883, running on the dashboard host. Three retained topics carry the whole interface.
- Home Assistant — zero configuration. The bridge publishes discovery configs, so entities appear on their own with the right unit, device class and state class; no YAML is written by hand.
- An irrigation or farm-management system — subscribe to
agri_env/sensecap_<deveui>/<entity_key>/statefor the value andagri_env/sensecap_<deveui>/availabilityfor whether the node is still alive. Both are retained, so a subscriber that connects late still gets the current picture immediately. - Your own service — the discovery config on
homeassistant/…carries the full entity metadata (unit, device class, state class, device identifiers), which is enough to build a schema.
Topics and payloads
| Topic / port | Payload | Retained |
|---|---|---|
homeassistant/sensor/sensecap_<deveui>/<entity_key>/config (1883) | Discovery config, one per entity: name, unique_id, object_id, state_topic, availability_topic, unit_of_measurement, state_class, device.identifiers | Yes |
agri_env/sensecap_<deveui>/<entity_key>/state (1883) | The value of one measurement, e.g. 33.8 | Yes |
agri_env/sensecap_<deveui>/availability (1883) | online or offline | Yes |
Entity naming: the entity id is sensor.sensecap_<deveui>_<entity_key>, with the full DevEUI in lower case; a shortened form collides between nodes whose addresses share a suffix. Changing the rule later means clearing the broker's retained messages and Home Assistant's entity registry together, otherwise the old topics come back after a restart.
Keep the broker on a trusted LAN; do not expose it to the internet. Its credentials are in .env files on the host, and on the ChirpStack path the LNS-side broker runs without authentication on the compose network.
Performance and measured data
Runtime and key parameters
One service, agri-env-bridge, sits behind all three paths and runs on the dashboard host alongside Home Assistant and the MQTT broker.
| Path | What the bridge reads |
|---|---|
| SenseCAP cloud | The SenseCAP OpenAPI plus the cloud MQTT stream; backfills history month by month on first start |
| The Things Stack | The stack's MQTT integration, after the payload formatter has decoded the uplink |
| ChirpStack | The ChirpStack MQTT integration, after the device-profile codec has decoded the uplink |
- Measurement mapping:
assets/config/measurements.yaml. It covers soil temperature and moisture at four depths, soil tension, heat flux and volumetric water content; air temperature, humidity, CO2, barometric pressure, PM2.5 and PM10, noise; pH, dissolved oxygen, turbidity, TDS, salinity and water temperature; wind speed and direction, solar radiation, sunshine duration, PAR and light quantum; flow rate, total flow, liquid level and water leak. Adding a quantity is one new row, no code change; values are never scaled, only given a unit. - Offline threshold: defaults to two S210x reporting cycles plus margin. On expiry the node's entities go unavailable in Home Assistant, with the last value kept.
- Deduplication: readings are keyed on
(DevEUI, measurementId, timestamp), so a cloud backfill and the live stream never double-count the same reading; when an entity has two values, the later one wins. - Functional check: recorded uplinks replayed into the broker in all three source formats created 15 entities.
- Reproduction: Replay tests are located in repository
tests/replay_bench.py; runpython3 tests/replay_bench.py --fixtures tests/data/to verify three uplink types and automatic registration of 15 entities.
Known degradation
- The broker is a single point of failure: while it is down, none of the three paths updates. State topics are retained, so Home Assistant recovers the last value after a restart.
Data and asset provenance
- The
measurementIdto physical quantity table inassets/config/measurements.yamlwas read out of the SenseCAP decoder sources at Seeed-Solution/SenseCAP-Decoder, commitd0a2342—third_party/SenseCAP-Decoder/S210X/Helium/SenseCAP_S210X_Helium_Decoder.jsfor the S210X series andthird_party/SenseCAP-Decoder/T1000/TTN/SenseCAP_T1000_TTN_Decoder.jsfor the T1000. Each entry in the YAML carries the source file and line it came from. - That repository's licence is unconfirmed: it has no LICENSE file and no licensing section in its README; the only licence declaration in it is a third-party contributed file header reading
Unlicensed for internal use. The solution package does not redistribute the decoder. It uses only theid -> quantitycorrespondence; the deployment guide for the two self-hosted paths links the upstream repository. Confirm licensing with Seeed before distributing the decoder itself. - The
device_class,unit_of_measurementandstate_classcolumns are not from the decoder — that information does not exist there. They were derived from the Home Assistant sensor documentation. - Architecture diagrams on the reference design page are drawn from an Architecture IR; product art comes from the reviewed Seeed product sticker catalog.