HVAC Setpoint Control on an Edge Gateway: Hardware, Deployment, and Measured Results
This is a supervisory setpoint recommender, not a safety-certified control system: the plant's own interlocks and safety controls take precedence, and no energy-saving figure is given.
What this solution does
A central HVAC plant in an office, a mall or a factory usually runs to a fixed schedule: the same setpoint whether the floor is full or empty. This solution puts a gateway beside the plant that reads the HVAC controller and an energy meter into one point model, learns a setpoint recommendation from that building's own historical data, and writes it back to the controller; a write counts as applied only after the value has been read back from the field and matches what was sent.
It is used on central plant: chillers, air handlers, and the controllers in front of them. It is not for split-unit air conditioners, and it is not on the safety loop.
- Selection and deployment: reference design page
- Source repository: not published.
github.com/Seeed-Solution/Solution_HVAC_SmartControlis not publicly accessible.
Existing controllers and meters connect as they are
Controllers that speak OPC UA, Modbus TCP, Modbus RTU over RS-485 or BACnet/IP are not replaced, and the SDM630 meter has a built-in template. Up to 2,000 points, of which up to 50 may be writable.
Every write is read back and verified
Last-known-good value, quality, timestamp and priority are frozen before the write; the point is re-read after a settle delay and compared within a tolerance. A readback whose quality is not good does not pass.
Automatic rollback and alarms on faults
Readback mismatch, source offline, prediction disabled, operator abort and a partially applied batch all trigger a rollback. Alarms are keyed by cause, so a repeating fault re-uses the open alarm.
Measured capacity: 2,000 points at 349.99 events/s
Against a 350.0 target, measured in one 180 s loopback run on a reComputer R2000 series. Conditions are in the appendix.
What the console shows
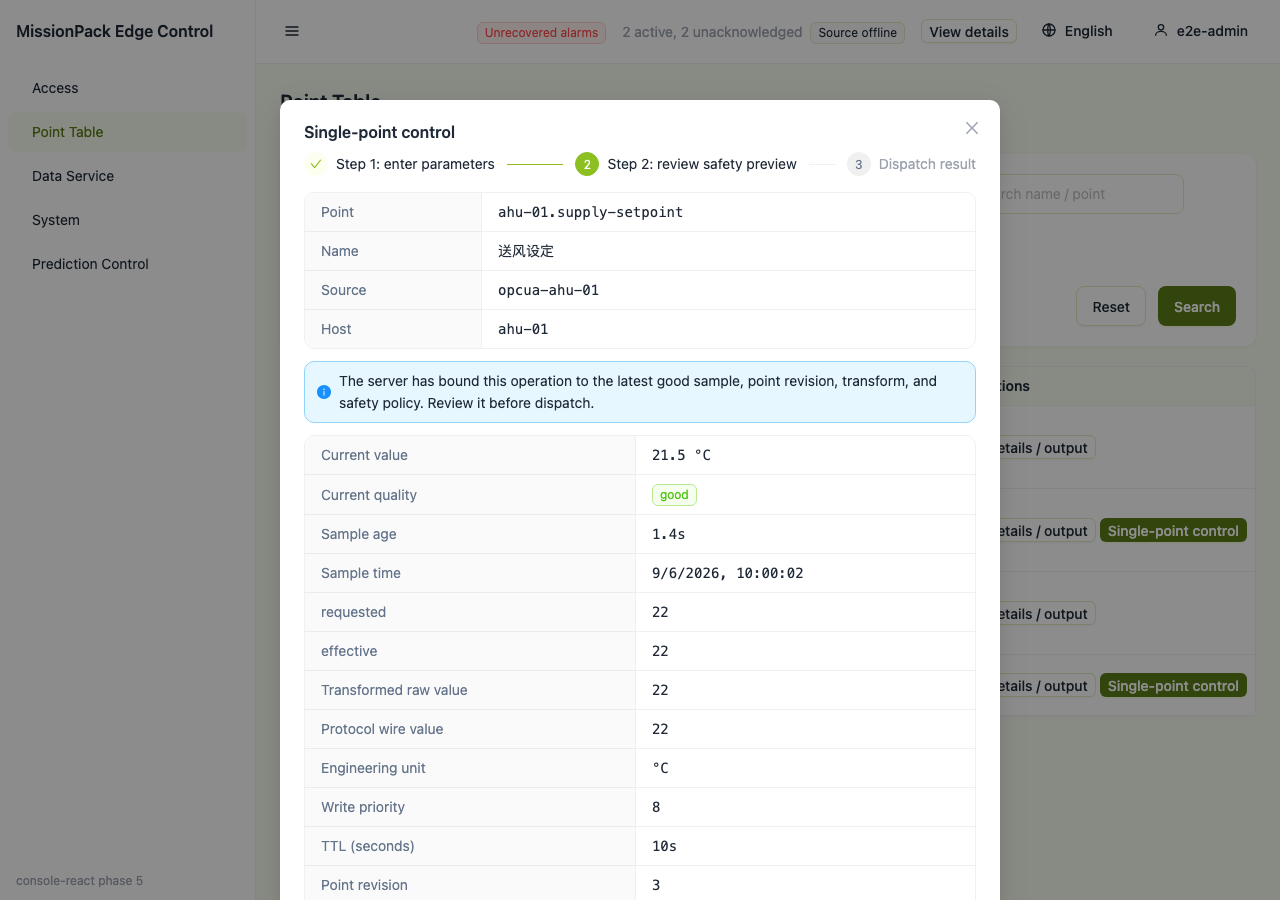
The running console renders the point table with per-point quality, the access page with each source and its registered point count, and a command-receipt ledger. The ledger is where the write path is visible: each row carries the requested value, the effective value, the actor, the protocol acknowledgement and — after the settle delay — the readback result. A write whose register was changed out of band reads mismatched, compensated with the value that was found, and the compensation command issued by plugin:prediction:rollback appears as the next row.
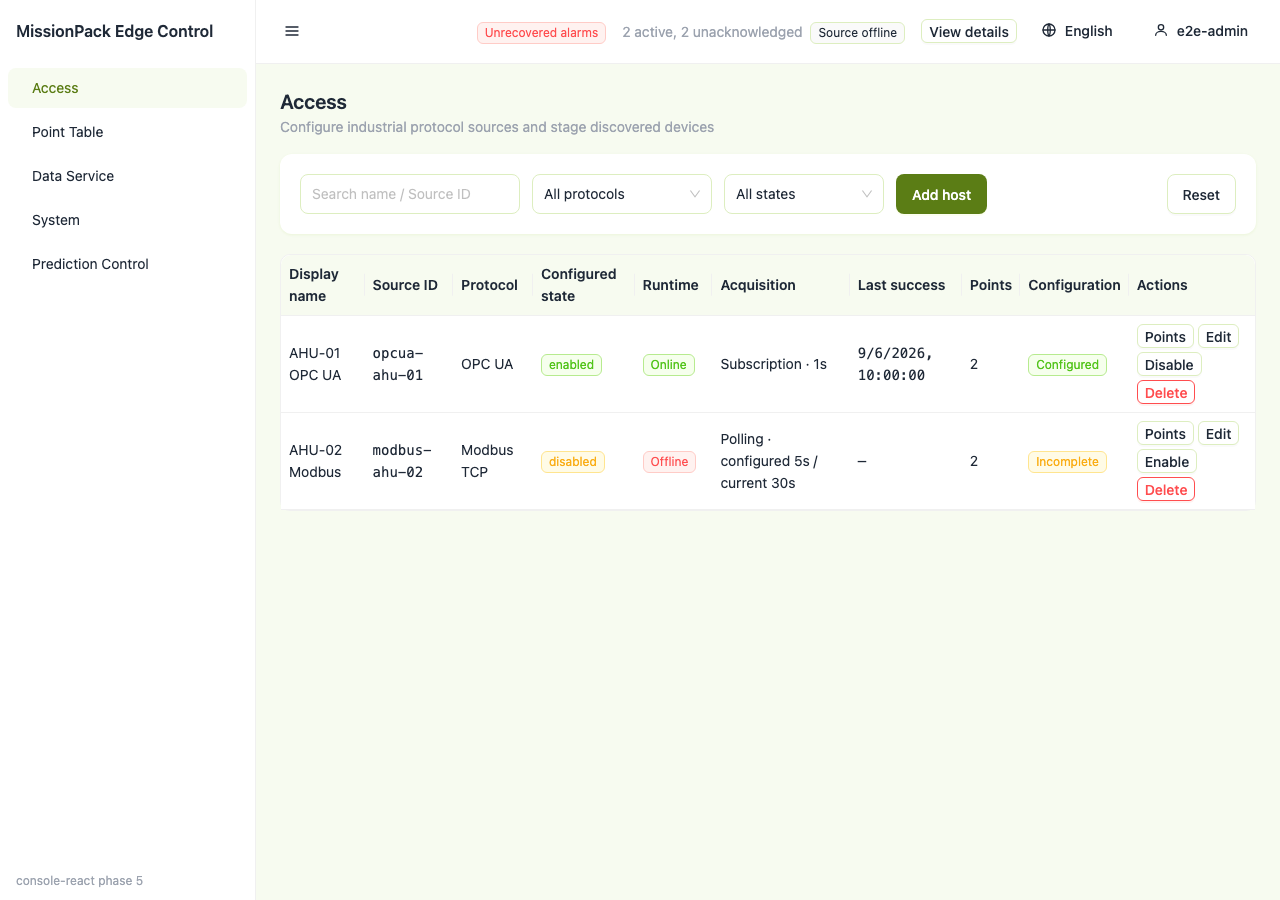
The access page lists every source with its registered point count; this is the first place wiring shows up as working:
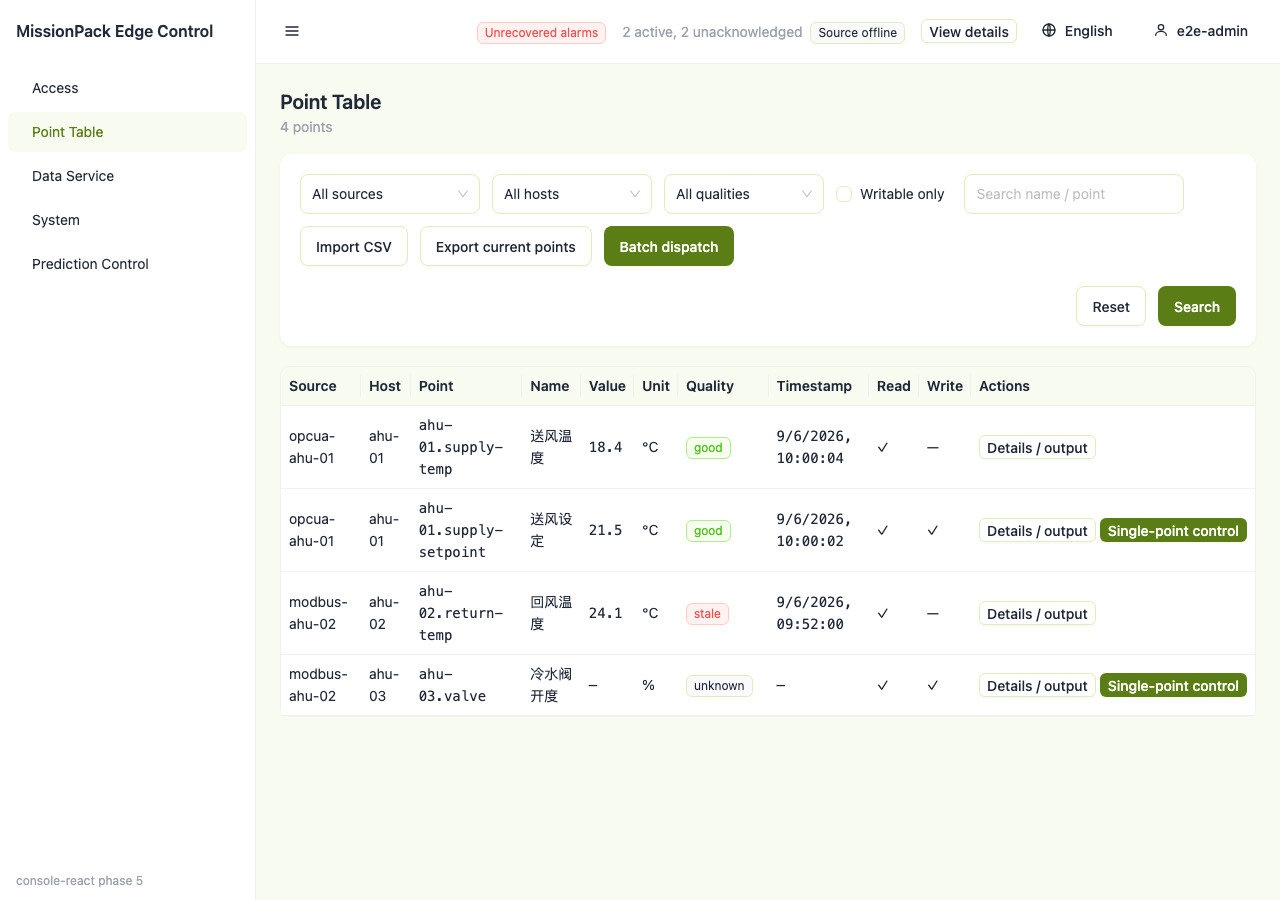
The point table carries per-point quality, so a point that is not reading good is visible here:
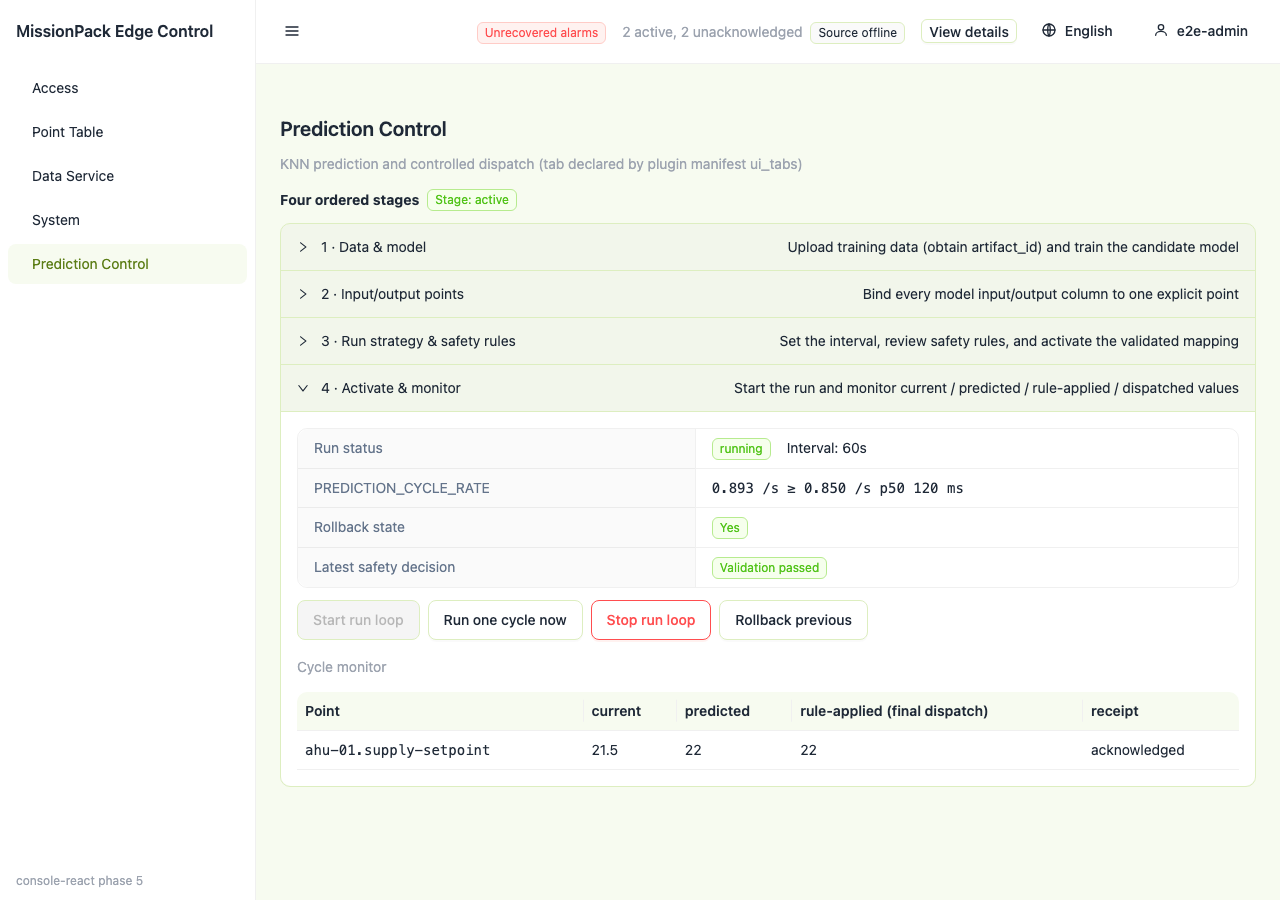
The prediction runtime page shows this round's recommended setpoints, the history window behind them and the current control mode:
The write path is visible in the command receipt ledger — requested value, effective value, actor, protocol acknowledgement and readback each get a column:
The captures above are connected to the package's own protocol simulators, not to a physical meter or controller; the gateway side runs the shipped software.
What hardware you need
Three things: a controller you already have, a meter, and one Docker host.
① The HVAC controller — whatever is already in front of the plant, as long as it speaks OPC UA, Modbus TCP/RTU or BACnet/IP. For a dry run with no plant attached, the package ships an OPC UA simulator on port 4841.
② The energy meter — an Eastron SDM630 on the Modbus V2 register map, over Modbus TCP, a Modbus TCP gateway, or RS-485. Ten read-only points: three-phase voltage and current, total active power (kW), total power factor, frequency, imported active energy (kWh).
③ The gateway host — the only device you need to choose. The service is a Docker workload on x86-64 or arm64, so a Linux machine already on the plant network is a supported target.
| Gateway | Storage | When to choose it | |
|---|---|---|---|
 | reComputer R1124-10 4 GB RAM, RS-485 / RS-232 / DI / DO on board | 16 GB eMMC | The history lives on a server; the gateway keeps a short local window |
 | reComputer R1125-10 same board, larger eMMC | 32 GB eMMC | Months of operating history stay on the gateway; the training set can be re-imported locally |
The R1100 series carries RS-485 on board, so a meter on RS-485 needs no USB adapter. The service itself needs about 1 GB of disk; storage decides how much history you can look back on locally without a server.
Other prerequisites: Docker Engine 20.10 or newer, host ports 8280 and 4841 free, and at least one week of historical operation as CSV or Excel with timestamp, setpoint, measured temperature and power consumption columns.
How to deploy on site
1. Install the hardware: wiring
The built-in SDM630 template defaults to big-endian bytes and words, taken from the vendor's published default. Read a register with a known physical value and compare against the meter's own display. Voltage and frequency that are close but wrong, or imported energy that jumps backwards, usually mean a word-order setting error; check word order before wiring.
Put the gateway on the same network as the controller and the meter (or its Modbus TCP gateway). For Modbus RTU, match the baud rate, parity and unit id to what the meter is configured for ; a mismatch shows only as a timeout, with no error message. Use the serial-device deployment profile: the standard Docker profile attaches no host serial device, so there is no /dev/ttyUSB0 inside the container.
2. Software: three steps
The per-step form fields and application packages are on the reference design page; pick a configuration for your site and download.
Outline:
- Deploy the service — Docker deployment, either on the machine running the deployment tool or over SSH to a device on the plant network. The form carries the meter transport, the OPC UA endpoint, the safety limits, the control mode and the alarm thresholds.
- Open the console — create the first administrator and confirm both sources are online with their expected point counts. The access wizard asks for address and poll interval per protocol:
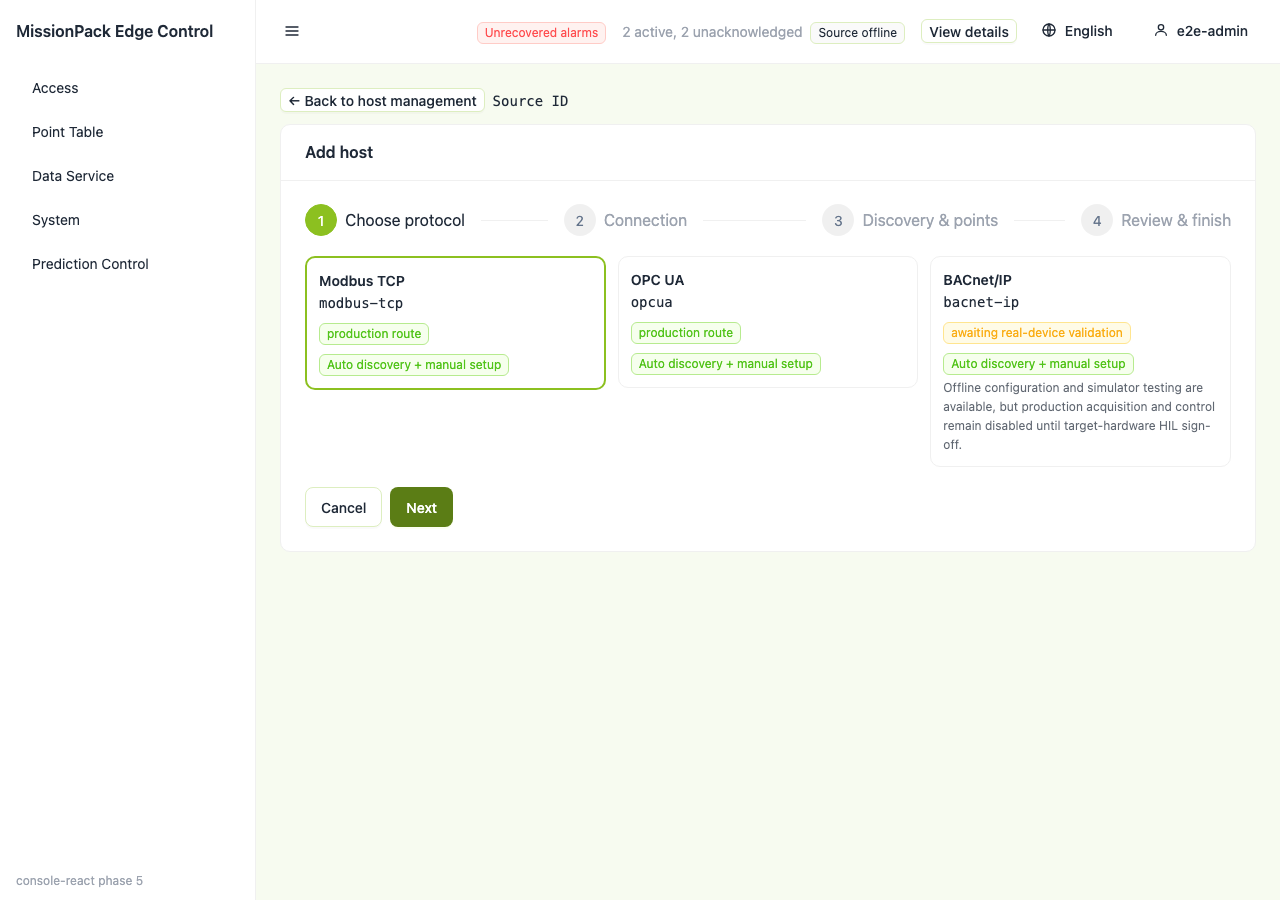
- Commission — register the meter, run predictions in observe mode, inject faults on purpose, and only then enable writes. Before a batch goes out, confirm on the selection page exactly which points it covers:
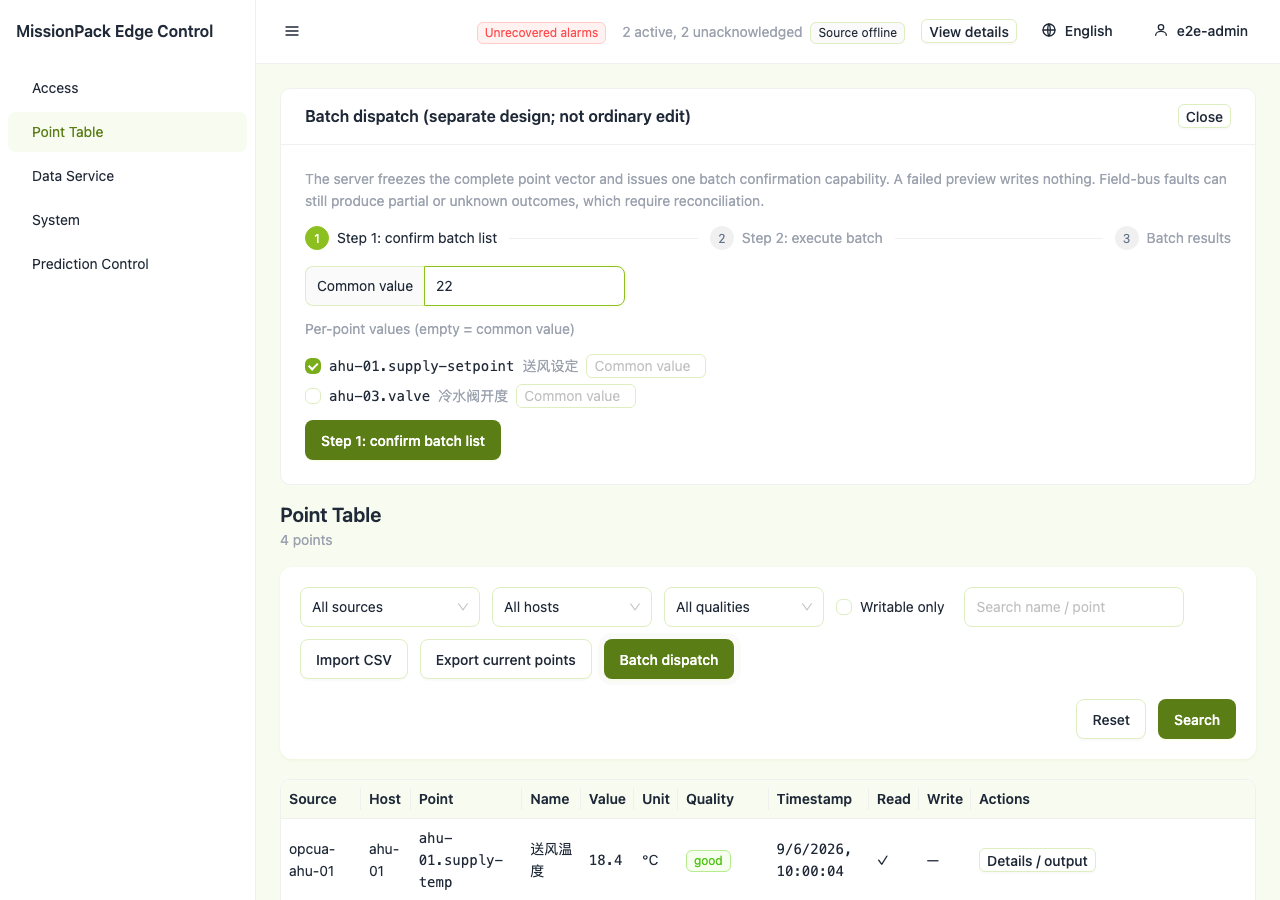
Leave Control Mode at observe and leave Safety Baseline Approved By blank. While the approver is blank the baseline shows as unapproved; entering a name means that engineer signs off the safety limits.
The estimate to a running console with points reading is about 60 minutes. Commissioning takes longer, because it includes a full occupancy cycle of observe-mode predictions reviewed by whoever operates the plant.
The published missionpack-knn:v1.6.5 does not carry the SDM630 template, the rollback coordinator or the alarm envelope. On v1.6.5 the observe-mode substeps still apply; the meter, rollback and alarm substeps cannot be completed.
Available interfaces
Everything the deployment exposes sits behind one HTTP port on the gateway host. Nothing leaves the plant network unless northbound publishing is turned on.
- Operators — the browser console on
8280: point table with per-point quality, meter registration, prediction runs, command receipts, alarm banner. - Monitoring —
GET /system/runtime-metrics. With northbound publishing enabled it carriesnorthbound.spool.queuedandnorthbound.spool.dropped;queuedback to 0 withdroppedunchanged is the check the commissioning step asks for. - Your own system — the same console API surface behind
8280, plus the health endpoint the deployment waits on at startup.
Full endpoint list
| Port / endpoint | What it serves | Needs internet |
|---|---|---|
8280 / | Browser console | No |
8280 /system/runtime-metrics | Runtime counters, northbound spool counters | No |
8280 /api/v1/health | Health check; startup allows 30 s | No |
4841 | Built-in OPC UA simulator, for a dry run | No |
On a command receipt, read the readback column: protocol_acknowledged only means the controller accepted the frame. The readback column (matched, or mismatched, compensated with the value found) is what the field actually holds. A compensation issued by the rollback coordinator appears as its own receipt immediately after the write it undid, so the audit trail reads in order without joining two tables.
Container logs rotate at 10 MB with four backups (docker logs missionpack_knn). Export the command audit trail, the rollback journal and the alarm history before they age away.
Southbound protocol scope
All points sit in one registry, capped at 2,000 points, of which at most 50 may be writable. The 10 SDM630 meter points are read-only; they count toward the 2,000 and not toward the 50.
| Transport | Role | Constraints |
|---|---|---|
| OPC UA | Read and write on the HVAC controller | Endpoint set per deployment; built-in simulator on 4841 |
| Modbus TCP | Meter and controllers | Unit id and port per source; direct or through a TCP gateway |
| Modbus RTU (RS-485) | Meter | Needs the serial-device deployment profile; the standard profile does not attach host serial devices |
| BACnet/IP | Read and write on air handlers | Writes use a priority and release with Null. COV subscription, BBMD registration and MS-TP are not implemented |
Performance and measured data
Everything here was measured against the protocol simulator over loopback; there is no building site data, and each figure comes from a single run unless stated otherwise.
Capacity
| Metric | Value | Conditions |
|---|---|---|
| Sampling throughput | 349.99 events/s (99.99% of the 350.0 target) | 2,000 points, 4 protocol sources |
| Prediction rate | 0.939 cycle/s | Same run |
| Peak process-group RSS | 217.3 MiB | Same run |
Conditions for all three rows: 2,000 points across 4 protocol sources, OPC UA and Modbus sampled every 5 s, BACnet every 10 s, loopback only, 180 s run, on a reComputer R2000 series (arm64).
Reproduce: upstream b5fe4cc, capture capacity-smoke r14
Latency
| Metric | Value | Conditions |
|---|---|---|
| Prediction cycle latency | 46.27 ms max | n = 4 cycles, no load |
| Control admission latency | 1.41 ms max | n = 2 cycles, no load |
Both reflect only the cost of the code path itself.
Reproduce: upstream f831bae, runtime baseline of northbound-smoke
Runtime and key parameters
The prediction model is KNN, trained on the building's own operating history (CSV or Excel with timestamp, setpoint, measured temperature and power columns); the service is a Docker workload on x86-64 or arm64. Each prediction can be reviewed in the console before it goes to the controller.
- Control mode and safety limits: control mode ships as
observe, so no point is written until an operator changes it. The setpoint minimum / maximum of 18 / 30 °C, the maximum change of 1.0 °C per 300 s and the mode whitelist off / fan / cool / heat / auto are all placeholders; fill them in for the plant. - Write-back verification is off by default: the prediction-run config (created in the console) must state
"rollback": { "enabled": true, "settle_seconds": 2.5 }explicitly; a config without arollbacksection is treated asenabled: false. settle_seconds(0–30, default 1.0) must be longer than the source's sampling interval, or the readback sees the pre-write value and reports a mismatch that does not exist.
Known degradation
- The prediction rate has a structural ceiling (not fixed): the prediction loop sleeps a fixed interval after each cycle, so its rate is
1/(1.0 + t_cycle). At 2,000 pointst_cycleis about 0.119 s, which puts the ceiling near 0.894 cycle/s, below the 0.90 gate the soak test requires. - Only Modbus writes are verified by readback: a BACnet output has no write priority available and is skipped.
- Byte order: until checked against the meter's own display, meter points are decoded with the vendor-default (big-endian) word order and may be wrong.
Next steps
- Read/write with independent readback against real OPC UA, Modbus TCP, Modbus RTU (USB-to-RS-485) and BACnet/IP devices on a reComputer R10 series or reTerminal DM.
- A 72-hour unattended run on the same target hosts, with network, broker, process and device recovery drills during the run.
Data and asset sources
- SDM630 register map — Eastron's published Modbus protocol document (Modbus V2 register map, IEEE-754 float32 input registers). Addresses follow that document; the big-endian byte and word order is the vendor default.
- Historical operation data — supplied by the deploying site. Nothing is distributed with the package, and no public dataset is used or required.
- Console captures — original screen captures of the packaged software running against the package's own protocol simulators. The simulator configuration, capture host and checksums are recorded in the package's
gallery/ATTRIBUTION.md. No third-party asset, brand mark or stock image is included. - Architecture diagram — drawn from a structured architecture IR; original work, no third-party art.