Build Your Own Weather Dashboard Using Grafana

Introduction
We here will introduce you how to make your own weather dashboard on your reTerminal using Grafana, which is given credit to Michaelm Klementsk.
InflexDB is an open-source time-series database (TSDB) developed by the company InfluxData. It is written in the Go programming language for storage and retrieval of time series data in fields such as operations monitoring, application metrics, Internet of Things sensor data, and real-time analytics. It also has support for processing data from Graphite.
Grafana is a multi-platform open source analytics and interactive visualization web application. It provides charts, graphs, and alerts for the web when connected to supported data sources. A licensed Grafana Enterprise version with additional capabilities is also available as a self-hosted installation or an account on the Grafana Labs cloud service. It is expandable through a plug-in system. End users can create complex monitoring dashboards using interactive query builders. Grafana is divided into a front end and back end, written in TypeScript and Go, respectively.
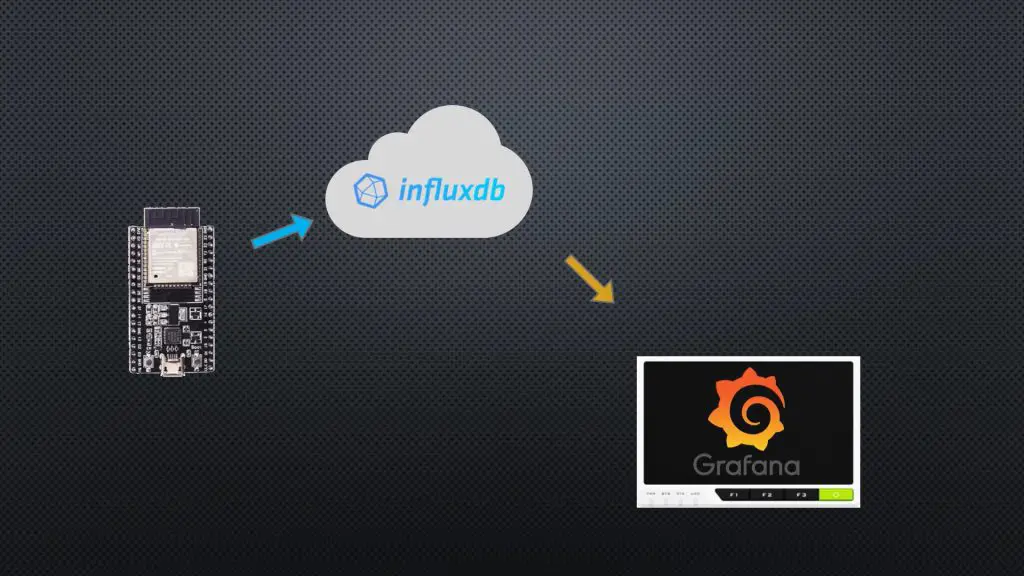
We are going to use an ESP32 to collect temperature, humidity and pressure readings. These will then be posted to a time-series database in InfluxDB. InfluxDB can be run locally on a Raspberry Pi or on their cloud server, we’re going to be using their cloud server. We’re then going to be using an analytics and visualisation application called Grafana to display the information that has been stored in the database. Grafana can also be run locally on our Raspberry Pi (or reTerminal in this case) or on their cloud server. We’re going to be installing and running it locally on our reTerminal. You don’t need to use a separate Pi for InfluxDB and Grafana, you could run both locally on your reTerminal if you’d like to – I just don’t want to have to leave the reTerminal running all the time in order to collect the data.
Materials Required
- reTerminal
- Power Supply
- ESP32
- Grove Sensor’s From Beginner Kit
- Breadboard
- Breadboard Jumpers
Azure and InflexDB Setup
We need to create a virtual machine first.
- Step 1. Open the following page and log in to your Microsoft Azure services. Click the
Virtual machinesand clickCreate.

- Step 2. Select Ubuntu 18.04 system as default system in the virtual machine. Click
Review + createand go to the next page.

- Step 3. All the configurations are selected, click
Create.

The progess will take a while, when it is complete, click the Go to resource button.

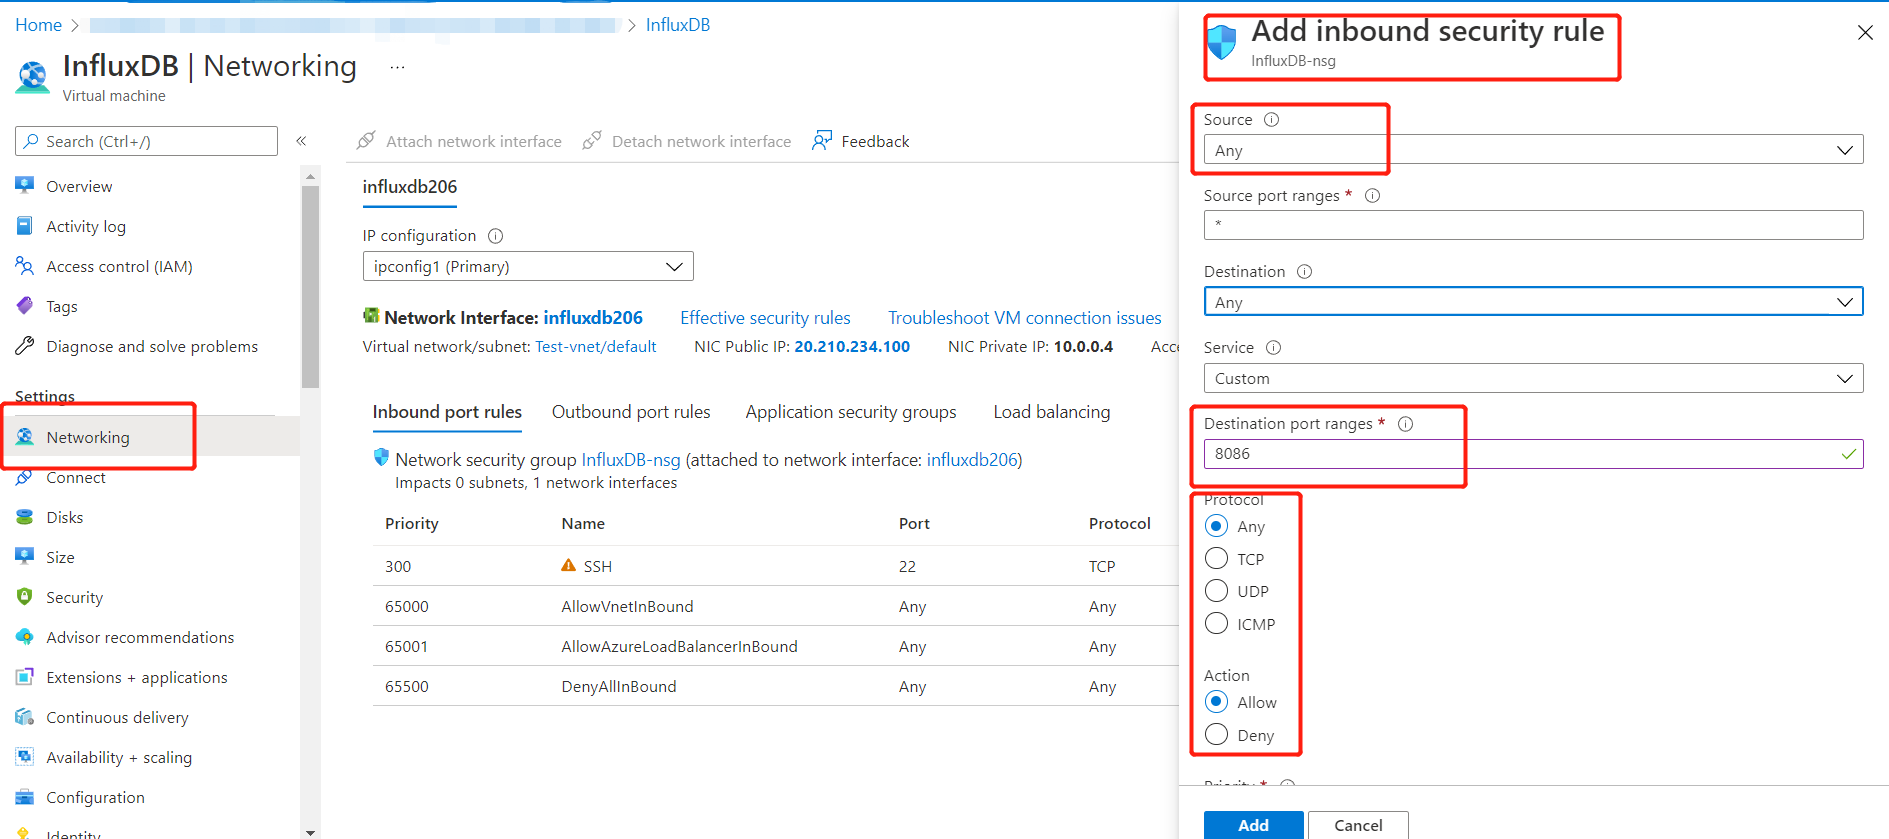
Then it will move to the below page. Click the Networking, choose Add inbound port rule and add 8086 port with any destination.
- Step 4. Copy these commands to install the docker and enable it.
sudo apt udpate
sudo apt install docker docker-compose -y
sudo systemctl enable --now docker && sudo systemctl start docker
sudo systemctl status docker

- Step 5. Use the command to pull the InfluxDB image down.
sudo docker pull influxdb:2.1.1

- Step 6. Apply the command to run the InfluxDB background.
sudo docker run -d --name influxdb -p 8086:8086 influxdb:2.1.1

- Step 7. Open your browser and then input
http://yourip:8086(Your IP). Click "Get Started" to use it.

- Step 8. Record your
Organization NameandBucket Nameand then click "Continue"

- Step 9. Click
Data > API Tokens

Azure and InflexDB now will be set up, next we will move to the ESP32.
ESP32 Setup
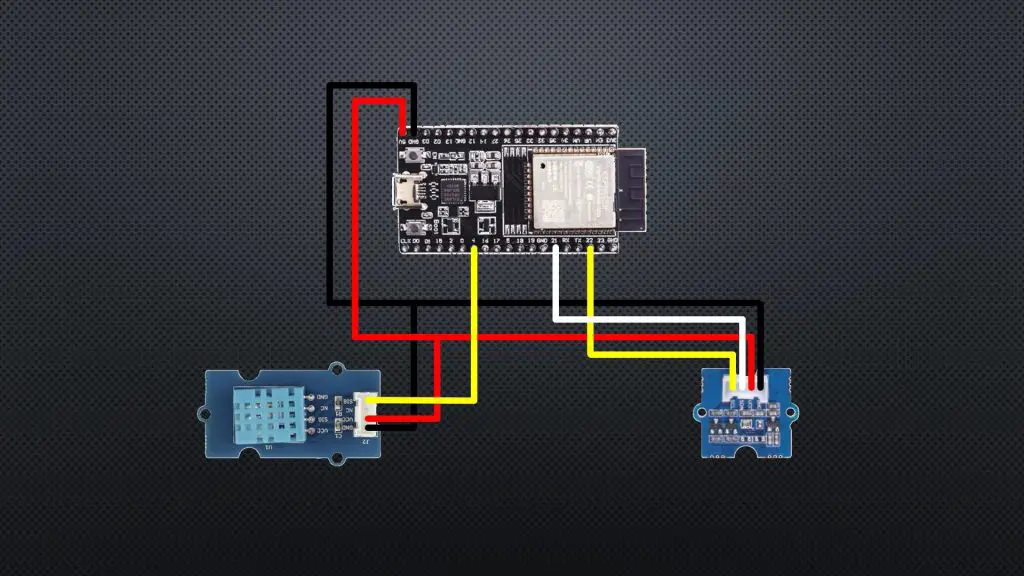
To collect the weather data, we are going to be using an ESP32 with a DHT11 sensor connected to pin 4 and a BMP280 pressure sensor connected to the I2C interface (pins 21 and 22). The example here is using two Grove sensor modules from the beginner kit as it already has all of the required electronics built into them (additional resistors etc.).
- Step 1. Open the Arduino IDE and install the libraries. Here we provide two installations.
- Use Library Manager
1. Open the Arduino IDE and click to the "Sketch" menu and then Include Library > Manage Libraries.
2. Type 'influxdb' in the search box
3. Install the 'InfluxDBClient for Arduino' library
- Manual Installation
1. cd <arduino-sketch-location>/library.
2. git clone https://github.com/tobiasschuerg/InfluxDB-Client-for-Arduino
3. Restart the Arduino IDE
- Step 2. Copy the following codes in the skecth.
#include <Wire.h> //Import the required libraries
#include "DHT.h"
#include "Seeed_BMP280.h"
#include <WiFiMulti.h>
WiFiMulti wifiMulti;
#define DEVICE "ESP32"
#include <InfluxDbClient.h>
#include <InfluxDbCloud.h>
#define WIFI_SSID "xxxxxxxx" //Network Name
#define WIFI_PASSWORD "xxxxxxxxxx" //Network Password
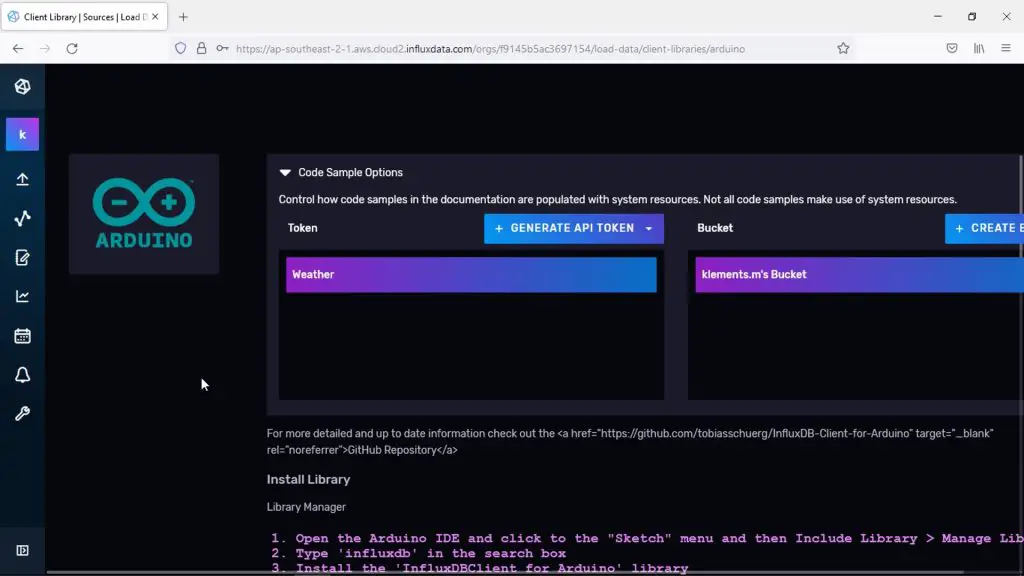
#define INFLUXDB_URL "http://xxxxxxxx:8086" //InfluxDB v2 server url, e.g. https://eu-central-1-1.aws.cloud2.influxdata.com (Use: InfluxDB UI -> Load Data -> Client Libraries)
#define INFLUXDB_TOKEN "xxxxxxxxx" //InfluxDB v2 server or cloud API token (Use: InfluxDB UI -> Data -> API Tokens -> <select token>)
#define INFLUXDB_ORG "xxxxxxx" //InfluxDB v2 organization id (Use: InfluxDB UI -> User -> About -> Common Ids )
#define INFLUXDB_BUCKET "xxxxxxx" //InfluxDB v2 bucket name (Use: InfluxDB UI -> Data -> Buckets)
#define TZ_INFO "JST-9" //InfluxDB v2 timezone
DHT dht(4,DHT11); //DHT and BMP sensor parameters
BMP280 bmp280;
int temp = 0; //Variables to store sensor readings
int humid = 0;
int pressure = 0;
//InfluxDBClient client(INFLUXDB_URL, INFLUXDB_ORG, INFLUXDB_BUCKET, INFLUXDB_TOKEN, InfluxDbCloud2CACert); //InfluxDB client instance with preconfigured InfluxCloud certificate
InfluxDBClient client(INFLUXDB_URL, INFLUXDB_ORG, INFLUXDB_BUCKET, INFLUXDB_TOKEN);
Point sensor("weather"); //Data point
void setup()
{
Serial.begin(115200); //Start serial communication
dht.begin(); //Connect to the DHT Sensor
if(!bmp280.init()) //Connect to pressure sensor
Serial.println("bmp280 init error!");
WiFi.mode(WIFI_STA); //Setup wifi connection
wifiMulti.addAP(WIFI_SSID, WIFI_PASSWORD);
Serial.print("Connecting to wifi"); //Connect to WiFi
while (wifiMulti.run() != WL_CONNECTED)
{
Serial.print(".");
delay(100);
}
Serial.println();
sensor.addTag("device", DEVICE); //Add tag(s) - repeat as required
sensor.addTag("SSID", WIFI_SSID);
timeSync(TZ_INFO, "pool.ntp.org", "time.nis.gov"); //Accurate time is necessary for certificate validation and writing in batches
if (client.validateConnection()) //Check server connection
{
Serial.print("Connected to InfluxDB: ");
Serial.println(client.getServerUrl());
}
else
{
Serial.print("InfluxDB connection failed: ");
Serial.println(client.getLastErrorMessage());
}
}
void loop() //Loop function
{
temp = dht.readTemperature(); //Record temperature
humid = dht.readHumidity(); //Record temperature
pressure = bmp280.getPressure()/100; //Record pressure
sensor.clearFields(); //Clear fields for reusing the point. Tags will remain untouched
sensor.addField("temperature", temp); // Store measured value into point
sensor.addField("humidity", humid); // Store measured value into point
sensor.addField("pressure", pressure); // Store measured value into point
if (wifiMulti.run() != WL_CONNECTED) //Check WiFi connection and reconnect if needed
Serial.println("Wifi connection lost");
if (!client.writePoint(sensor)) //Write data point
{
Serial.print("InfluxDB write failed: ");
Serial.println(client.getLastErrorMessage());
}
Serial.print("Temp: "); //Display readings on serial monitor
Serial.println(temp);
Serial.print("Humidity: ");
Serial.println(humid);
Serial.print("Pressure: ");
Serial.println(pressure);
delay(1000); //Wait 60 seconds
}
Note: The codes are not finished. If you set up your API token and bucket, the generated code on the Arduino interface page accessed from your InfluxDB dashboard will already contain the correct setup information, so you only need to copy it into your code.
- Step 3. Upload the codes and check the results.

After a while, we can see that the information is now available in our InfluxDB database, so we know that our ESP32 is working correctly. Now we can move on to installing Grafana on our reTerminal and setting it up to display the information in our database.
Install and Set Up Grafana On The reTerminal
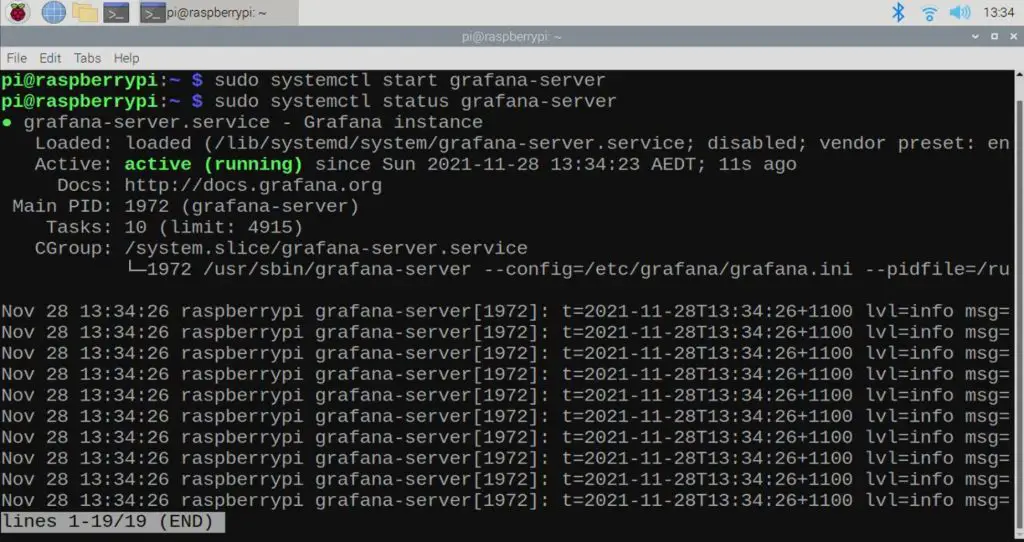
Next, we are going to install Grafan by following the terminal instructions outlined on their website for an installation on Debian or Ubuntu. Then we just need to start Grafana and set it to re-start on bootup.
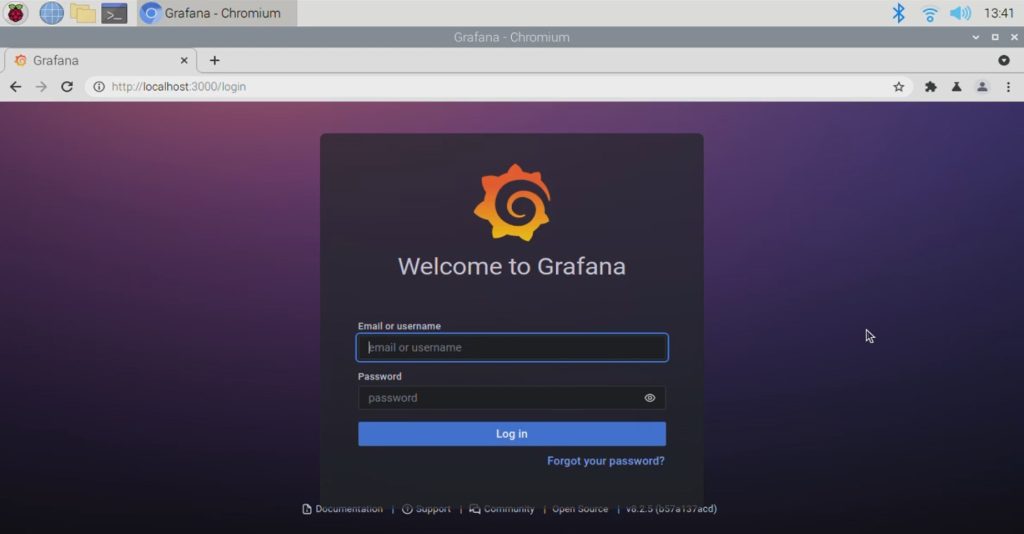
- Step 1. Access the Grafana web interface by opening up a new tab in the browser, pointing to localhost, port 3000. You can open your browser on your reTerminal and type
http://localhost:3000
We then need to configure it to read in the data from InfluxDB by entering the sever and authentication information. This can all be found through your InfluxDB web interface and is quite similar to the information your ESP32 is publishing data to.
- Step 2. Click the
Settingbutton and chooseData sources.

- Step 3. Type the
InfluxDBin the filter and chooseInfluxDB.

Now we have installed and set Up Grafana On The reTerminal
Configure Grafana to use Flux
With Flux selected as the query language in your InfluxDB data source, we will configure the InfluxDB connection:
-
Step 1. Set the Connection and click Save & Test. The information respectively are:
-
URL: Your InfluxDB URL.
http://yourip:8086/ -
Organization: Your InfluxDB organization name or ID.
-
Token: Your InfluxDB API token.
-
Default Bucket: The default bucket to use in Flux queries.
-
Min time interval: The Grafana minimum time interval.
-

Grafana should connect to the InfluxDB 2.0 datasource and returns the results of the test.
- Step 2. Add panel here.

- Step 3. Back to the
InfluxDB, follow the instrucions below and then create script.

- Step 4. Copy the scripts and paste them into the reTerminal.


- Step 5. Check the results on the reTerminal and the information should be shown as below.
