UART Monitor
Introduction
Welcome to the documentation for the XIAO Debug Mate UART Monitor.
This page provides clear guidance on how to use the Debug Mate for serial data monitoring. You will find step-by-step instructions for hardware setup, recommended software tools, and explanations of relevant concepts to help you make the most of the UART monitoring features in development and debugging scenarios.
Concepts to Understand Before Using the Serial Monitor
Before diving in, let's clarify two fundamental concepts that are essential for working with serial communication.
Serial Communication
Serial communication is a method of sending data one bit at a time, sequentially, over a single communication channel. Think of it like cars traveling down a single-lane road one after another. In the world of microcontrollers, this is most commonly implemented using a protocol called UART (Universal Asynchronous Receiver-Transmitter). It's the primary way developers get debug messages, sensor readings, and status updates from their devices.
RX/TX
These are the two pins that make serial communication happen:
- TX (Transmit): This is the "sending" pin. The microcontroller uses this pin to send data out.
- RX (Receive): This is the "receiving" pin. The microcontroller uses this pin to listen for incoming data.
UART Communication Logic
The most important rule to remember is that you must cross-connect these pins between devices. The TX pin of one device must connect to the RX pin of the other, and vice-versa. It's like a conversation: one person's mouth (TX) talks to the other person's ear (RX).
Getting Started
The XIAO Debug Mate can monitor serial data in two ways: directly on its built-in LCD screen or by passing the data through to a computer. This guide covers both.
Software Preparation (for PC Monitoring)
If you choose to view the serial data on your computer, you will need a "serial terminal" or "serial monitor" application. The XIAO Debug Mate will appear as a standard COM port on your PC. Here are some popular software choices:
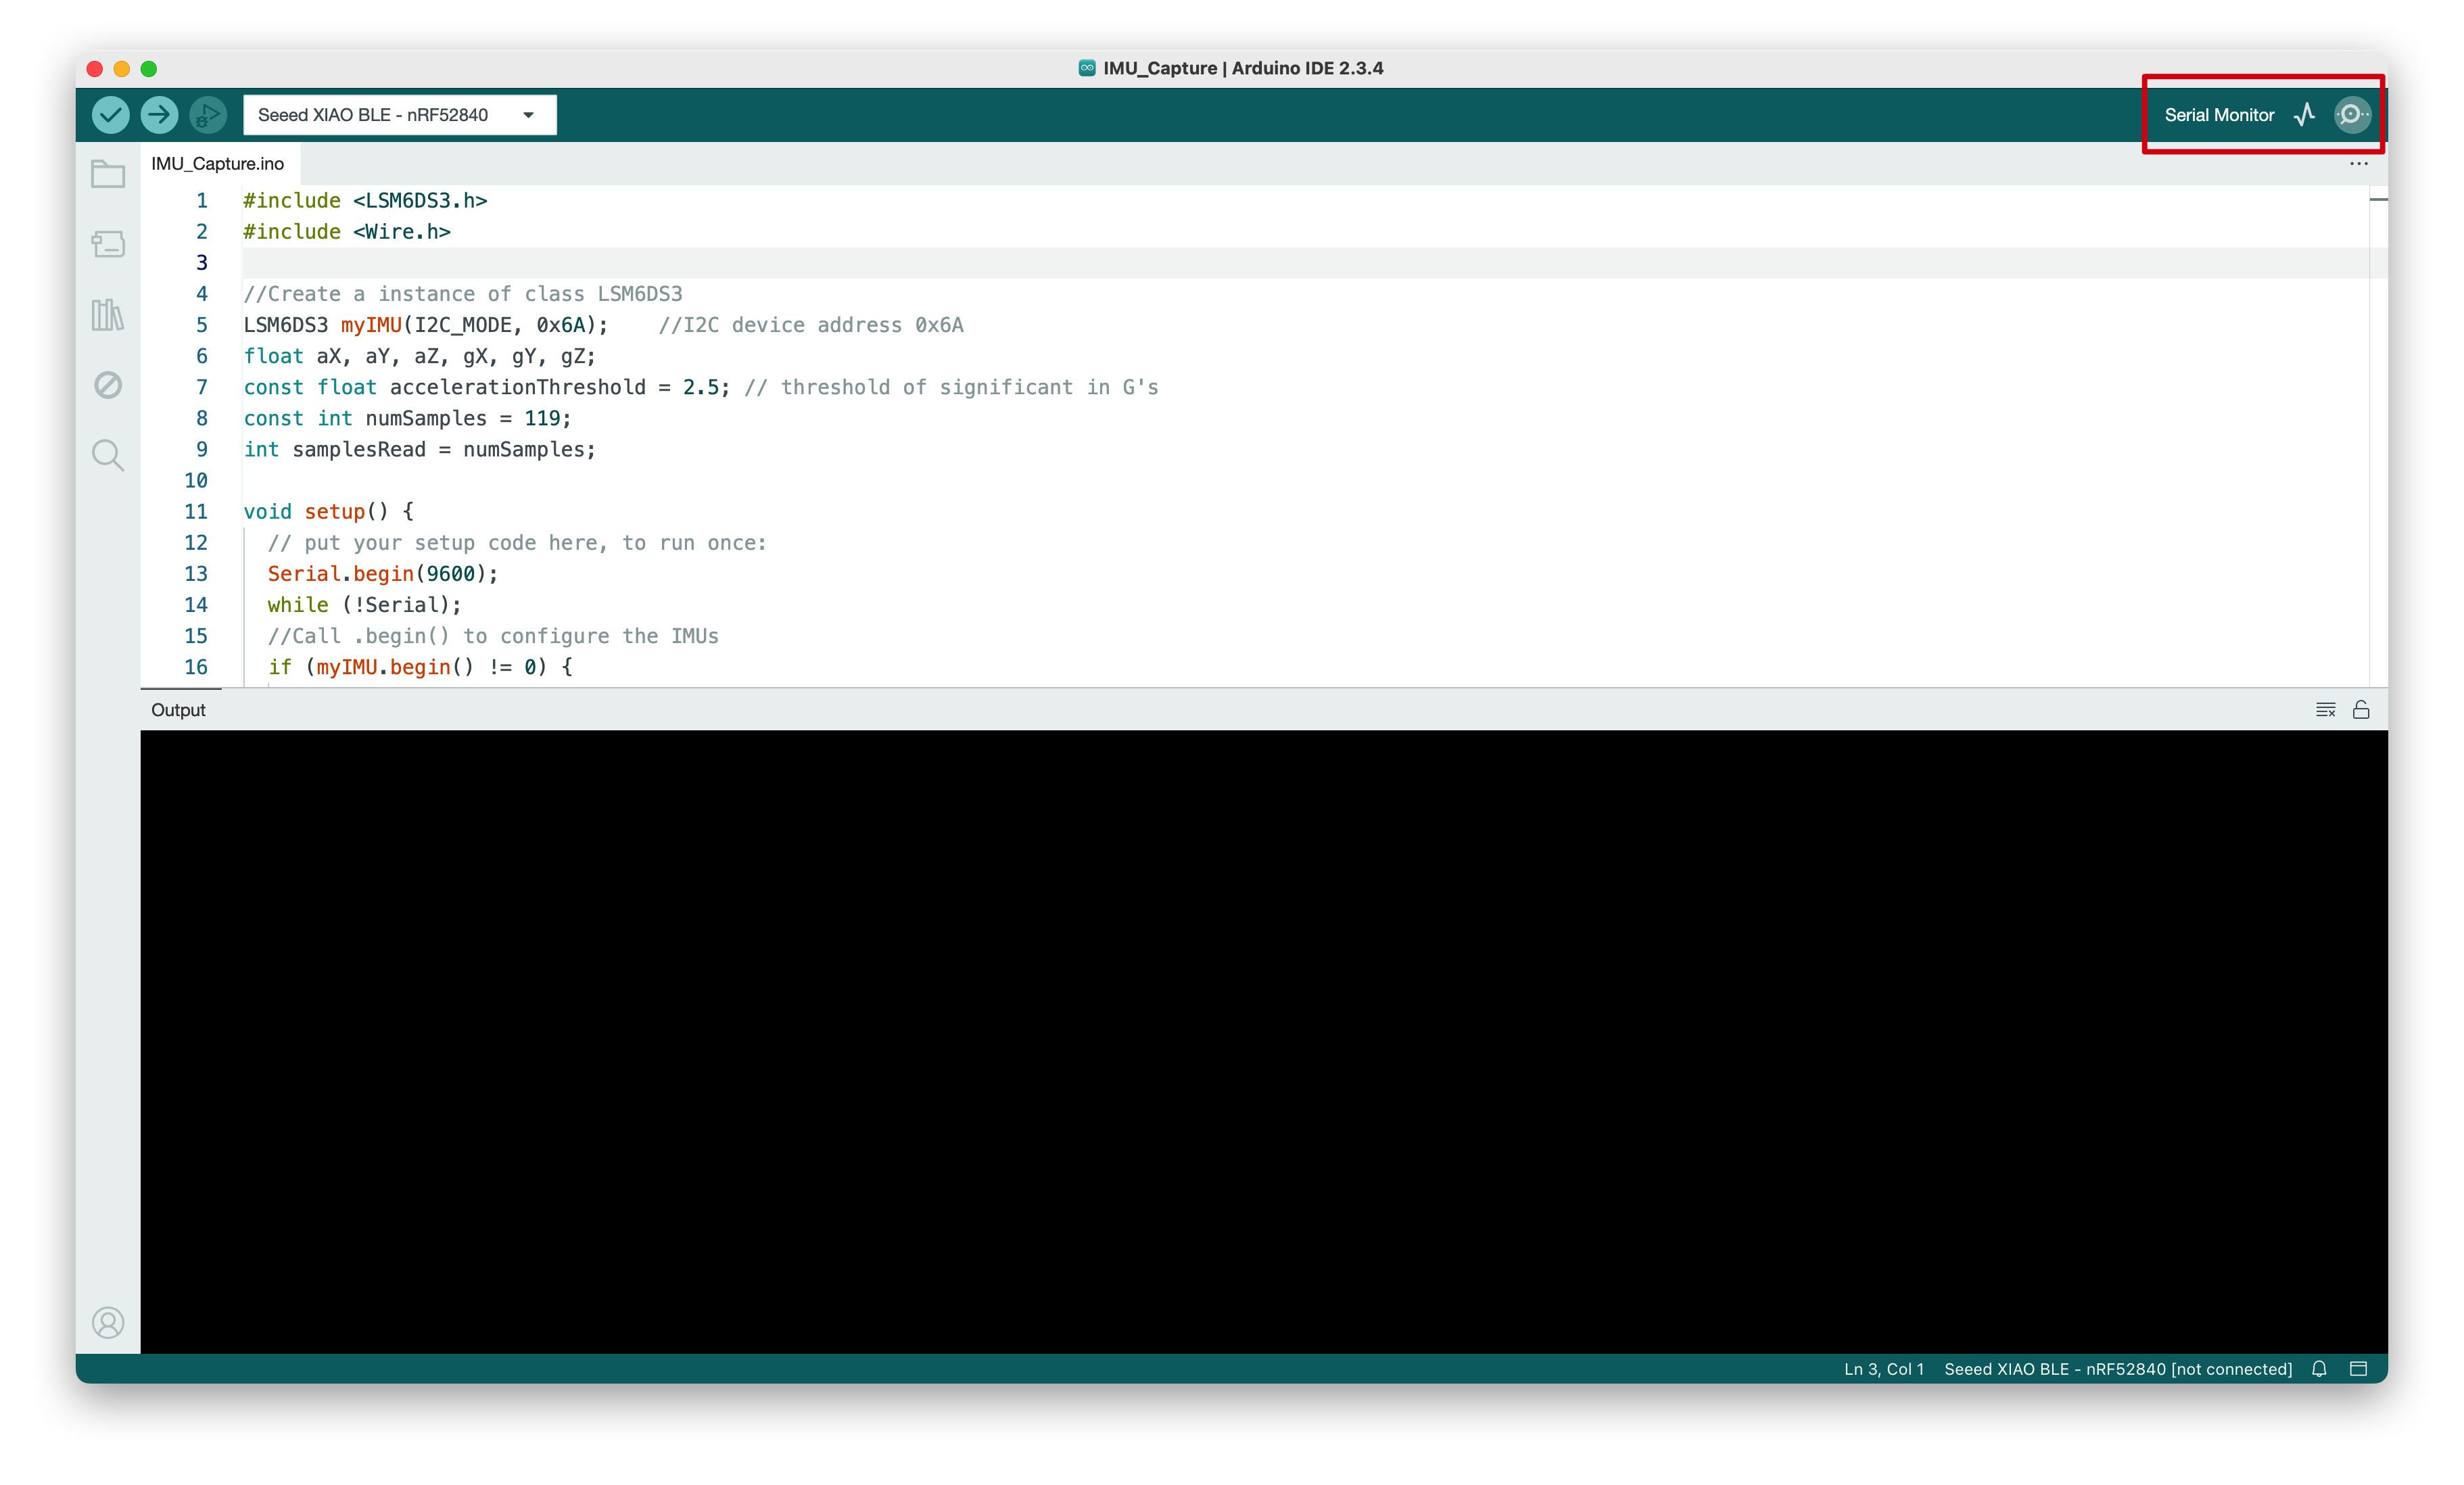
- PlatformIO Serial Monitor: If you are using VS Code with PlatformIO, you can simply click the "Serial Monitor" button in the status bar.
- Arduino IDE Serial Monitor: The classic and simple monitor built into the Arduino IDE.
- PuTTY: A lightweight and highly popular terminal emulator for Windows.
- CoolTerm: A user-friendly and feature-rich serial terminal for Windows, macOS, and Linux.
- minicom / screen: Powerful command-line based tools for Linux and macOS users.
Hardware Preparation
The XIAO Debug Mate offers three flexible ways to connect your target device for serial monitoring.
For XIAO Boards (Plug-and-Play)
This is the easiest method for monitoring a XIAO board. The Debug Mate is designed to listen to the XIAO's Serial1 port (D6 and D7) by default.
- Simply plug your XIAO board directly into the female headers on the front of the XIAO Debug Mate.
- The connection is made automatically. No extra wires are needed.
For UART Grove Devices
The dedicated Grove connector allows for a clean and secure connection to any UART-based Grove module.
- Take your Grove UART device (e.g., a Grove GPS or Grove MP3 V4).
- Use a standard Grove cable to connect it to the Grove port on the right side of the XIAO Debug Mate.
For Other UART Devices
Whether you need to connect the 3.3V power pins of the two development boards depends on whether your other device is powered by the Debug Mate. If the other device is powered via its own independent USB connection, you should not connect the 3.3V pins of the device and the Debug Mate. Doing so may damage the device.
You can monitor any device with accessible TX and RX pins, such as another development board or a custom circuit.
There are two primary ways to do this:
-
Option 1: Using the Main Headers: Connect your device's TX and RX pins to the XIAO Debug Mate's female headers using DuPont wires. Remember to cross-connect: Device TX -> Debug Mate RX (Pin D7 on the header) and Device RX -> Debug Mate TX (Pin D6 on the header).
-
Option 2: Using the Grove Port: Use a Grove to DuPont conversion cable. Plug the Grove connector into the Debug Mate and connect the individual DuPont ends to your device's TX, RX, VCC, and GND pins. This is often a more stable and reliable connection.

The following diagram shows the pin definitions for the Grove interface.
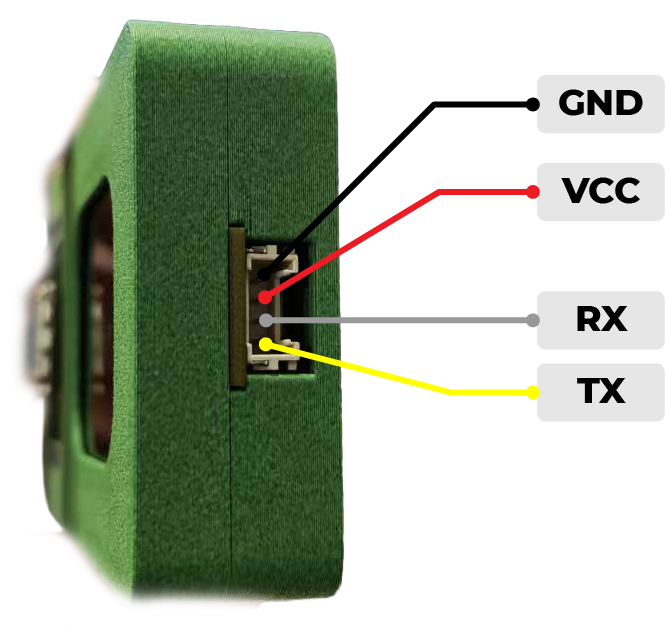
Always ensure your device's TX pin is connected to a receiving pin on the Debug Mate, and the device's RX pin is connected to a transmitting pin.
Thanks to its versatile design, the XIAO Debug Mate allows you to connect up to two UART devices simultaneously: one via the XIAO socket and another via the Grove port. You can then switch between monitoring each device using the on-screen menu.
This powerful feature eliminates the painful process of repeatedly rewiring when debugging complex systems involving multiple serial devices.
Operating the Serial Monitor
The XIAO Debug Mate features a versatile serial tool that can be used for both on-device and PC-based monitoring. This guide will walk you through its navigation and functions.
Basic Navigation and Controls
Before exploring the features, it's crucial to understand how to navigate the interface. All operations are performed using the scroll wheel and the button.
-
Entering the Menu: From the main screen, use the scroll wheel to highlight the Serial Tool icon (bottom-left). Press the button to enter the serial menu.
-
Core Controls:
- Scroll Wheel: Used to move a cursor or switch between primary modes.
- Short Press Button: Used to confirm a selection or activate the settings cursor.
- Long Press Button: Used to exit a menu or go back.
There are two main interaction states:
- No Cursor Active: In this state, turning the scroll wheel switches between the main functions (e.g., Passthrough Mode vs. Monitor Mode).
- Cursor Active: After a short press, a cursor appears at the top of the screen. Now, the scroll wheel moves this cursor, allowing you to select a setting to change.
Quick Navigation Guide
| Action | Function |
|---|---|
| Scroll Wheel (no cursor) | Switch between Passthrough and Monitor modes. |
| Short Press Button | Activate the selection cursor for Source/Baud Rate. |
| Long Press Button | Return to the previous menu. |
The Two Monitoring Modes
With the basic controls understood, you can now easily switch between the two primary operating modes. Simply turn the scroll wheel (while no cursor is active) to toggle between them.
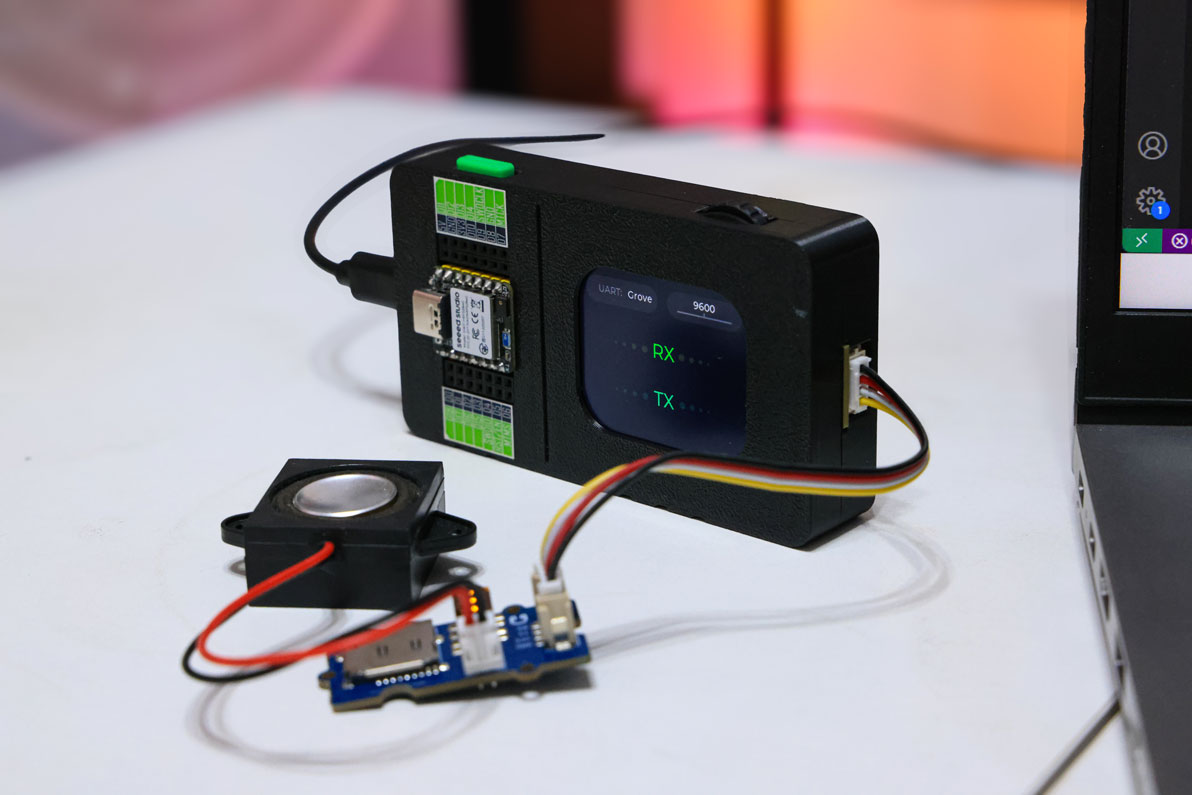
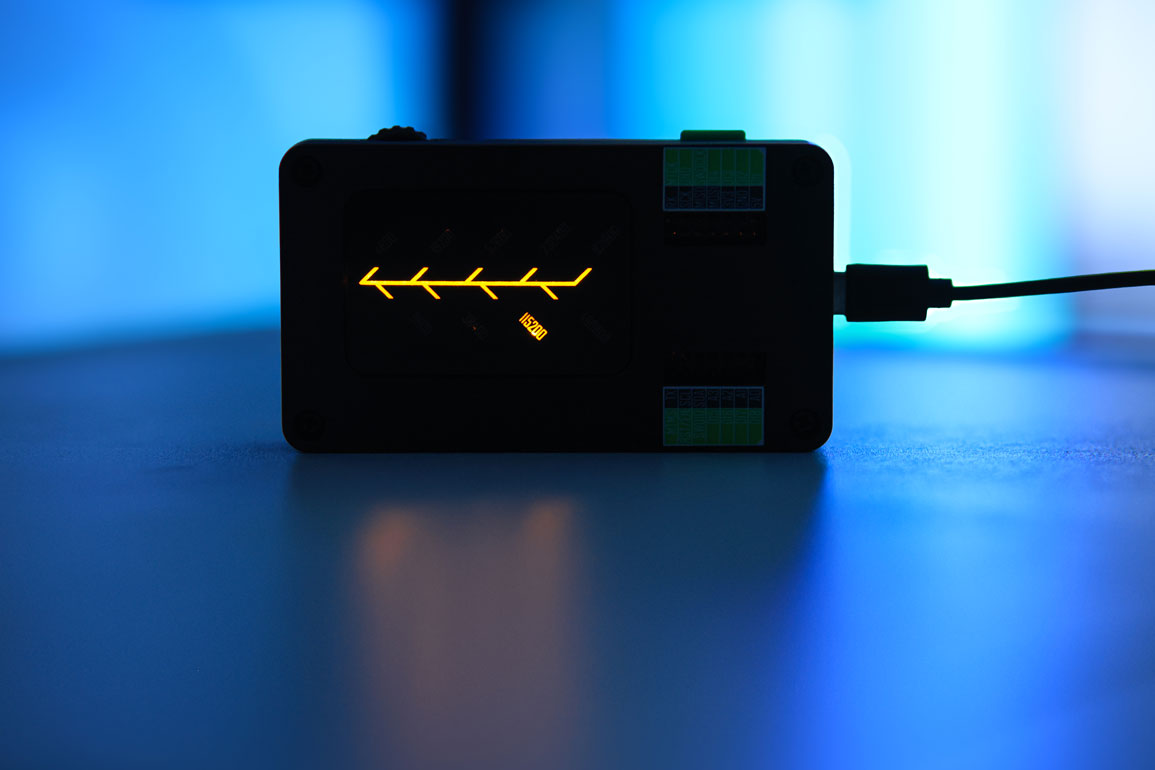
1. Passthrough Mode (to PC)
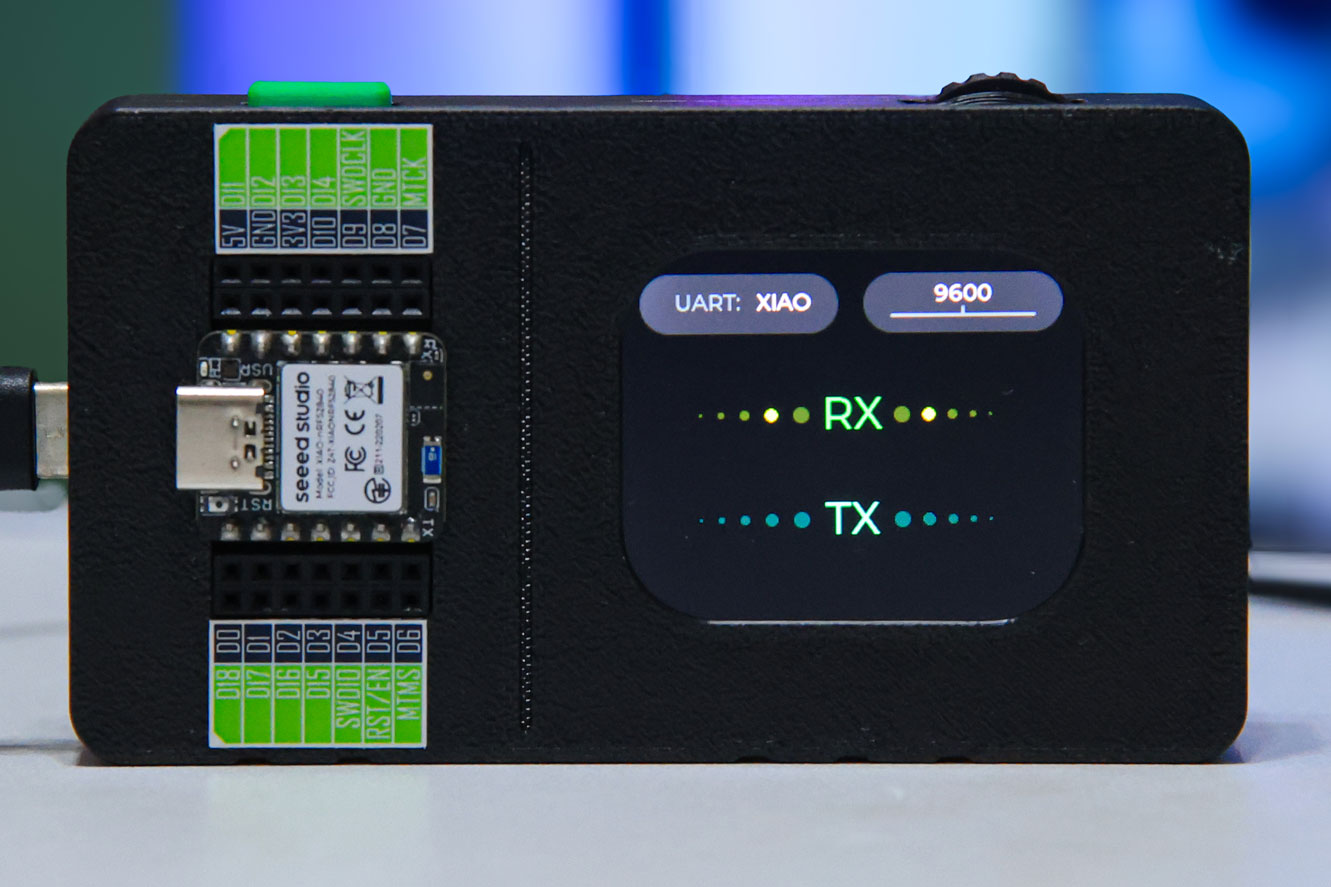
This is the default mode, designed to forward all serial data from the selected source directly to your computer for viewing in a PC-based serial terminal.
- On-Screen Display: The screen shows status information, not the data itself.
- Top-Left: The active serial source (e.g.,
XIAO). - Top-Right: The current baud rate (e.g.,
9600). - Center:
RXandTXindicators (from the Debug Mate's perspective) will animate to show data flow to and from the PC.
- Top-Left: The active serial source (e.g.,
2. Monitor Mode (on LCD)
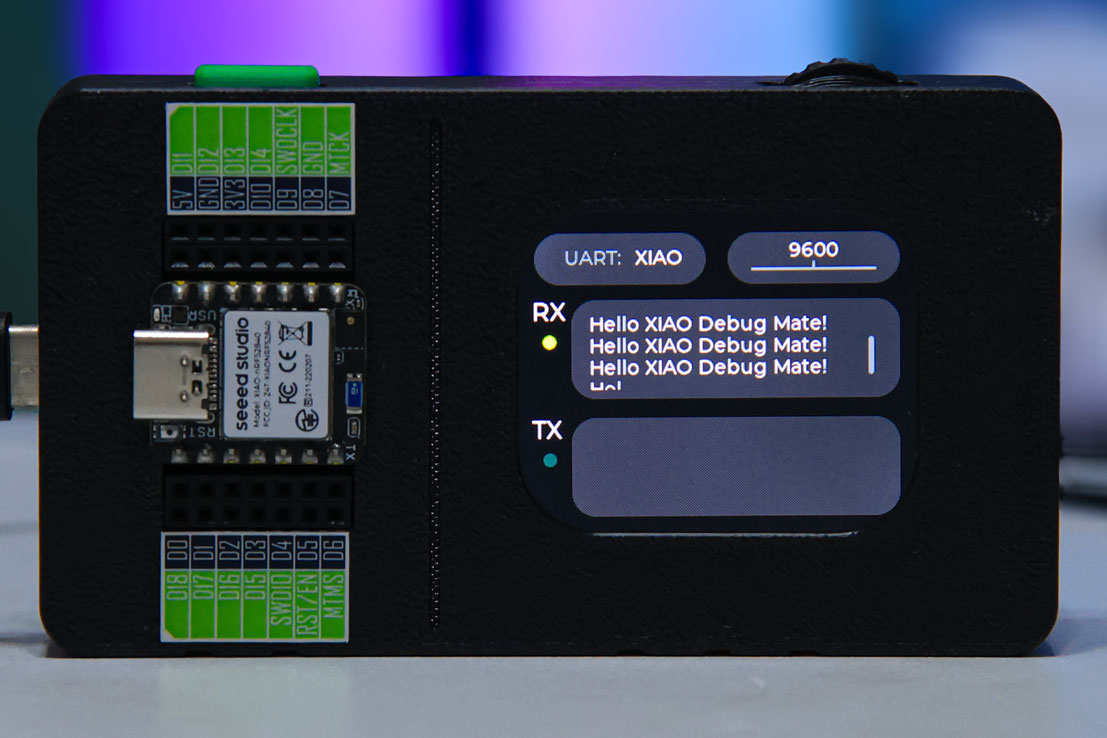
This mode captures and displays serial data directly on the Debug Mate's LCD screen. Data is not forwarded to the PC in this mode.
- On-Screen Display: The screen is divided into two windows to display the data traffic.
RX Window: Shows data received from the XIAO/Grove socket.TX Window: Shows data received from the PC.
The Debug Mate cannot display data from both sources simultaneously. You must select the active source using the settings menu.
The labels RX and TX in this document are always from the Debug Mate's perspective:
- RX indicates data received by the Debug Mate (i.e., serial signals coming into the Debug Mate).
- TX indicates data sent out by the Debug Mate (i.e., signals being transmitted by the Debug Mate).
This means that data sent from the XIAO or Grove device to the Debug Mate will appear in the RX window, no matter which port is selected as the source. The content shown in the RX window depends on which source (XIAO/Grove) you have chosen in the settings.
TX always refers to data originating from the PC — when you type and send messages from a serial terminal on your computer, they are transmitted via the Debug Mate's TX to the currently selected source (XIAO or Grove).
- In both "Passthrough" and "Monitor" modes, the PC can send data to the Debug Mate via its virtual COM port, and the Debug Mate will pass these messages to the target serial device you selected.
- What you see in the TX window is thus always what the PC is sending through the Debug Mate, regardless of current monitoring mode.
Configuring Source and Baud Rate
To change the data source or baud rate, you must first activate the settings cursor.
- Activate Cursor: From either mode, press the button once. A cursor will appear at the top of the screen.

- Select Setting: Use the button to move the cursor between the source (
XIAO/Grove) and the baud rate.

After switching sources, content from the new source may not appear immediately. This is because the printer must wait for the previous input source's data to finish printing before receiving information from the ne
- Enter Menu: For the baud rate option, with the desired setting highlighted, press the button to open its configuration menu.
- Change Value: Use the scroll wheel to choose your baud rate, and press the button to confirm.
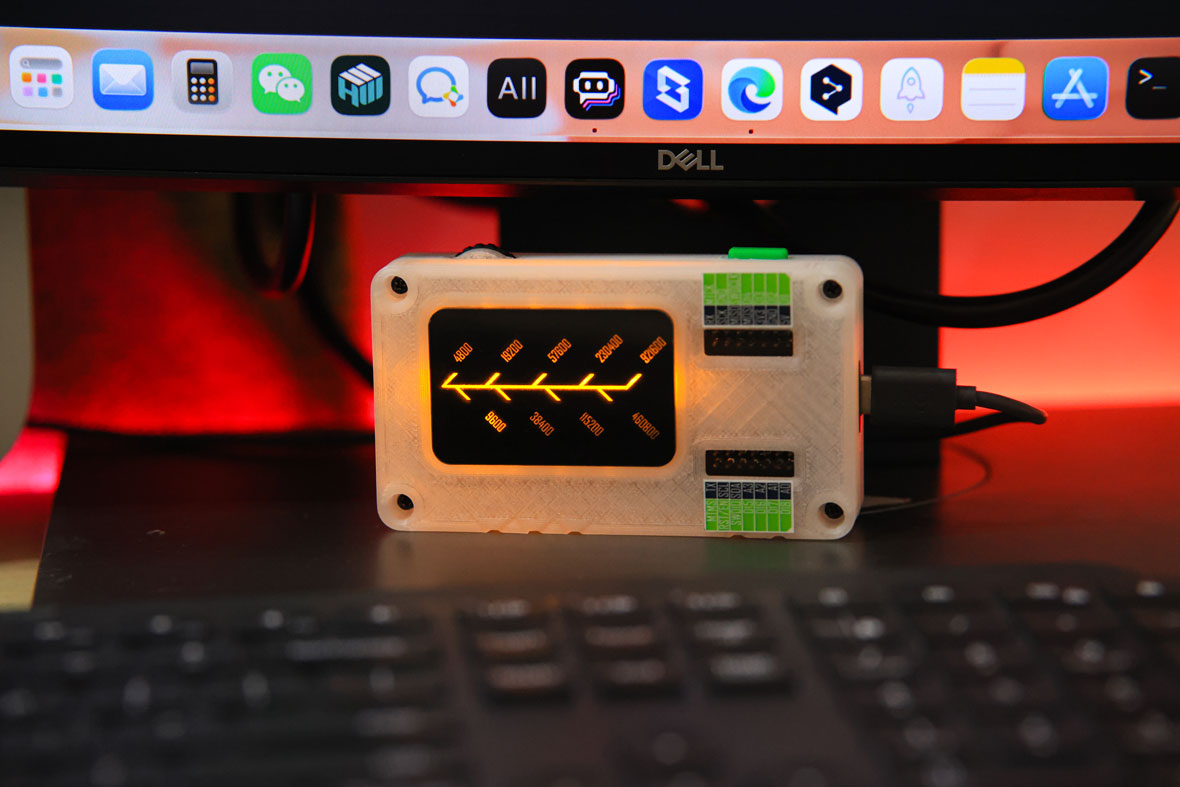
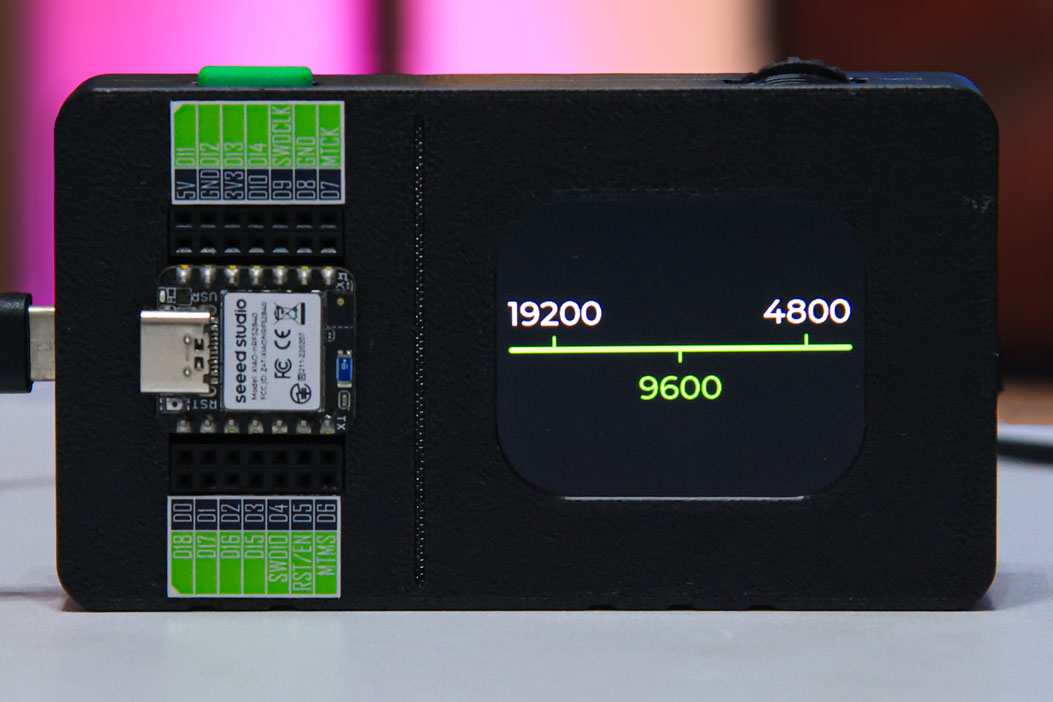
The Baud Rate Menu & Visual Indicator
The baud rate menu allows you to select from nine common rates (4800 to 921600). As a unique visual flourish, entering this menu also activates the 36-LED matrix on the back of the device, with the light pattern changing to reflect the selected rate.
Key Concepts and Limitations
- A Debugger, Not a Bridge: The Debug Mate is a diagnostic tool, not a communication bridge. It will not automatically forward data from the XIAO port to the Grove port.
- Fixed Serial Parameters: Core serial parameters (8-N-1) are fixed in the firmware. Advanced users can modify the open-source code to change them.
- Single-Source Monitoring: You can only actively monitor one source (XIAO or Grove) at a time.
Special Thanks
Special thanks to 啊猫啊狗晒太阳 (Ah Mao Ah Gou Shai Tai Yang) for the design inspiration for the LED matrix. The design of the Debug Mate's onboard LED indicator is a reference to their excellent open-source project. The original design is very creative and practical.
If you would like to see the original design, you can check out the demonstration video and the author's homepage through the links below.