Line Charts
This repo describes how to draw line graphs on Wio Terminal. You can use this to display raw sensor values to visualize readings on screen just like the serial plotter! The library is very flexible and can alter to your own need.
Libraries Installation
Installing the Seeed_Arduino_Linechart Library For 2D Graphic For Wio Terminal
Visit Seeed_Arduino_Linechart and download the entire repo to your local drive.
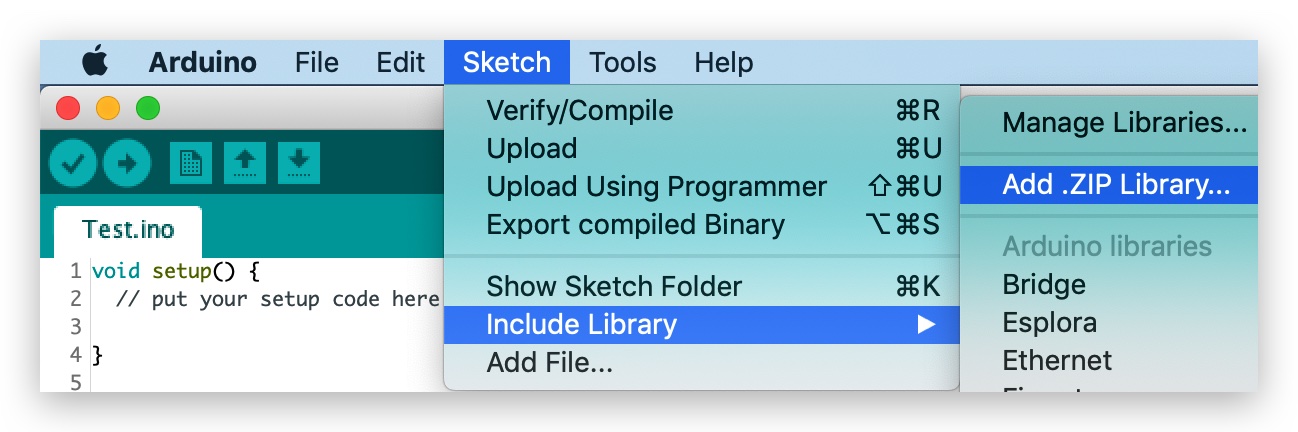
Now, the Wio Terminal_graphics library can be installed to the Arduino IDE. Open the Arduino IDE, and click
sketch->Include Library->Add .ZIP Library, and choose theSeeed_Arduino_Linechartfile that you've have just downloaded.
Getting Started
To initialize for drawing Line graph
At first, defining the maximum number of variables to be stored, and a doubles type to store data, as well as creating a buffer using the TFT Sprite function.
#define max_size 50 //maximum size of data
doubles data; //Initilising a doubles type to store data
TFT_eSprite spr = TFT_eSprite(&tft);  // Sprite
To initialize the LCD Screen
void setup() {
    tft.begin();
    tft.setRotation(3);
    spr.createSprite(TFT_HEIGHT,TFT_WIDTH);
}
Loading variables to data
Use data.push(variable) to store variables (i.e. sensor readings) in data, and if it reached the pre-defined maximum number it removes the first variable (keep on going).
    spr.fillSprite(TFT_WHITE);
    if (data.size() == max_size) {
        data.pop(); //this is used to remove the first read variable
    }
    data.push(0.01 * random(1, 10)); //read variables and store in data
To initialize settings for the Line Graph Title
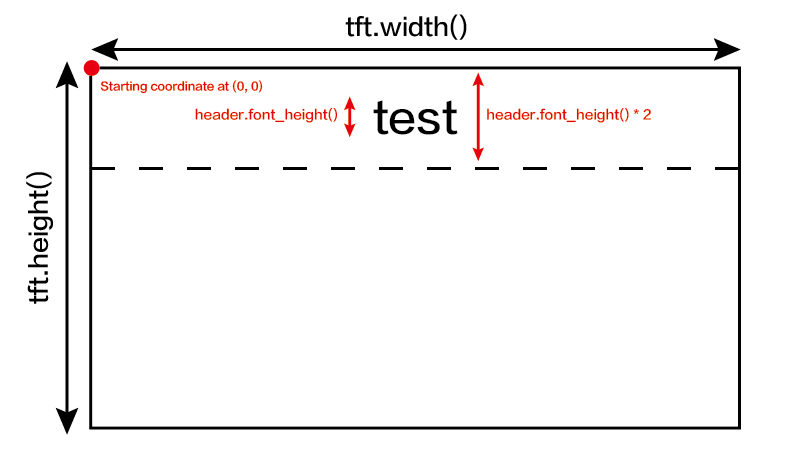
Some settings to configure the desired display of the title for line graph. Initialize a text(x, y) struct, where (x, y) is the starting coordinates of the title. And configure settings as below. In this example, header is the name of this struct and can change settings and configure like header.value("test") and etc.
    //Settings for the line graph title
    auto header =   text(0, 0)           //starting coordinates of title
                .value("test")      //actual title of the line graph
                .align(center)      //horizontal alignment of title
                .valign(vcenter)    //vertical alignment of title
                .width(tft.width()) //width of the title
                .thickness(3);      //thickness of the font

    header.height(header.font_height() * 2); //the height of title is the twice the height of the font
    header.draw();
To help understanding this example code, please refer the title configurations to the image below:
To initialize settings for the Line Graph and Draw on the LCD Screen
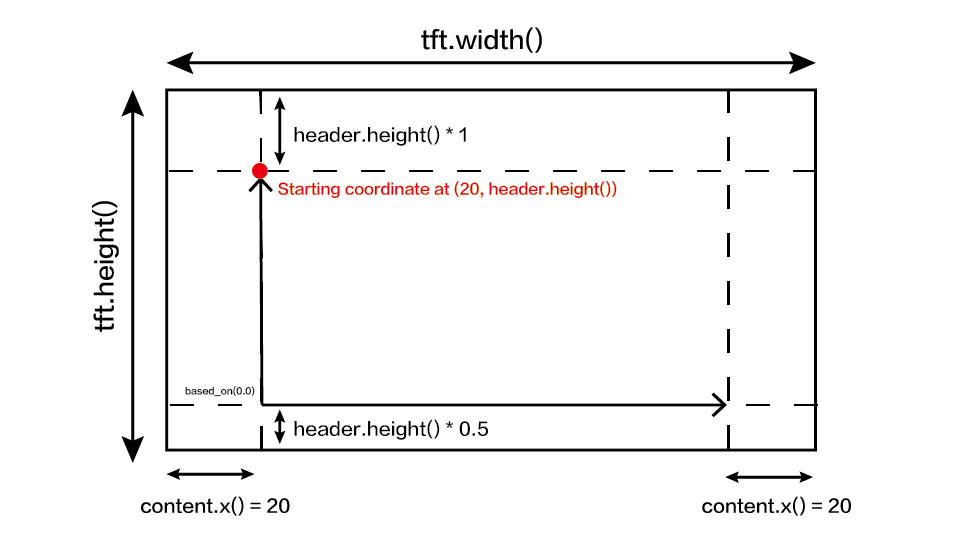
Some settings to configure the desired display of the Line graph. Initialize a line_chart(x, y) struct, where (x, y) is the starting coordinate of the line graph. And configure settings as below. In this example, content is the name of this struct and can change settings and configure like content.based_on(0.0) and etc. Alter these settings for prefer display!
  //Settings for the line graph
    auto content = line_chart(20, header.height()); //(x,y) where the line graph begins
         content
                .height(tft.height() - header.height() * 1.5) //actual height of the line chart
                .width(tft.width() - content.x() * 2) //actual width of the line chart
                .based_on(0.0) //Starting point of y-axis, must be a float
                .show_circle(false) //drawing a cirle at each point, default is on.
                .value(data) //passing through the data to line graph
                .color(TFT_PURPLE) //Setting the color for the line
                .draw();

    spr.pushSprite(0, 0);
    delay(50);
To help understanding this example code, please refer the line graph configurations to the image below:
Complete code
#include"seeed_line_chart.h" //include the library
TFT_eSPI tft;

#define max_size 50 //maximum size of data
doubles data; //Initilising a doubles type to store data
TFT_eSprite spr = TFT_eSprite(&tft);  // Sprite

void setup() {
    tft.begin();
    tft.setRotation(3);
    spr.createSprite(TFT_HEIGHT,TFT_WIDTH);
}

void loop() {
    spr.fillSprite(TFT_WHITE);
    if (data.size() == max_size) {
        data.pop();//this is used to remove the first read variable
    }
    data.push(0.01 * random(1, 10)); //read variables and store in data

    //Settings for the line graph title
    auto header =  text(0, 0)
                .value("test")
                .align(center)
                .valign(vcenter)
                .width(tft.width())
                .thickness(3);

    header.height(header.font_height() * 2);
    header.draw(); //Header height is the twice the height of the font

  //Settings for the line graph
    auto content = line_chart(20, header.height()); //(x,y) where the line graph begins
         content
                .height(tft.height() - header.height() * 1.5) //actual height of the line chart
                .width(tft.width() - content.x() * 2) //actual width of the line chart
                .based_on(0.0) //Starting point of y-axis, must be a float
                .show_circle(false) //drawing a cirle at each point, default is on.
                .value(data) //passing through the data to line graph
                .color(TFT_PURPLE) //Setting the color for the line
                .draw();

    spr.pushSprite(0, 0);
    delay(50);
}
Tech Support & Product Discussion
Thank you for choosing our products! We are here to provide you with different support to ensure that your experience with our products is as smooth as possible. We offer several communication channels to cater to different preferences and needs.