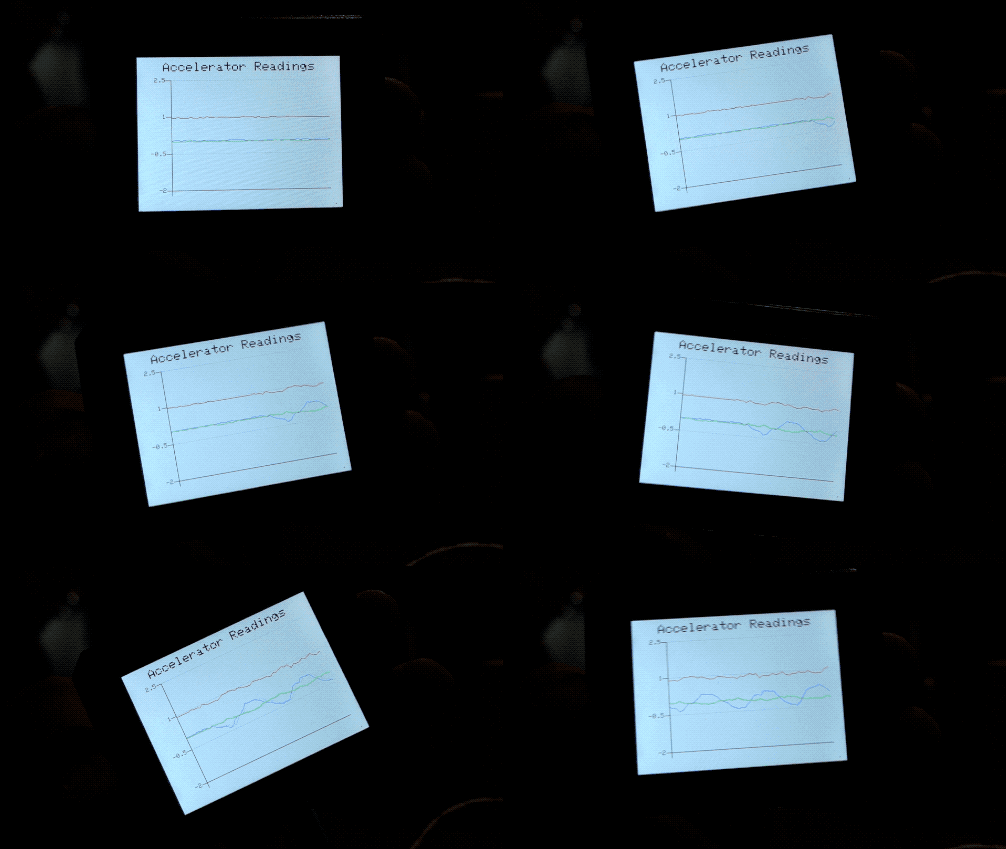
Wio Terminal 加速度センサーの読み取り表示

概要
この例では、Wio Terminal 上で折れ線グラフを描画する方法を示します。この例では、3軸加速度センサーの読み取り値(3セットのデータ)を1つの折れ線グラフにプロットし、Wio Terminal のリアルタイムの位置を表示します!
特徴
-
3軸加速度センサーの読み取り値を1つの折れ線グラフで表示
-
Wio Terminal のリアルタイム位置表示
必要な Arduino ライブラリ
-
Seeed_Arduino_Linechart を訪問し、リポジトリ全体をローカルドライブにダウンロードしてください。
-
オンボード加速度センサーライブラリ
Seeed_Arduino_LIS3DHTRをインストールしてください。詳細は Seeed_Arduino_LIS3DHTR を参照してください。
Arduino 手順
-
AcceratorReadings.inoファイルをダウンロードし、Arduino IDEを使用して Wio Terminal にアップロードしてください。すべてのライブラリがインストールされていることを確認してください。 -
Wio Terminal を異なる軸で動かして表示内容を確認してください。また、
Serial Plotterを開いて効果を確認することもできます!
コード
- LCD と加速度センサーの初期化
#include"LIS3DHTR.h" // 加速度センサーライブラリをインクルード
#include"seeed_line_chart.h" // 折れ線グラフライブラリをインクルード

TFT_eSPI tft;
LIS3DHTR<TwoWire>  lis;

#define MAX_SIZE 50 // データの最大サイズ
doubles accelerator_readings[3];
TFT_eSprite spr = TFT_eSprite(&tft);  // スプライト

void setup() {
    tft.begin();
    tft.setRotation(3);
    spr.createSprite(TFT_HEIGHT,TFT_WIDTH);
    spr.setRotation(3);

    lis.begin(Wire1);
    lis.setOutputDataRate(LIS3DHTR_DATARATE_25HZ);
    lis.setFullScaleRange(LIS3DHTR_RANGE_2G);

    Serial.begin(115200);
}
- 加速度センサーのデータ読み取りとデータのロード
詳細は Line Charts を参照してください。
void loop() {
    spr.fillSprite(TFT_WHITE);
    float x_raw = lis.getAccelerationX();
    float y_raw = lis.getAccelerationY();
    float z_raw = lis.getAccelerationZ();
    ...

    if (accelerator_readings[0].size() == MAX_SIZE) {
      for (uint8_t i = 0; i<3; i++){
        accelerator_readings[i].pop(); // 最初の読み取り変数を削除するために使用
      }
    }

    accelerator_readings[0].push(x_raw); // x軸の読み取り値を保存
    accelerator_readings[1].push(y_raw); // y軸の読み取り値を保存
    accelerator_readings[2].push(z_raw); // z軸の読み取り値を保存
    ...
}
- タイトル設定
詳細は Line Charts を参照してください。
auto header =  text(0, 0)
            .value("Accelerator Readings")
            .align(center)
            .valign(vcenter)
            .width(spr.width())
            .thickness(2);

header.height(header.font_height(&spr) * 2);
header.draw(&spr); // ヘッダーの高さはフォントの高さの2倍
- 折れ線グラフの設定
1つのグラフに複数の線を描画するには、以下のように content.value({doubles[0],doubles[1],doubles[2]...}) として doubles 配列を折れ線グラフに渡します。また、.color() を使用して各線の色を設定できます。色の順序はデータの順序に対応します。
auto content = line_chart(20, header.height()); //(x, y) 折れ線グラフの開始位置
     content
            .height(spr.height() - header.height() * 1.5) // 折れ線グラフの実際の高さ
            .width(spr.width() - content.x() * 2) // 折れ線グラフの実際の幅
            .based_on(-2.0) // y軸の開始点(float型で指定)
            .show_circle(false) // 各ポイントに円を描画(デフォルトはオン)
            .value({accelerator_readings[0],accelerator_readings[1], accelerator_readings[2]}) // 折れ線グラフにデータを渡す
            .max_size(MAX_SIZE)
            .color(TFT_BLUE, TFT_RED, TFT_GREEN)
            .backgroud(TFT_WHITE)
            .draw(&spr);
完全なコード
#include"LIS3DHTR.h" //加速度センサーライブラリをインクルード
#include"seeed_line_chart.h" //ラインチャートライブラリをインクルード

TFT_eSPI tft;
LIS3DHTR<TwoWire>  lis;

#define MAX_SIZE 50 //データの最大サイズ
doubles accelerator_readings[3];
TFT_eSprite spr = TFT_eSprite(&tft);  // スプライト

void setup() {
    tft.begin();
    tft.setRotation(3);
    spr.createSprite(TFT_HEIGHT,TFT_WIDTH);
    spr.setRotation(3);

    lis.begin(Wire1);
    lis.setOutputDataRate(LIS3DHTR_DATARATE_25HZ);
    lis.setFullScaleRange(LIS3DHTR_RANGE_2G);

    Serial.begin(115200);
}

void loop() {
    spr.fillSprite(TFT_WHITE);
    float x_raw = lis.getAccelerationX();
    float y_raw = lis.getAccelerationY();
    float z_raw = lis.getAccelerationZ();

    // これはシリアルプロッタに出力するためのものです。シリアルプロッタを確認してください!
    Serial.print(x_raw);
    Serial.print(",");
    Serial.print(y_raw);
    Serial.print(",");
    Serial.println(z_raw);

    if (accelerator_readings[0].size() == MAX_SIZE) {
      for (uint8_t i = 0; i<3; i++){
        accelerator_readings[i].pop(); //最初の読み取り変数を削除するために使用
      }
    }
    accelerator_readings[0].push(x_raw); //読み取った変数をデータに格納
    accelerator_readings[1].push(y_raw);
    accelerator_readings[2].push(z_raw);

    // ラインチャートのタイトル設定
    auto header =  text(0, 0)
                .value("Accelerator Readings") // タイトル
                .align(center)
                .valign(vcenter)
                .width(spr.width())
                .thickness(2);

    header.height(header.font_height(&spr) * 2);
    header.draw(&spr); // ヘッダーの高さはフォントの高さの2倍

  // ラインチャートの設定
    auto content = line_chart(20, header.height()); //(x,y) ラインチャートの開始位置
         content
                .height(spr.height() - header.height() * 1.5) //ラインチャートの実際の高さ
                .width(spr.width() - content.x() * 2) //ラインチャートの実際の幅
                .based_on(-2.0) //y軸の開始点(floatで指定)
                .show_circle(false) //各ポイントに円を描画するか(デフォルトはオン)
                .value({accelerator_readings[0],accelerator_readings[1], accelerator_readings[2]}) //データをラインチャートに渡す
                .max_size(MAX_SIZE)
                .color(TFT_BLUE, TFT_RED, TFT_GREEN)
                .backgroud(TFT_WHITE)
                .draw(&spr);

    spr.pushSprite(0, 0);
    delay(50);
}