reTerminal DM & Machinechat JEDI: Your Industrial IoT Powerhouse
Introduction
Machinechat JEDI is a powerful and versatile IoT (Internet of Things) data management software. It's designed to streamline the process of collecting, visualizing, monitoring, and responding to real-time data from a wide range of devices, sensors, and machines. Seeed's reTerminal DM and Machinechat JEDI software let you build custom dashboards in under 30 minutes. Track operations, analyze trends, improve efficiency, and receive timely alerts to prevent costly disruptions

Getting Started
Before you start this project, you may need to prepare your hardware and software in advance as described here.
Hardware preparation
| reTerminal DM | XIAO ESP32C3 |
|---|---|
 |  |
Software Preparation
We recommend installing the Bullesye version of Raspberry Pi 64 bit OS from their official website.
Install Machinechat JEDI to reTerminal DM
Download JEDI
Visit the Machinechat website and choose either the JEDI Free Edition or the JEDI Lite Trial Edition.
Enter your email address. You will receive an email with your license information and download links for all supported operating systems. Click the appropriate download link for your operating system.This case 64bit Raspberry pi
Unzip and Launch
The downloaded file is a ZIP archive. Extract the contents to a location of your choice at reTerminal DM.
Open Terminal and execute. Replace this /path/to/jedi/folder with folder location.
cd /path/to/jedi/folder
Launch JEDI
./mcjedi.bin
Accessing JEDI's Web Interface
Open a web browser at reTerminal DM and type
http://localhost:9123
Setup and Activation
Read and Accept the EULA and Fill out the form, providing a username, password, and answers to challenge questions (used for password recovery).
Use your newly created credentials.
Enter the license key provided in your download email. JEDI will briefly connect to the internet to validate and activate your license.
Quick Test
Create A Data Pipeline
Open your favorite Python IDE on your Laptop. (like pycharm/Vs code) copy and paste.
import requests
import json

url = 'http://<jedi_ip>:8100/v1/data/mc'  # Replace <jedi_ip> with your reTerminal DM IP address

payload = {
    "context": {
        "target_id": "my_PC",
        "target_ip": "192.168.1.10"  #PC IP
    },
    "data": {
        "temperature": 25.5,
        "humidity": 68
    }
}

headers = {'Content-Type': 'application/json'}
response = requests.post(url, data=json.dumps(payload), headers=headers)

if response.status_code == 200:
    print('Data sent successfully')
else:
    print('Error sending data:', response.text)
Visualize & Explore
Dashboard Time! On the Navigation Panel click on Data Dashboard. This dashboard was pre-created for you. We will now add a Gauge chart to this dashboard.

- Click ADD CHART to add a new chart to the Data Dashboard.
- Click on Name and enter a name for the chart.
- Click on Chart Type and select Gauge.
- Click on Source and select the target_id that was sent with the data. If you used the sample code or payload provided above, you will see my_PC in the list.
- Click on Property and select a property (e.g. temperature or humidity).
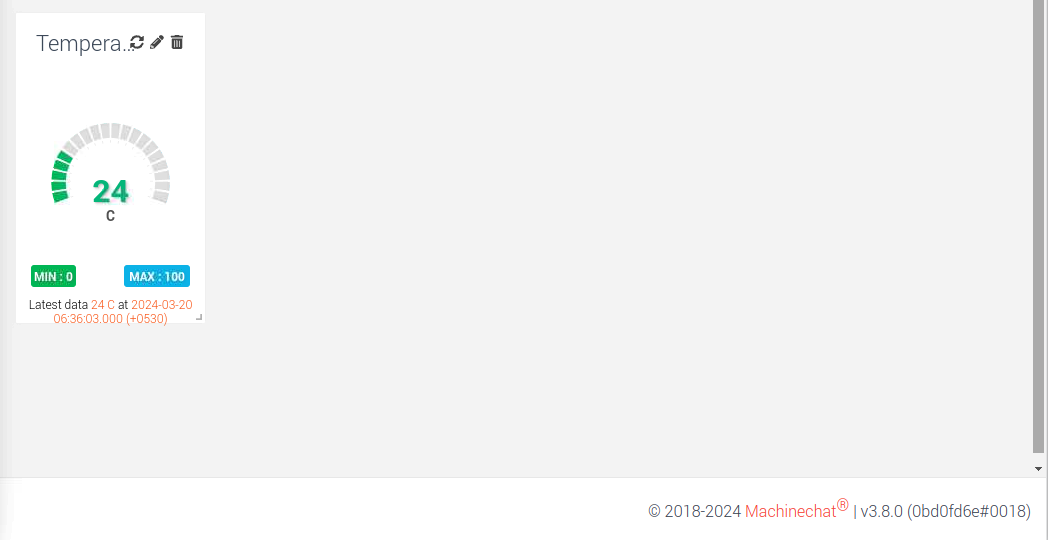
- Click on ADD to save the configuration and add the chart to the dashboard.

You will be able to see a Gauge on the dash board.
MQTT Data Collector
JEDI offers a robust array of pre-configured data collectors, readily available for immediate use. These collectors cater to typical IoT situations and encompass:
- HTTP: Enables the reception of data from devices, scripts, and other applications via HTTP API.
- MQTT Broker: Facilitates the acquisition of data from sensors and devices through MQTT, a widely utilized IoT messaging protocol.
- TCP: Allows data retrieval from devices communicating via raw TCP connections.
- Serial: Establishes connections with devices transmitting data over serial ports (e.g., Arduino boards, GPS receivers, etc.).
So we are going to discuss on most popular MQTT protocol.
Prepare Your Xiao
Before you upload the code please configure SSID WiFi Password MQTT Sever IP(JEDI IP) MQTT User Name MQTT Password . In this example we are going to send some dummy data to Machine Chat JEDI.
#include <WiFi.h>
#include <PubSubClient.h>

const char* ssid = "ABC";
const char* password = "XXXXX";
const char* mqtt_server = "192.XXX.X.XXX";  // Replace with your MQTT broker's IP
const int mqtt_port = 1883;  // Default MQTT port
const char* mqtt_username = "ABC";
const char* mqtt_password = "ABC123";

WiFiClient espClient;
PubSubClient client(espClient);

void setup() {
  Serial.begin(115200);
  WiFi.begin(ssid, password);
  client.setCallback(callback);
  while (WiFi.status() != WL_CONNECTED) {
    delay(1000);
    Serial.println("Connecting to WiFi...");
  }

  Serial.println("Connected to WiFi");
  client.setServer(mqtt_server, mqtt_port);
}

void loop() {
  if (!client.connected()) {
    reconnect();
  }
  client.loop();

  // Generate random values for each lab: VOC, human presence, temperature, and humidity
  for (int lab = 1; lab <= 3; lab++) {
    int voc = random(60, 80);
    int presence = random(0, 3); // Assuming presence is represented as a boolean (0 for no presence, 1 for presence)
    bool acState = false; // Default A/C state is off
    float temperature = random(18, 30); // Assuming temperature is in Celsius
    int humidity = random(30, 70); // Assuming humidity is a percentage
    bool fire = false;

    // Check if temperature is greater than 25 and human presence is true
    if (temperature > 25 && presence) {
      acState = true; // Turn on the A/C
    }

    // Construct payload
    String payload = "{\"lab\":" + String(lab) + ",\"voc\":" + String(voc) + ",\"presence\":" + String(presence) + ",\"acState\":" + String(acState) + ",\"temperature\":" + String(temperature) + ",\"humidity\":" + String(humidity) +",\"fire\":" + String(fire) + "}";

    // Publish payload for the current lab
    client.publish(("Lab" + String(lab) + "/data").c_str(), payload.c_str());
  }

  delay(10000); // Wait for 10 seconds before sending next data
}

void reconnect() {
  while (!client.connected()) {
    Serial.println("Attempting MQTT connection...");
    if (client.connect("ESP32Client", mqtt_username, mqtt_password)) {
      Serial.println("connected");
      // Subscribe to topics if needed
       client.subscribe("rpi/data");
    } else {
      Serial.print("failed, rc=");
      Serial.print(client.state());
      Serial.println(" try again in 5 seconds");
      delay(5000);
    }
  }
}

void callback(char* topic, byte* payload, unsigned int length) {
    Serial.print("Message arrived in topic: ");
    Serial.println(topic);

    Serial.print("Message:");
    for (int i = 0; i < length; i++) {
        Serial.print((char)payload[i]);
    }
    Serial.println();
}
Enable the MQTT Broker
-
Navigate to Settings -> Data Collectors.
-
Click the ADD CONNECTOR button to add a new collector.

-
Select "MQTT Broker" as the Collector Type.
-
Advanced Configuration Options:
-
Listen IP: The IP address that the MQTT broker listens on. Jedi IP adress.

Username/Password: Enable this option and configure username and password for client authentication. Clients will need to provide valid credentials to connect to the MQTT broker So you need to replace it with Arduino code.

In the device dashboard, you will see our MQTT device (ESP32Client) is added.

Dashboard Preparation
Create Custom Data Dashboard
Machinechat JEDI's dashboards offer a robust and adaptable method for converting raw IoT data into insightful visualizations. Through an intuitive drag-and-drop interface, users can effortlessly craft personalized dashboards to suit their unique requirements, effectively bringing their data narratives to fruition.
These dashboards come in various types, including Data Dashboards for customizable grid-based layouts, Device Dashboards for real-time device and sensor data display, and System Dashboards for overlaying data onto background images, ideal for creating process diagrams or HMI-style interfaces.
- Navigate to the Dashboard Manager section in the JEDI web interface.

- Then Click on ADD DASHBOARD

- Choose a dashboard Type (This case it is Data view) Name and Description and save it.

Afterward, you'll notice the addition of the new dashboard to the sidebar. Lets add some widgets. First, we are going to add Line chart.
Add Line Chart
-
Click ADD CHART
-
Give a Name as you wish and Select Chart type as Line. And click on plus mark to add data sources.

- Add Source , the Property tag ,and give suitable name and units.

- After click on ADD Add data source window and New chart window you will be able to see nice Line chart.

Add a Stacked Line Graph
-
Again click on Add graph.
-
Give Name as you wish and Select Chart type as Line.Also enable Multiple Y axis mode. We'll use one for "Temperature" and another for "Humidity". And click on plus mark to add data sources.

- Add Source , the property tag ,and give suitable name and units and click Add button.

- Adding the Second Metric :Click plus icon to add another metric to same Line Chart.

- Again Add Source , the Property tag ,and give suitable name and units also select Y Axis on Right.Then Click Add.

- So finally click on Add.

And that is it!! You will be able to get stacked line chart.

In conclusion, Machinechat JEDI with reTerminal DM stands as a transformative solution, revolutionizing the landscape of industrial operations and smart infrastructure management. By seamlessly integrating IIoT capabilities, this will empower users to leverage real-time data from connected devices, offering unparalleled insights into manufacturing processes, supply chain logistics, and operational efficiency.

Resources
- [Web Page] Machinechat Official Documentation
Tech Support
Thank you for choosing our products! We are here to provide you with different support to ensure that your experience with our products is as smooth as possible. We offer several communication channels to cater to different preferences and needs.