Wio Terminal Edge Impulse Anomaly Detection for Predictive Maintenance
In this project, we will use data from Wio Terminal built-in accelerometer, perform anomaly detection on-device and then send data to Blynk Edgent Cloud.
Anomalies. Or specifically anomaly detection for predictive maintenance. We’re going to be using data from Wio Terminal built-in accelerometer, perform neural network model inference and anomaly detection on-device and then send data to new version of Blynk IoT platform with plethora of new features, which fully supports Wio Terminal.
For full tutorial and video demonstration, have a look at the accompanying video:
That’s WHAT, now for HOW part, let’s start with an example that might be more familiar.
Anomaly detection and predictive maintenance in a nutshell
If you train a simple image recognition model to recognize let’s say 5 different classes of animals (tiger, elephant, bear, snake and giraffe) and then give it an image of a person, it will make a prediction to the best of it’s abilities and possibly say it’s an elephant. Cue the laughter of ordinary folks, who do not really understand much about internal works of this particular model and computer vision in general.
Of course, the model didn’t do anything wrong – it processed the image, calculated the features present and then output classification result based on these features. Although if we plot the features from classes and cluster them, we would see that ideally the human image features are far from any class cluster and thus represent an “outlier”.
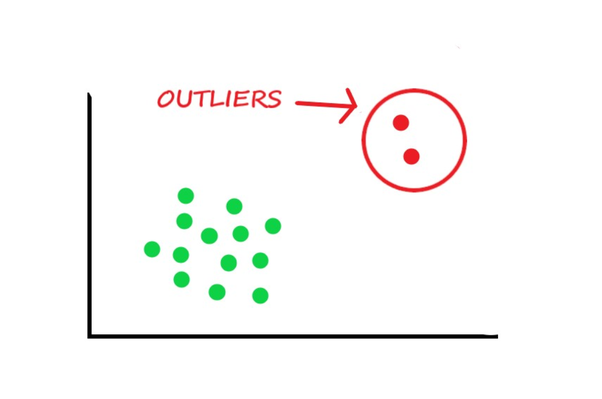
Which of course could be just a very weird image of one of the animals, but in most of cases it’s much more likely that it’s an object model wasn’t trained to recognize.
For computer vision and speech recognition tasks we often have “background” class to deal with this problem, which basically represents anything that is not the classes of interest. In some situations, we really just want our model to be able to interpret all the data as “normal” and “abnormal”. It doesn’t matter what are the exact characteristics of “abnormal” – they can be wildly different, the important thing is, if “abnormal” class is detected, some measures need to be implemented. What I described now is the premise behind using Machine Learning for predictive maintenance. We monitor the state of device, be it air conditioner, water pump or other machinery with sensors and based on profile of known “normal” operation, trying to detect when something goes SLIGHTLY wrong, before it goes SERIOUSLY wrong.
Collecting the data and training the model
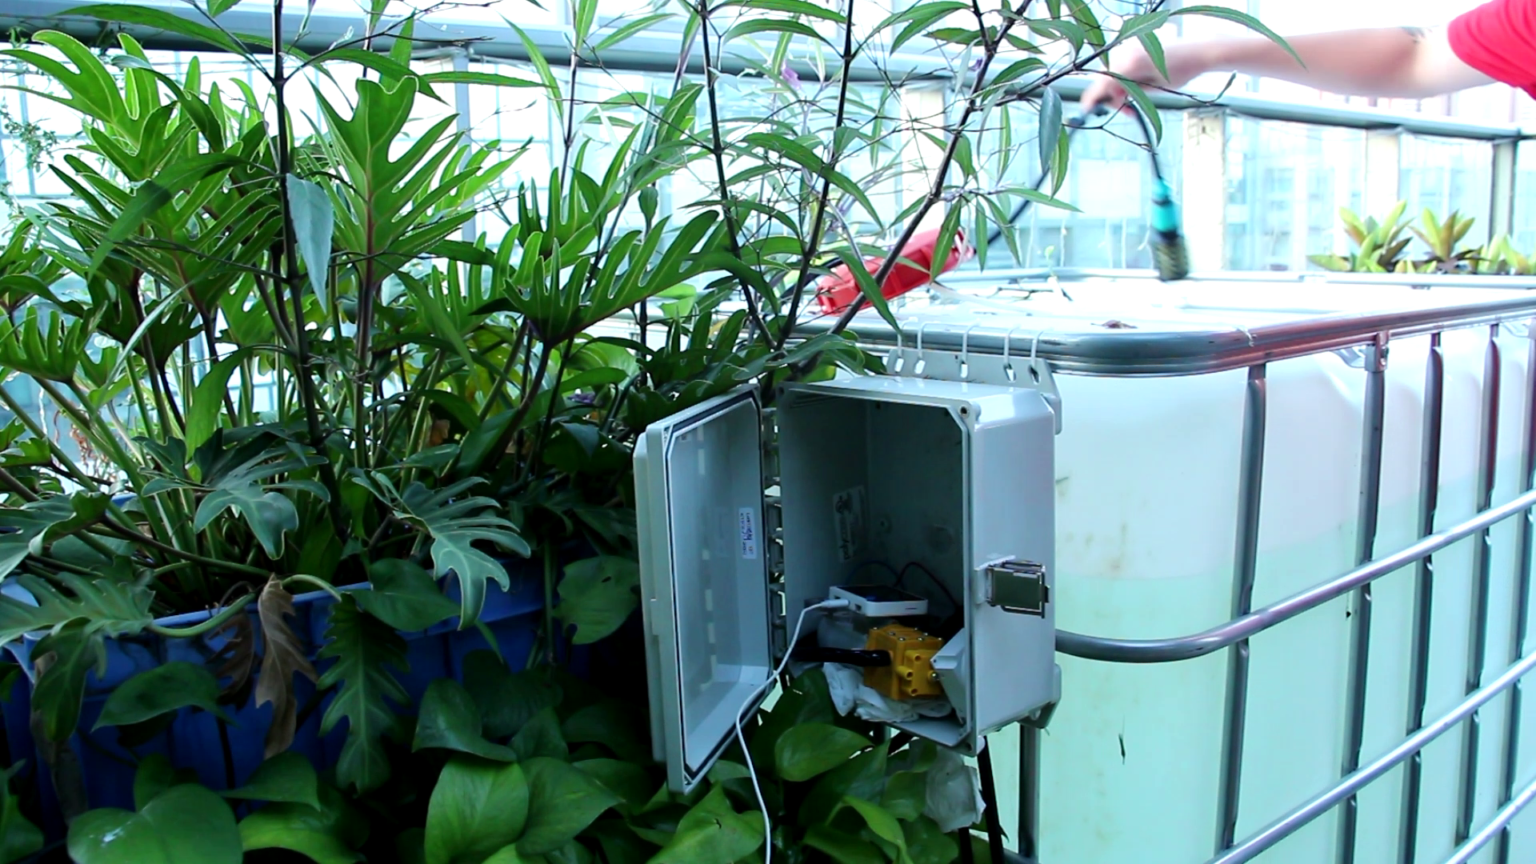
For this project I installed Wio Terminal on a water pump on our office’s outside patio, which has some plants and fish.

Then I collected two categories of samples – idle and normal operation and trained a simple model to recognize these two based on Spectral Features processing block output.
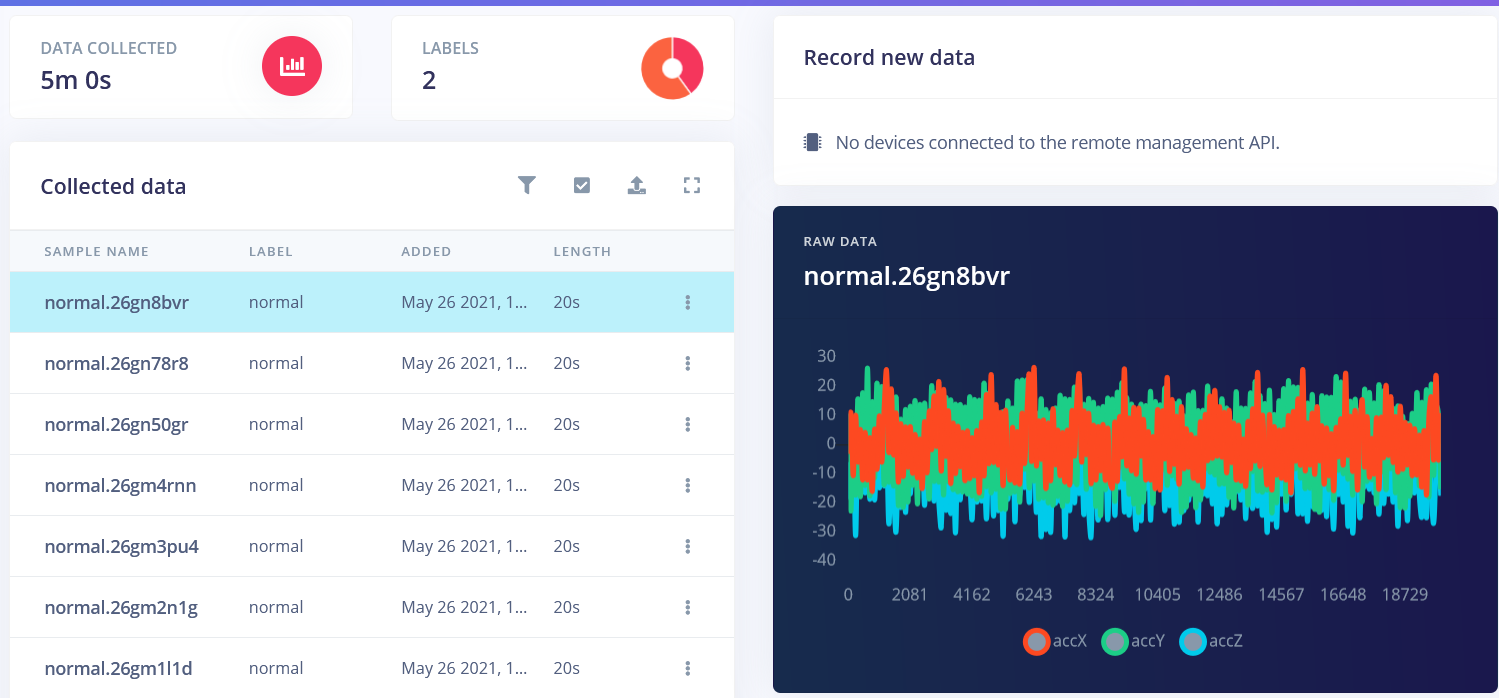
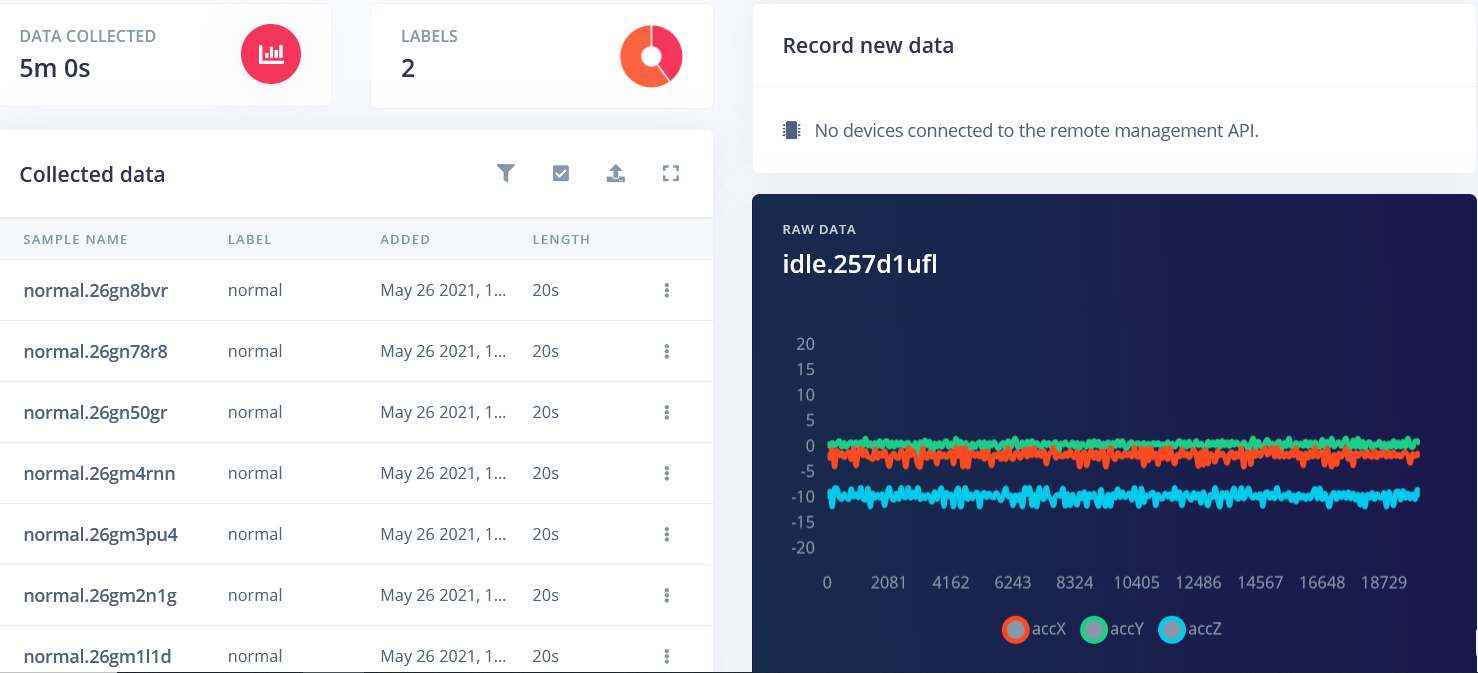
For exact parameters of processing and learning blocks, you can have a look at the public version of the project I shared. The only significant tweak I made was changing filter from low to high, which made the features of different classes more prominent. Distinguishing between idle and normal pump operation of course proven to be really easy. More challenging task was malfunction detection. To simulate malfunction I would take the water pump out of the tank – this basically lead to sound and vibration levels decreasing.
Looking at the malfunction sample, at the feature explorer on the accX RMS, accY RMS and accZ RMS axes, we see that is is halfway between idle and normal operation samples.
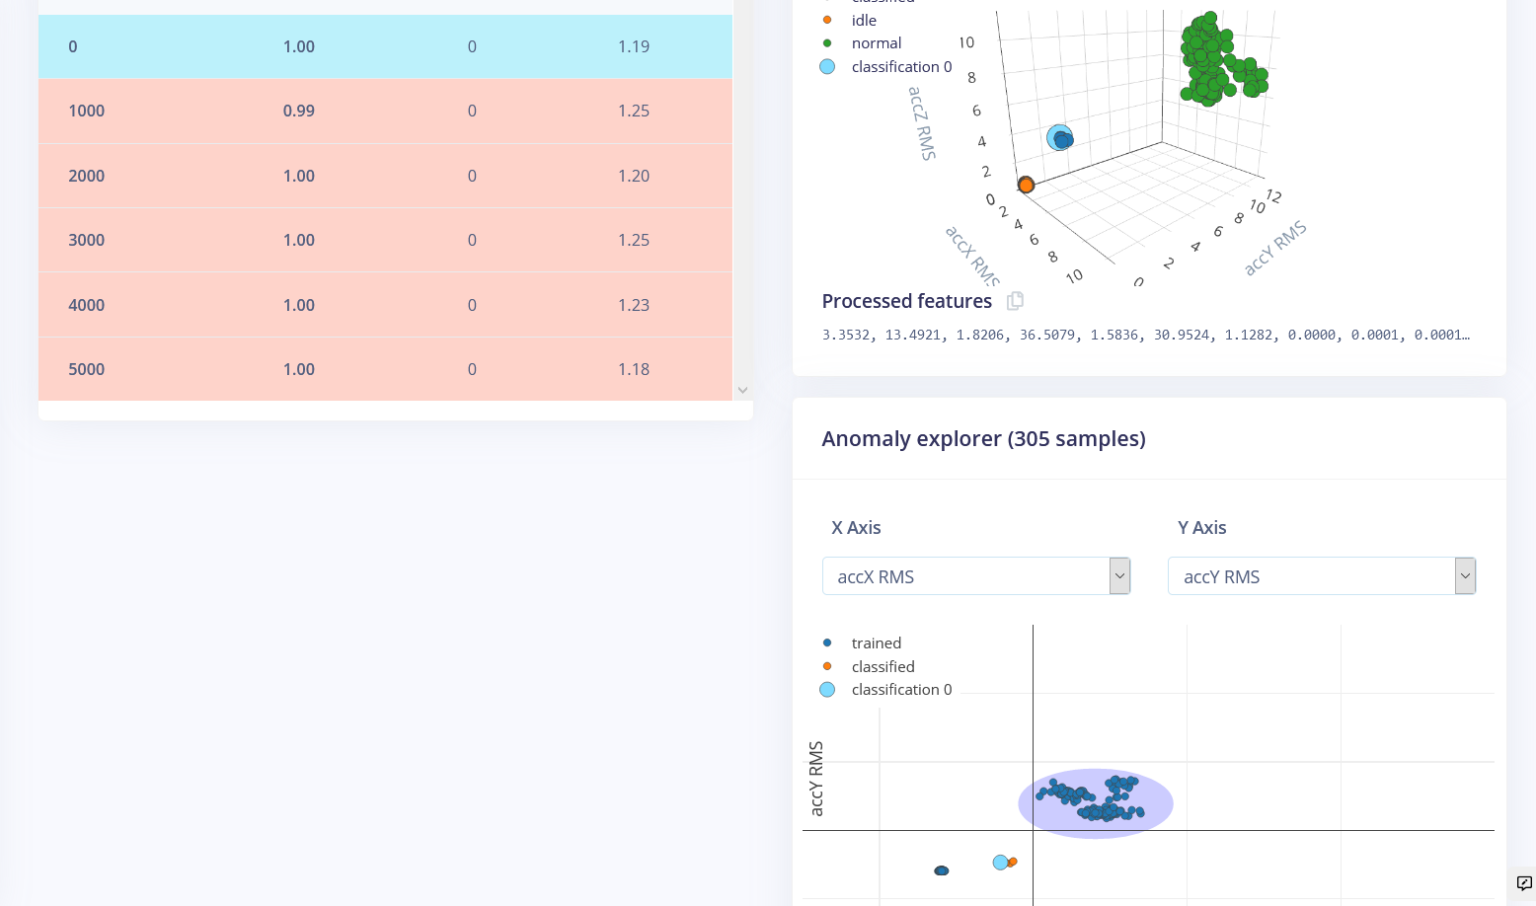
We can use this to our advantage by training a new (second) network that creates clusters around data that we have seen before, and compares incoming data against these clusters. If the distance from a cluster is too large the sample is flagged the sample as an anomaly.
After trial and error I found that very low cluster count and distance threshold of 0.5 works the best for anomaly detection, but this is very case-specific and depends on your data. One thing that helped to increase the accuracy was fixing Wio Terminal on the water pump firmly with glue – for actual device you can use screws. Before fixing firmly, Wio Terminal was wobbling randomly, which was introducing too much noise into normal operation samples.
Deployment and testing
After the model is trained and tested using Live classification mode it is time to deploy it back to the device. We compile and download the Arduino library, extract it to Arduino libraries folder and then modify nano33_ble_sense_accelerometer sketch to match the accelerometer we have in Wio Terminal. For simple test we use LCD screen that lights red if anomaly is detected.
#define ANOMALY_THRESHOLD 0.5

/* Includes ---------------------------------------------------------------- */
#include <wio_anomaly_detection_inference.h>
#include"LIS3DHTR.h"
#include"TFT_eSPI.h"

TFT_eSPI tft;
LIS3DHTR<TwoWire> lis;

/* Constant defines -------------------------------------------------------- */
#define CONVERT_G_TO_MS2    9.80665f

/* Private variables ------------------------------------------------------- */
static bool debug_nn = false; // Set this to true to see e.g. features generated from the raw signal

/**
* @brief      Arduino setup function
*/
void setup()
{
    // put your setup code here, to run once:
    Serial.begin(115200);
    //while (!Serial) {delay(10);}

    Serial.println("Edge Impulse Inferencing Demo");

    tft.begin();
    tft.setRotation(3);

    lis.begin(Wire1);

    if (!lis.available()) {
    Serial.println("Failed to initialize IMU!");
    while (1);
    }
    else {
        ei_printf("IMU initialized\r\n");
    }
    lis.setOutputDataRate(LIS3DHTR_DATARATE_100HZ); // Setting output data rage to 25Hz, can be set up tp 5kHz
    lis.setFullScaleRange(LIS3DHTR_RANGE_16G); // Setting scale range to 2g, select from 2,4,8,16g


    if (EI_CLASSIFIER_RAW_SAMPLES_PER_FRAME != 3) {
        ei_printf("ERR: EI_CLASSIFIER_RAW_SAMPLES_PER_FRAME should be equal to 3 (the 3 sensor axes)\n");
        return;
    }
}

/**
* @brief      Printf function uses vsnprintf and output using Arduino Serial
*
* @param[in]  format     Variable argument list
*/
void ei_printf(const char *format, ...) {
   static char print_buf[1024] = { 0 };

   va_list args;
   va_start(args, format);
   int r = vsnprintf(print_buf, sizeof(print_buf), format, args);
   va_end(args);

   if (r > 0) {
       Serial.write(print_buf);
   }
}

/**
* @brief      Get data and run inferencing
*
* @param[in]  debug  Get debug info if true
*/
void loop()
{

    ei_printf("Sampling...\n");

    // Allocate a buffer here for the values we'll read from the IMU
    float buffer[EI_CLASSIFIER_DSP_INPUT_FRAME_SIZE] = { 0 };

    for (size_t ix = 0; ix < EI_CLASSIFIER_DSP_INPUT_FRAME_SIZE; ix += 3) {
        // Determine the next tick (and then sleep later)
        uint64_t next_tick = micros() + (EI_CLASSIFIER_INTERVAL_MS * 1000);

        lis.getAcceleration(&buffer[ix], &buffer[ix+1], &buffer[ix + 2]);
        buffer[ix + 0] *= CONVERT_G_TO_MS2;
        buffer[ix + 1] *= CONVERT_G_TO_MS2;
        buffer[ix + 2] *= CONVERT_G_TO_MS2;

        delayMicroseconds(next_tick - micros());
    }

    // Turn the raw buffer in a signal which we can the classify
    signal_t signal;
    int err = numpy::signal_from_buffer(buffer, EI_CLASSIFIER_DSP_INPUT_FRAME_SIZE, &signal);
    if (err != 0) {
        ei_printf("Failed to create signal from buffer (%d)\n", err);
        return;
    }

    // Run the classifier
    ei_impulse_result_t result = { 0 };

    err = run_classifier(&signal, &result, debug_nn);
    if (err != EI_IMPULSE_OK) {
        ei_printf("ERR: Failed to run classifier (%d)\n", err);
        return;
    }

    // print the predictions
    ei_printf("Predictions ");
    ei_printf("(DSP: %d ms., Classification: %d ms., Anomaly: %d ms.)",
        result.timing.dsp, result.timing.classification, result.timing.anomaly);
    ei_printf(": \n");
    for (size_t ix = 0; ix < EI_CLASSIFIER_LABEL_COUNT; ix++) {
        ei_printf("    %s: %.5f\n", result.classification[ix].label, result.classification[ix].value);
    }
#if EI_CLASSIFIER_HAS_ANOMALY == 1
    ei_printf("    anomaly score: %.3f\n", result.anomaly);

  if (result.anomaly > ANOMALY_THRESHOLD)
  {
    tft.fillScreen(TFT_RED);
    tft.setFreeFont(&FreeSansBoldOblique12pt7b);
    tft.drawString("Anomaly detected", 20, 80);
    delay(1000);
    tft.fillScreen(TFT_WHITE);
  }

#endif
}

#if !defined(EI_CLASSIFIER_SENSOR) || EI_CLASSIFIER_SENSOR != EI_CLASSIFIER_SENSOR_ACCELEROMETER
#error "Invalid model for current sensor"
#endif
Of course, for real application, this sort of notification is not likely going to work, because there is no person to constantly watch over it.
Utilizing new release of Blynk IoT platform
To make this demo useful, we’re going to use Blynk IoT platform.

The Blynk IoT platform includes such features as a web dashboard to monitor devices, manage who access the data, a WI-FI manager for easy setup procedure, new approach to device model creation and others.
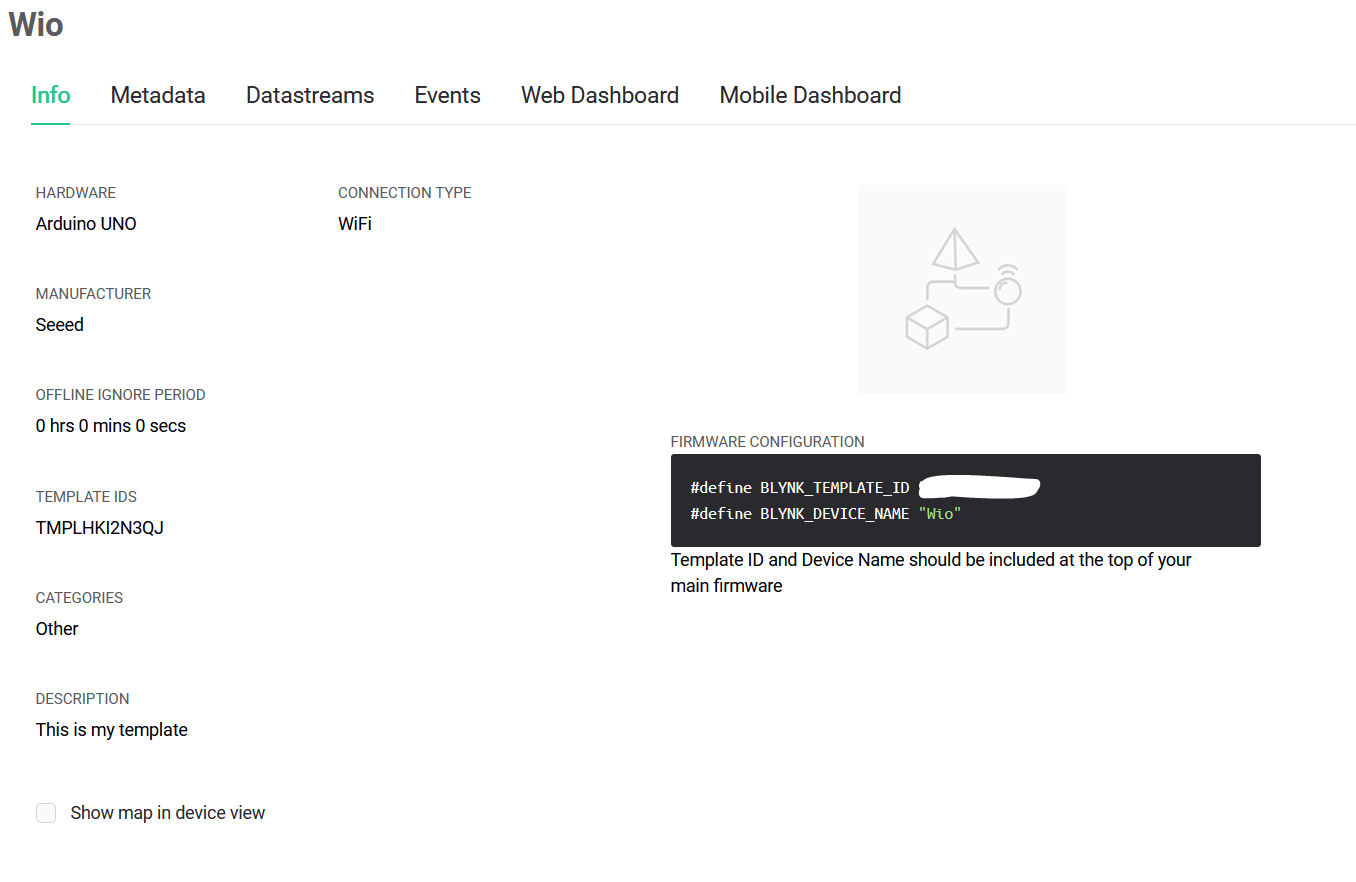
Go to blynk.cloud, register an account or create a new one. Then create a new template – templates are digital models of the device which can be inherited by multiple devices with similar functionality. The power of templates is an instant update of device data model no matter the size of your devices fleet.
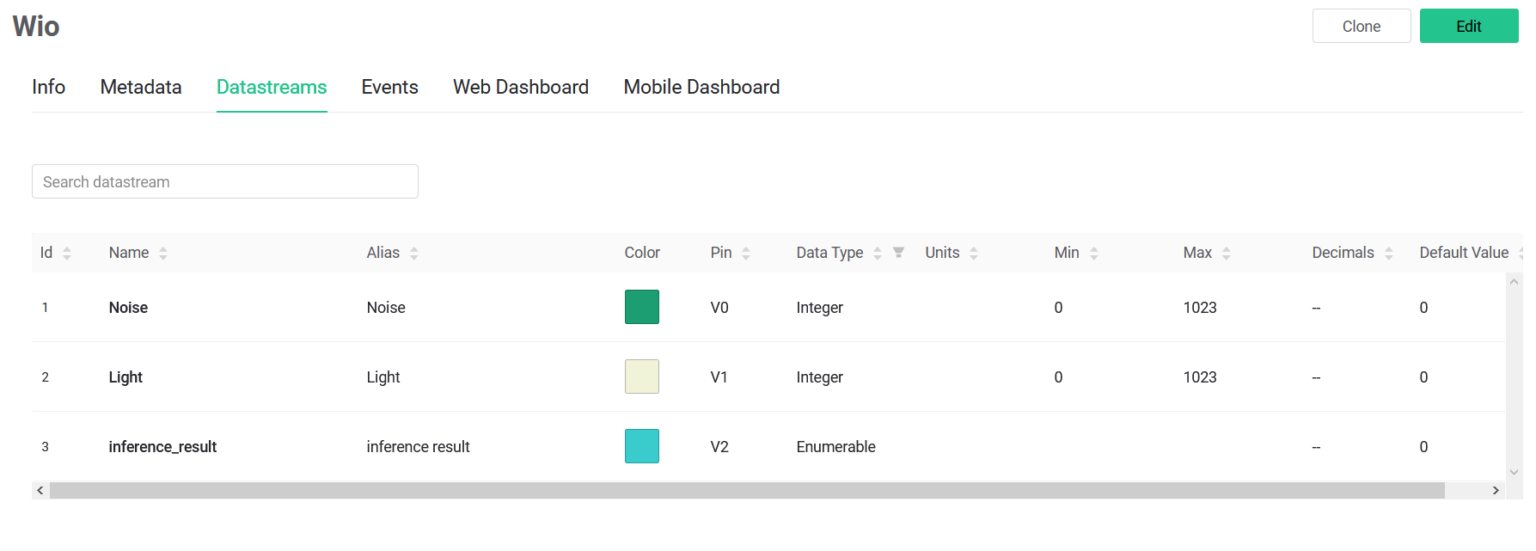
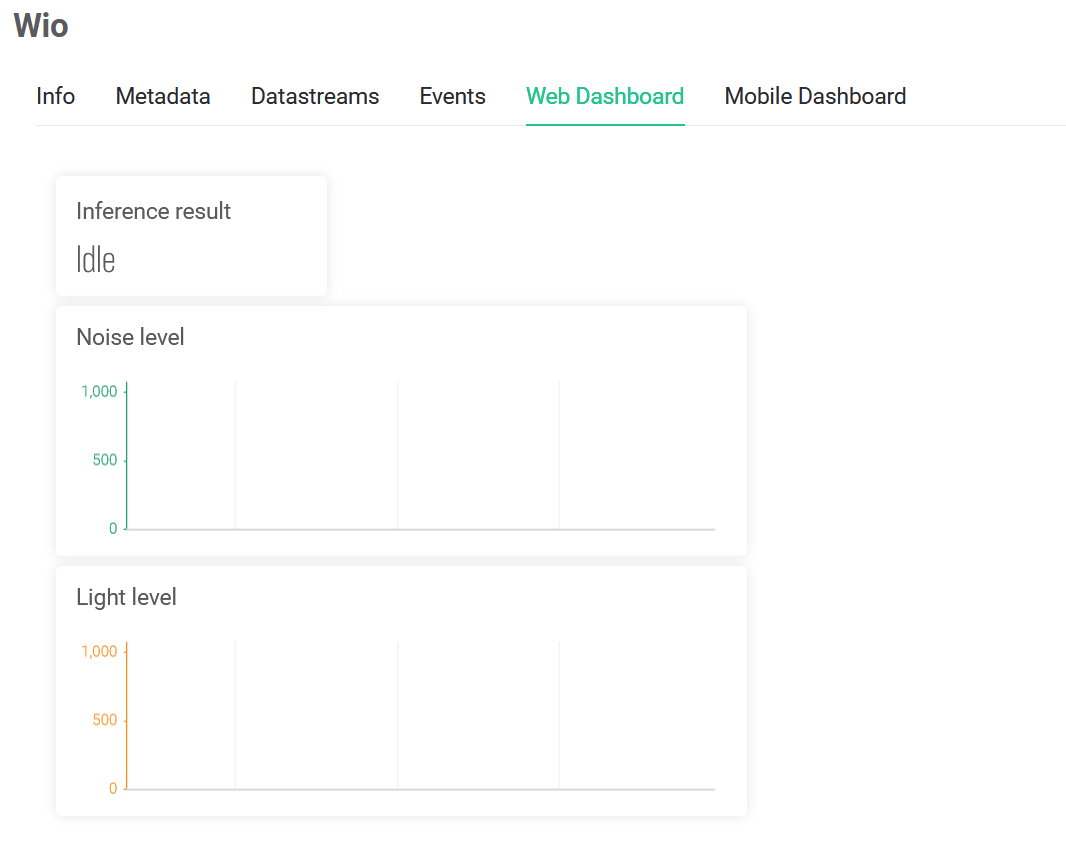
Choose Arduino Uno as hardware and Wi-Fi as connection type. Then populate Datastreams and Dashboard tabs as in the following screenshots and save the changes.
We’re not using Metadata or Events tabs in this project. The main purpose of device template main components:
- Metadata – additional data about the device you can configure.
- Datastreams – an entity to define the data that flows in and out from device. Overall, it’s very similar to Virtual Pins (which can be used too).
- Events – a list of important alerts and notifications.
- Web Dashboard – A set of Widgets in the Web app
- Mobile Dashboard – A set of Widgets in the Mobile app
Create a new device in My Devices tab – choose the template you have created and give it a unique name.
Now the web interface is ready to receive the data from our device. Download the example sketch from Seeed Wio Terminal example sketches repository – besides main sketch file it also contains helper files, where Wi-Fi manager code is located. In the main sketch file, the data collection/data processing/inference code we used for testing with LCD screen was moved to run_inference() function. The class ID of the class with highest confidence (if the confidence is above set threshold) is saved inside best_result global variable and together with light and sound sensors data is being sent to Blynk server at periodic intervals. Remember to change BLYNK_TEMPLATE_ID and BLYNK_DEVICE_NAME to the ones from you Device template.
After you upload the code to Wio Terminal, it will create a hot spot, which you can connect to with your phone. Upon connection you will be automatically re-directed to a simple configuration page, where you need to enter your WiFi credentials, your API token (you can find it by clicking on your device in My Devices tab and then going to Device Info) and then click on Connect. Then Wio Terminal will connect to WiFi network and Blynk cloud server and start sending the data. You can press on device in My Devices tab and see the pretty graphs and status message. You can see the test results towards the end of the video.
Obviously, same approach can be applied to detecting irregularities in other machinery operation – we can use accelerometer for pretty much everything with moving parts, since these produce vibration we can measure. If device emits audible sounds, we can use microphone too. A combination of sensors might even work better. Are there any other good applications where predictive maintenance can be used? Write your ideas in the comments! Hope this article and video were useful for you!