Histogram
This repo describes how to draw histogram on Wio Terminal. Similar to the Line Charts library, you can use this to display raw sensor values to visualize readings on screen. This library is very flexible and can modify to your own need.
Libraries Installation
Installing Histogram Libraries
-
Visit Seeed_Arduino_Histogram and download the entire repo to your local drive.
-
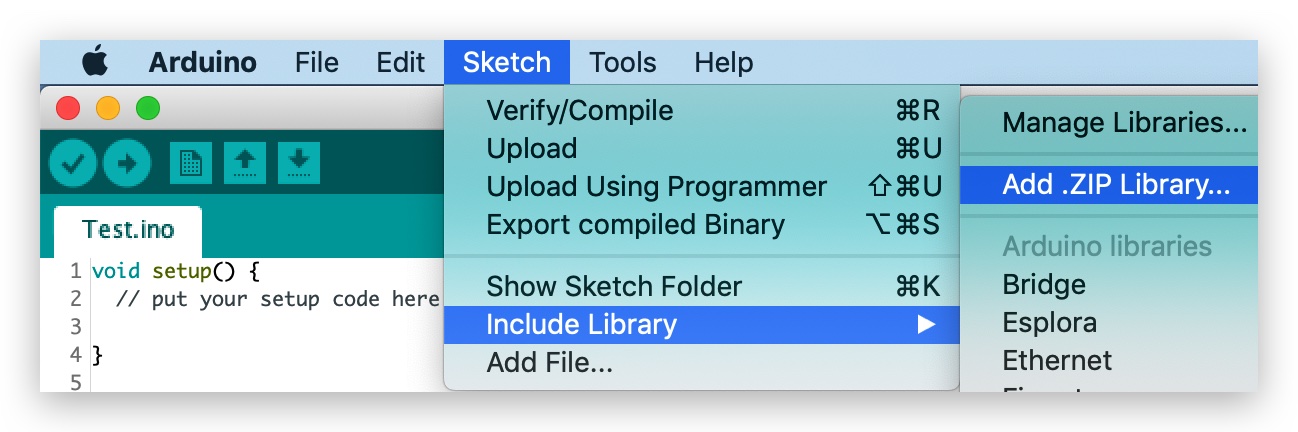
Now, the library can be installed to the Arduino IDE. Open the Arduino IDE, and click
sketch->Include Library->Add .ZIP Library, and choose theSeeed_Arduino_Histogramfile that you've have just downloaded.
Getting Started
To Initialize for drawing Histogram
Include the Histogram library and initialize the histogram as follow:
#include <TFT_eSPI.h> // Hardware-specific library
#include <SPI.h>
#include"Histogram.h"

TFT_Histogram histogram=TFT_Histogram(); //Initializing Histogram
TFT_eSPI tft = TFT_eSPI(); //Initializing TFT

void setup(void) {
  tft.init();
  histogram.initHistogram(&tft);
  ...
}
Creating Columns in Histogram
To create columns in histogram:
void formHistogram(String label,int NO,double Histogram_value,int Histogram_WIDTH,uint32_t colour);
where label is the column name under its column , NO is the number tag of the histogram column, Histogram_value is the value of histogram column, Histogram_WIDTH is the width of the histogram column and colour is the colour of histogram column colour.
To Show Histogram
To show the Histogram:
void showHistogram();
Changing the Column values
To change the values of existed columns:
void changeParam(uint8_t NO, String lable, float Histogram_value, uint32_t colour);
where NO refers back to the number tag of the histogram column(which column to change).
Deleting a Column
To delete a column from histogram:
void deleteCylinder(uint8_t NO);
where NO refers to the number tag of histogram column.
Adding Line Chart to Histogram
Adding line chart:
void lineChart(uint32_t colour);
where color is the colour of the line chart.
Hiding the Axis of Histogram
void notShowAxis();
Others useful functions
For more other useful functions of the histogram library, please refer to the Histogram.h. Further, it also provides sets of examples as well as a full function demo that can be found in the examples folder.
Example Code
#include <TFT_eSPI.h> //Hardware-specific library
#include <SPI.h>
#include"Histogram.h" //include histogram library
TFT_Histogram histogram=TFT_Histogram(); //Initializing tft and histogram
TFT_eSPI tft = TFT_eSPI();
void setup() {
tft.init();
histogram.initHistogram(&tft);
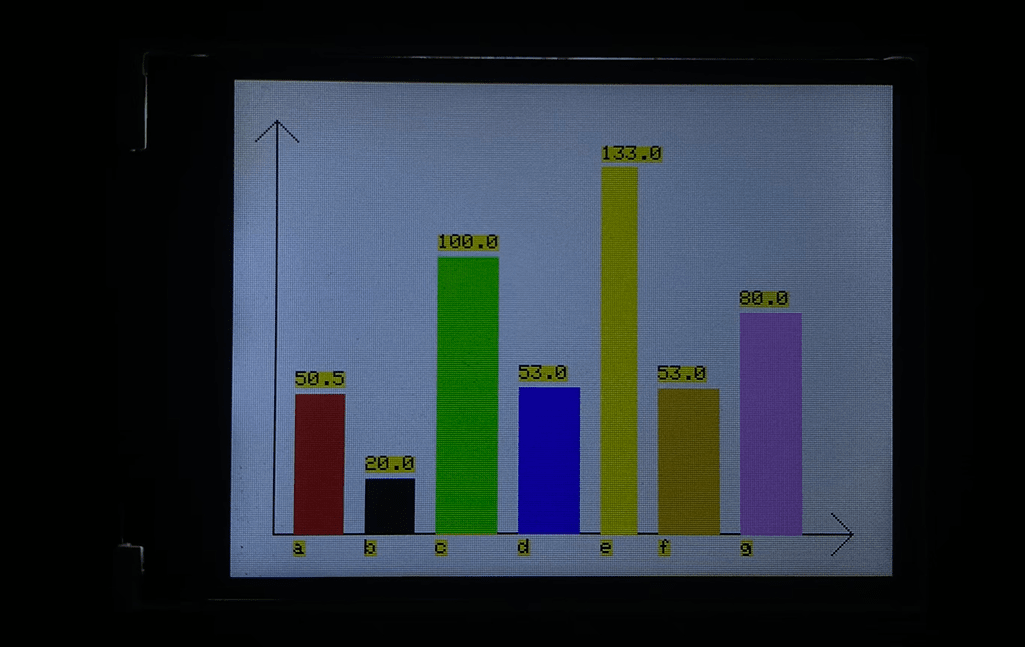
histogram.formHistogram("a",1,50.55,40,TFT_RED); //Column 1
histogram.formHistogram("b",2,20,40,TFT_BLACK); //Column 2
histogram.formHistogram("c",3,100,50,TFT_GREEN); //Column 3
histogram.formHistogram("d",4,53,50,TFT_BLUE); //Column 4
histogram.formHistogram("e",5,133,30,TFT_YELLOW); //Column 5
histogram.formHistogram("f",6,53,50,TFT_ORANGE); //Column 6
histogram.formHistogram("g",7,80,50,TFT_PINK); //Column 7
histogram.showHistogram(); //show histogram
delay(3000);
histogram.changeParam(6,"F",55,TFT_PINK);//change column 6
histogram.deleteCylinder(7);//delete colum 7
histogram.lineChart(TFT_BLACK);
delay(2000);
histogram.notShowAxis();//hiding the axis of histogram
}
void loop() {
}
Tech Support & Product Discussion
Thank you for choosing our products! We are here to provide you with different support to ensure that your experience with our products is as smooth as possible. We offer several communication channels to cater to different preferences and needs.