Integrating Historian Module for Visualizing on reTerminal DM
Introduction
Introducing N3uron Historian: a powerful time-series storage system built on MongoDB. Easily configure it to store data from MongoDB in x64 bit, x32 bit and ARM architectures. With Neuron Historian, you can store tag values collected locally or remotely via N3uron Links. Plus, it offers a handy Store & Forward feature for data retention during communication loss. Thanks to efficient compression and partitioning, it handles massive data volumes without performance loss. For reference, 1GB of storage can hold around 100 million events. Let's dive into setting it up step by step!
Prerequisites
Hardware
| reTerminal DM |
|---|
 |
Software
We highly recommend studying how to connect N3uron with AWS IoT Core. Later in the tutorial, you'll learn how to create charts using the Historian Module. If you're new to N3uron, we suggest starting with the Getting Started with N3uron guide. It covers navigating the N3uron web interface, understanding concepts like the Web UI and Web Vision module, grasping tag concepts, and creating basic dashboards. Exploring these fundamentals first is advisable before moving forward. You can access the guide through the provided link.
To install MongoDB on your reTerminal DM
In x32 and ARM architectures, the user requires first to install MongoDB and configure Historian to store data in the external MongoDB instance.
- Step 1: Organize Files
Place the provided files (install.sh, uninstall.sh, libcryto.so.1.1, and libssl.so1.1) in a separate folder on your reterminal DM desktop or any other preferred location.
- Step 2: Navigate to the Folder
Open a terminal and navigate to the folder containing the files.
cd your/folder/path
- Step 3: Run Installation Script
Execute the install.sh file to install MongoDB.
./install.sh
You may be prompted to enter your sudo password during the installation process.
- Step 4: Verify Installation
After the installation is complete, enter the following command to access MongoDB:
mongo
This will open the MongoDB shell.
- Step 5: Create a Database
Inside the MongoDB shell, enter the following command to create a database named "mongo" if it doesn't exist:
use mongo
Now, MongoDB is installed on your reTerminal DM, and you have created a database named "mongo".
- Step 6: If your distribution doesn't provide this libraries, place them in this libcryto.so.1.1, and libssl.so1.1 on respective folders /usr/lib and /lib. Use this commands for this
sudo cp /path/to/your/folder/libcryto.so.1.1 /usr/lib
sudo cp /path/to/your/folder/libcryto.so.1.1 /lib

sudo cp /path/to/your/folder/ libssl.so1.1 /usr/lib
sudo cp /path/to/your/folder/ libssl.so1.1 /lib
Create Historian Module
- Step 1: Access N3uron Interface
Go to http://localhost:8003 in your web browser.
- Step 2: Navigate to Configuration
Under the navigation menu, select Config and then choose Modules. Click on the three bars icon and select New Module to create a new module named Historian.

- Step 3: Configure Module
Select Module type as Historian and save the configuration.

- Step 4: Change Database Type
Click on the Historian module you just created. Change the Database type to External. You will see the protocol as mongodb and the database as mongo. Enable Node History mode and save the settings.

Enable Node History mode

Create a Historian tag
-
Step 01: Within the Explorer panel, select Tags.
-
Step 02: In the Model menu, right-click on the folder icon, select New Tag and give it a name. In this example, we will use TestVal

- Step 3: Enable Simulation and History
Change the Simulation to Enabled, ensure history is enabled, and set the module name as Historian. Save the settings.
if you don't have a source for your tag and want to simulate it, you can enable simulation(optional), or give it Read/write permissions and manually give values to the tag. But if your setup the source of this tag as MQTT coming from AWS. the source is Aws. So you must disable Simulation. Otherwise you are only reading data coming from the simulation and not from AWS.So in this case simulation doesn't apply. since you are setting the sorce of the tag coming from MQTT.

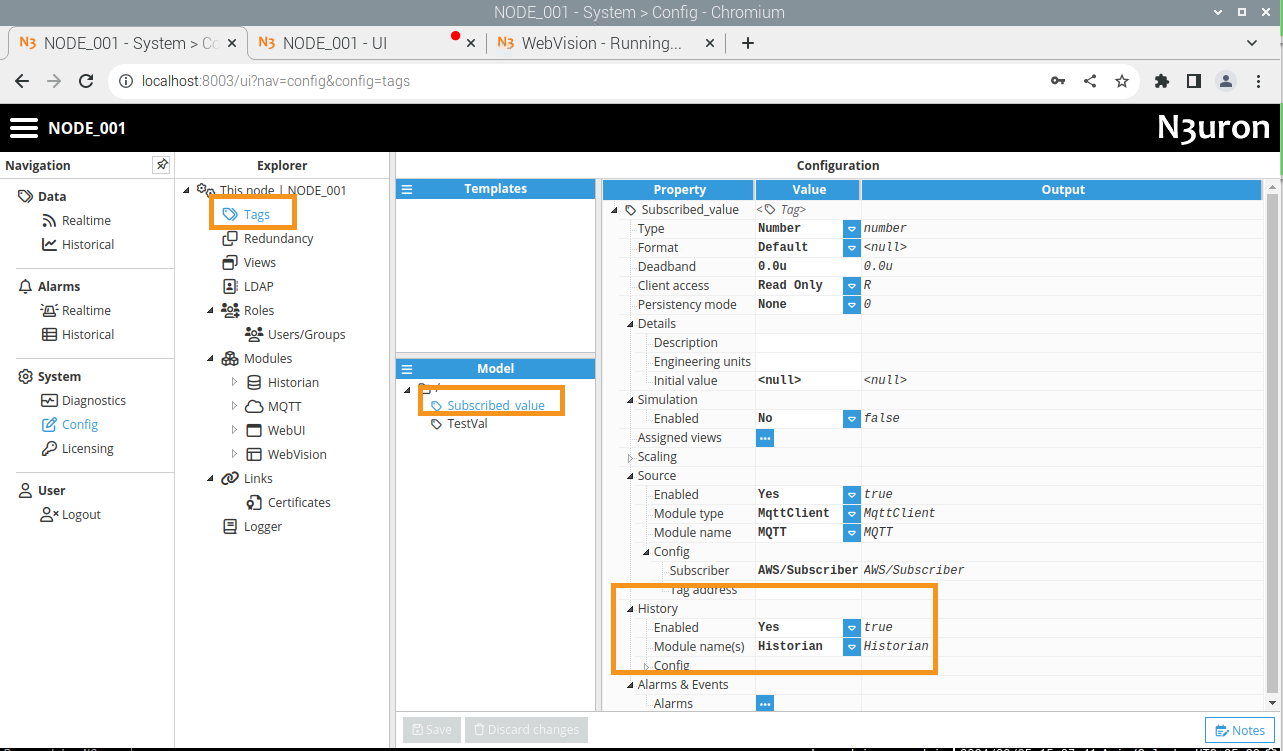
Configure Historian Tag to Source enabled Tag
To embed the Historian tag into the previously created tag subscribed to the AWS IoT Core topic, modify the Subscribed_value settings as follows:
Ensure that History is Enabled, the module name is set to Historian
Visualization
If you have created a WebVision module, you can follow these steps:
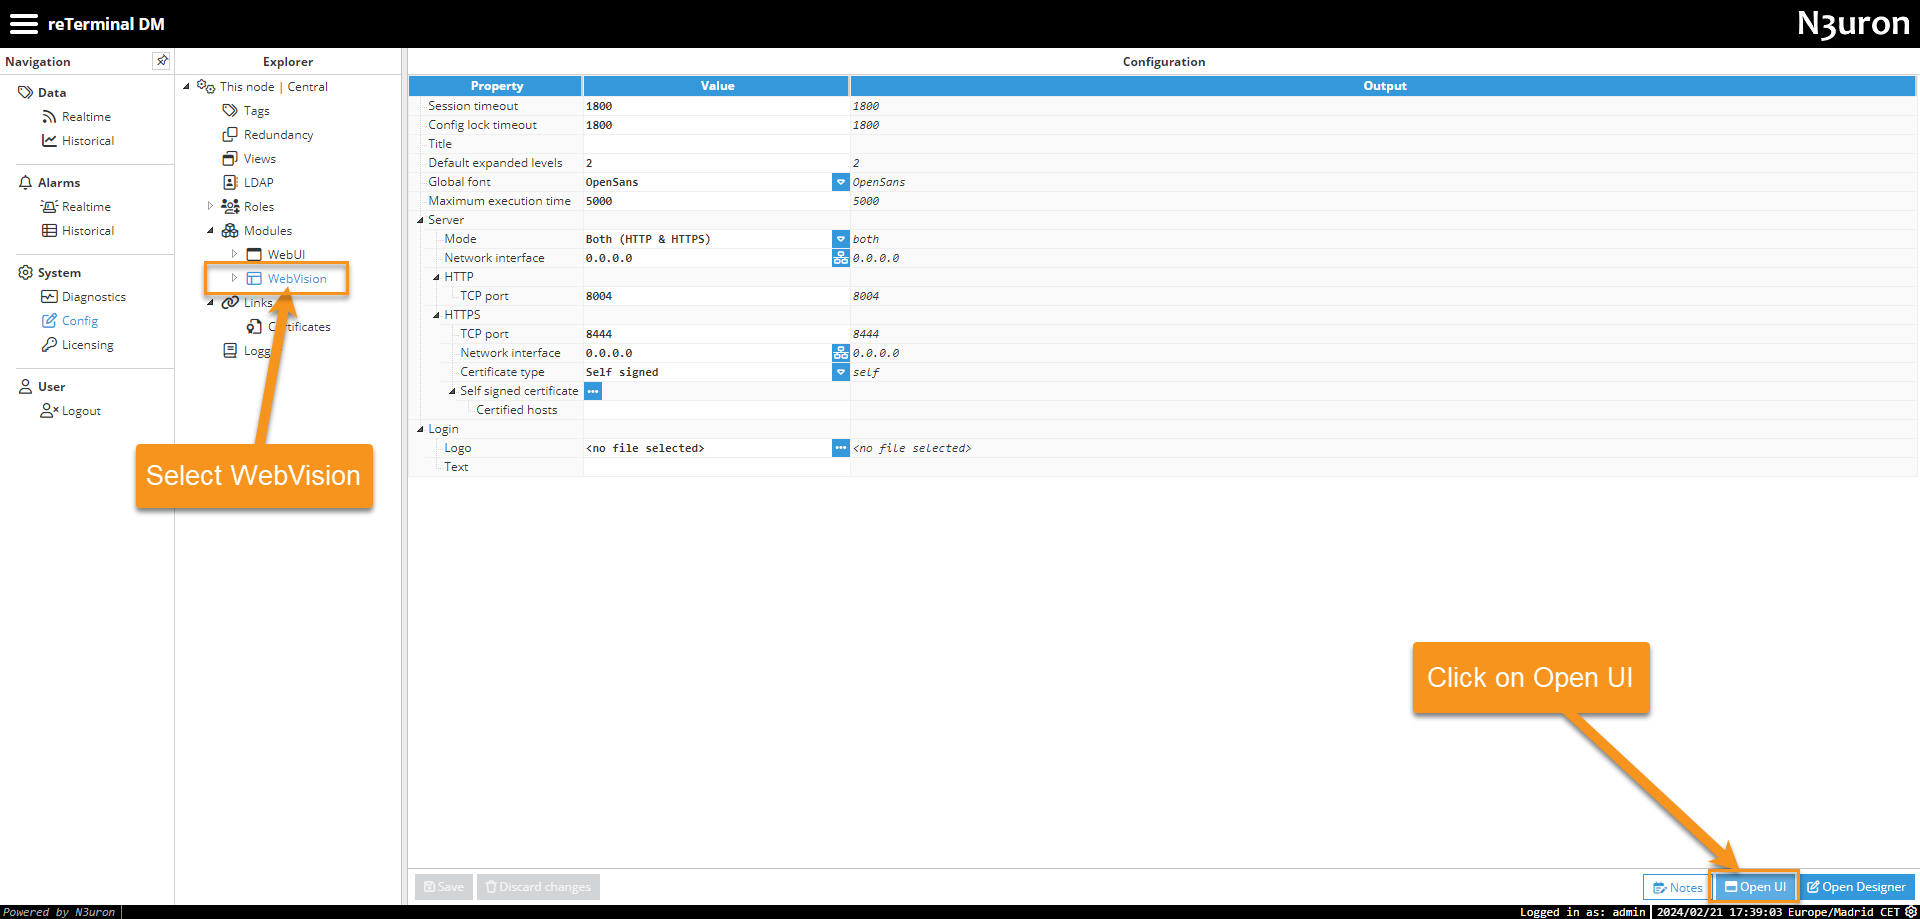
Step 1: Navigate to WebVision
Go to the Config section and click on Open Designer. Log in using your Administrator credentials.

Step 2: Use Existing Main Container
Since we created a Main Container in the last tutorial, we'll use it here as well.

Step 3: Add a Chart Component
Under the New component section, add a Chart and give it a name.

Step 4: Create Historical Dataset
Within the chart, locate the datasets. Tap on the three dots and select New Dataset, then choose HistoricalDataSet.

Step 5: Configure Historical Dataset
Configure the historical dataset by selecting the Tag as Subscribed_value (which subscribes to the AWS IoT Core topic). Set the Mode to raw, Date mode to current, enable autoreload, and set the interval to 5. Set the Date offset to 1 minute.


Step 6: Add Chart Series
Under the chart, select New chartSeries to add a new chart series.

Step 7: Link Historian Dataset to Chart
To link the historian dataset to the chart, select Link dataset and choose the Historian dataset you just created.


You'll now see the line graph. Customize the style for better visibility.

For a deeper understanding of chart attributes, it's recommended to refer to the provided article. N3uron's web interface offers a wide range of widgets with numerous attributes, making it essential to consult their documentation for optimal user experience and interaction. Explore their docs for detailed formatting guidelines and insights into maximizing the potential of the N3uron web interface.
Using the Historian Module generate the graph
For this task, we'll utilize the Historian module to load data. Unlike previous methods where we started from scratch, this approach offers a much easier way to retrieve data in CSV format for future analysis.
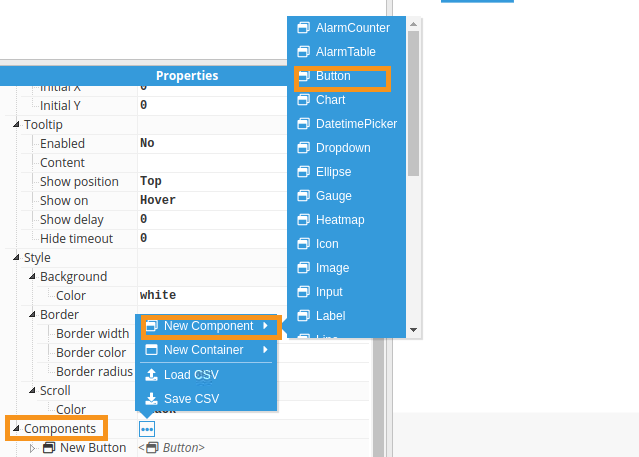
- Step 1: Add Button Component
Add a button component to your UI.
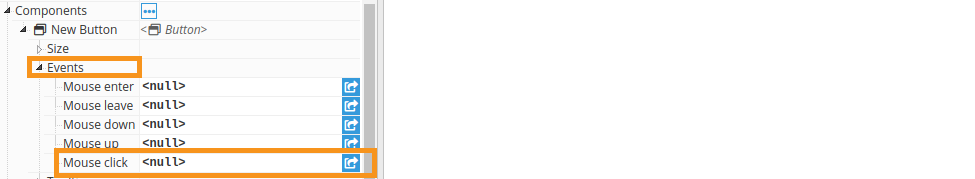
- Step 2: Select Mouse Click Event
Choose Mouse click under events for the button.
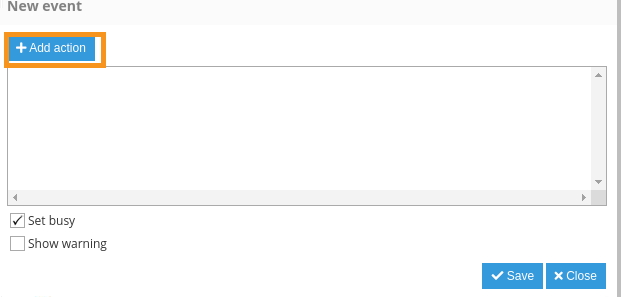
- Step 3: Add Action
Click on Add Action after selecting the mouse click event.
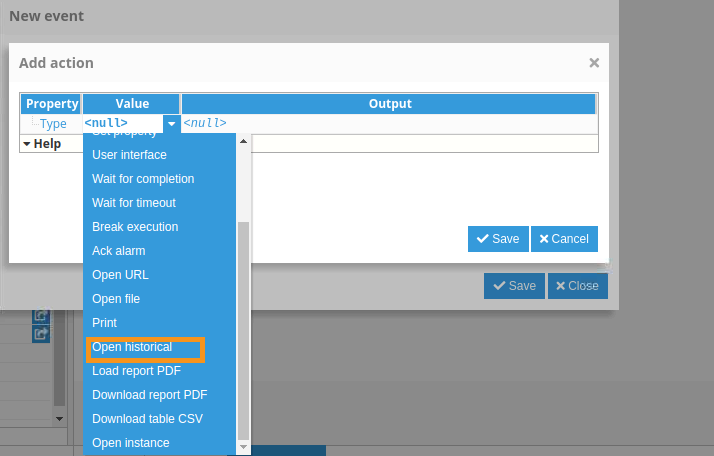
- Step 4: Select Open Historical
Choose Open Historical from the list of actions.
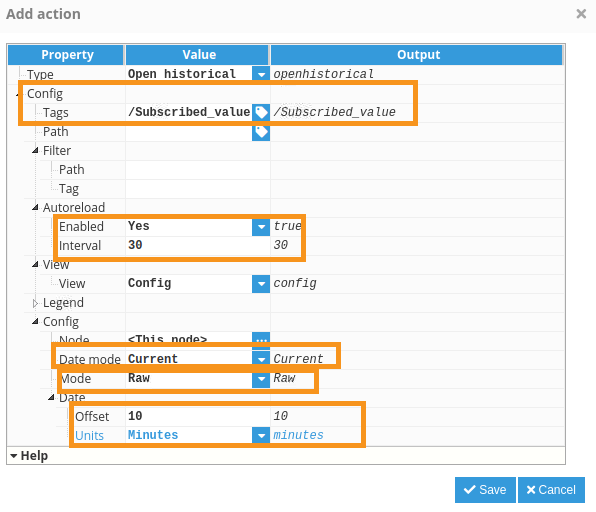
- Step 5: Configure Action Properties
In this step, you'll need to configure the properties of the action according to your requirements. You will Select the tag, enable the over reload, set the date mode, mode, and date offset as well. Adjust these settings as needed to ensure the action behaves as desired.
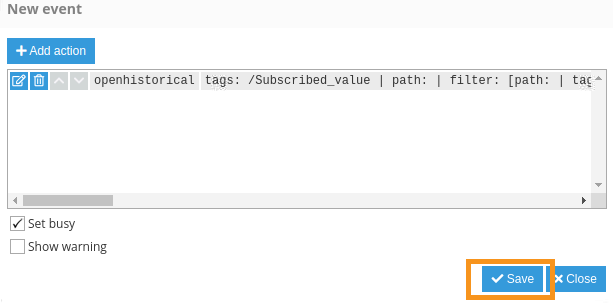
- Step 6: Save the Action
- Step 7: Go to Open UI
Navigate to the Open UI section.
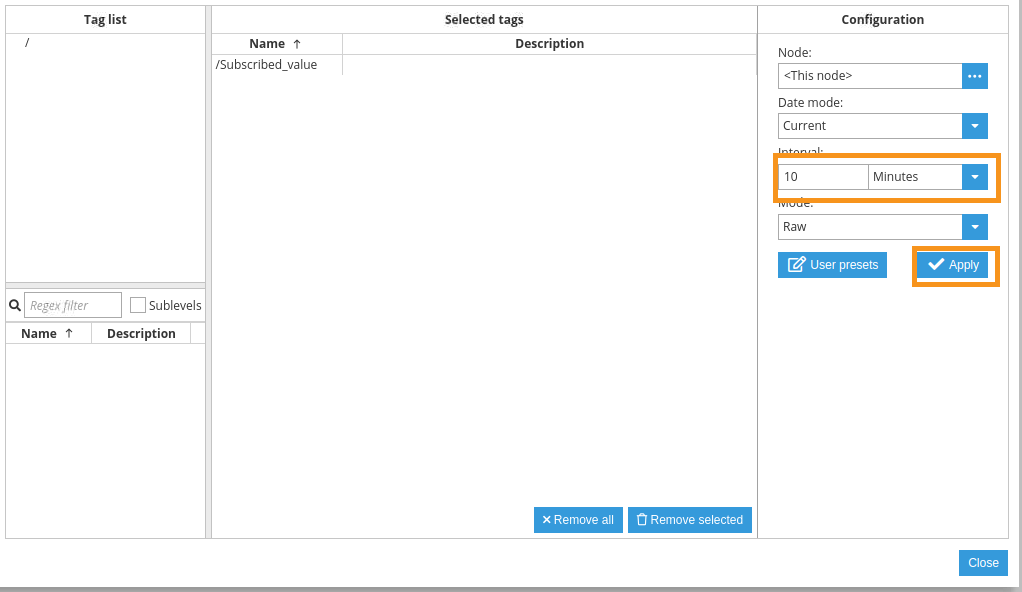
- Step 8: Click on the Button
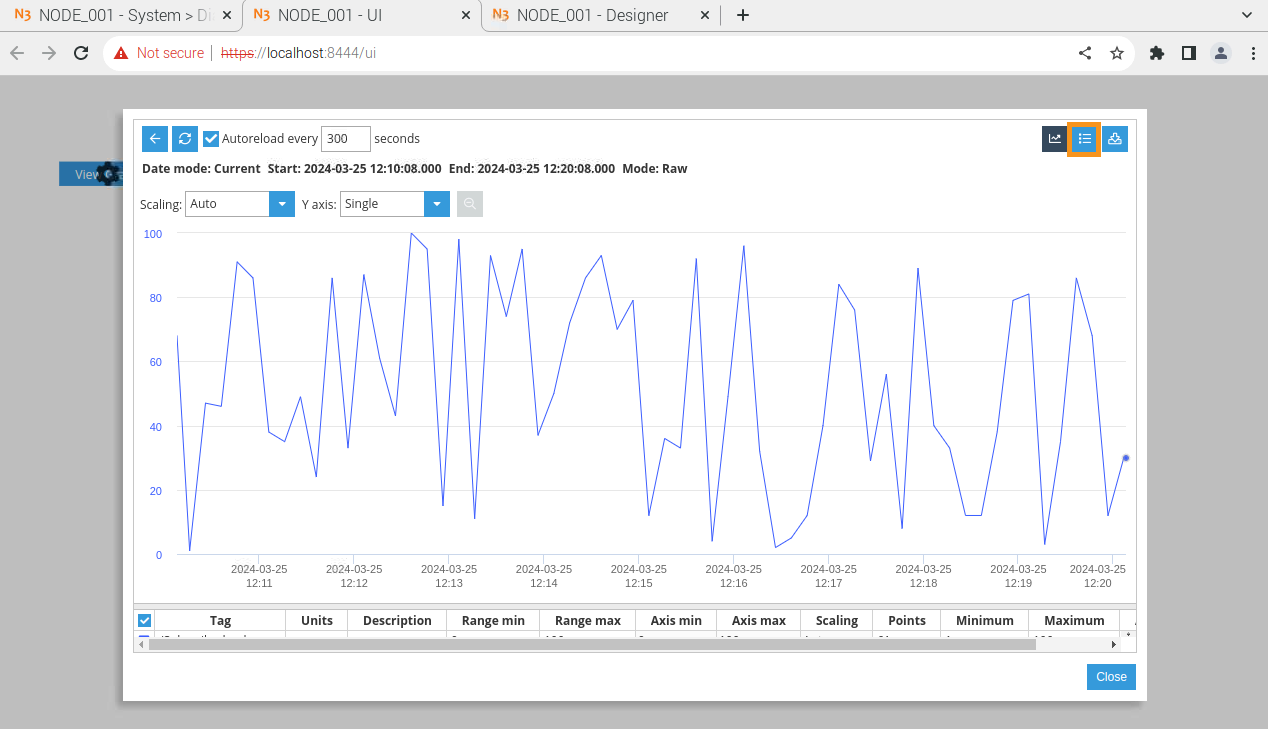
Click on the button you added, and the Historian module will load. Set the interval appropriately for data retrieval.Press Apply to implement the changes. You'll then be able to see the graph.
- Step 9: Enable Auto Reload
Select Auto Reload with an appropriate time interval.
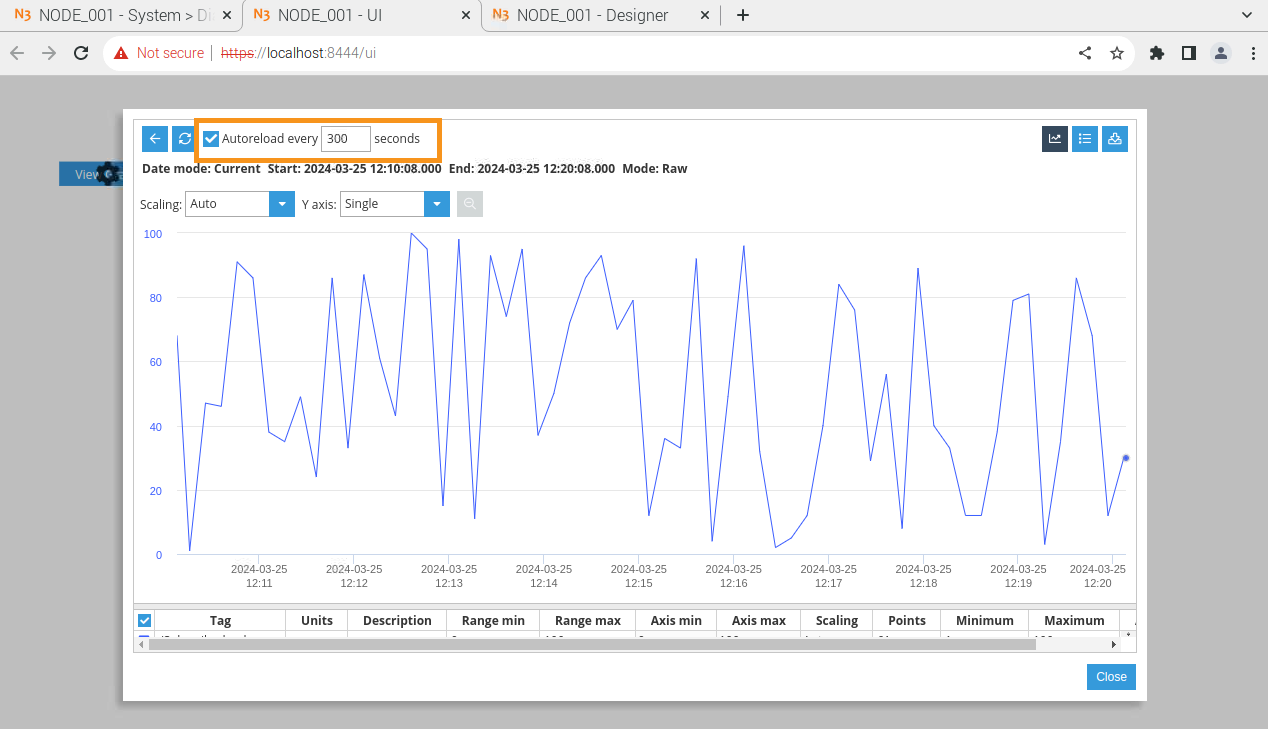
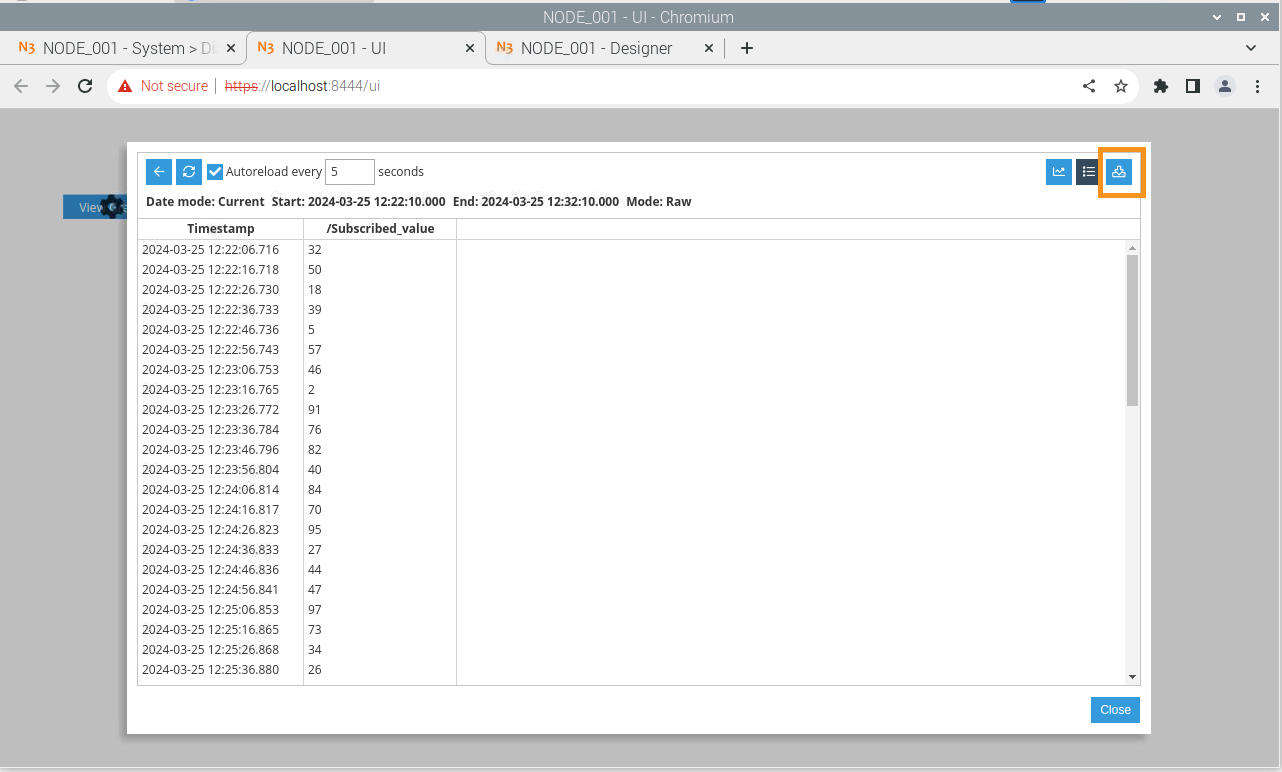
- Step 10: View Data in Tabular Manner
Choose the option to view the data in a tabular manner.
- Step 11: Download Data in CSV Format
Press the button provided to download the data in CSV format.
Tech support
Thank you for choosing our products! We are here to provide you with different support to ensure that your experience with our products is as smooth as possible. We offer several communication channels to cater to different preferences and needs.